Drilling in Results
About Drilling
Many of the results that are displayed in views represent hierarchical data structures. The metadata specifies these hierarchies, and this enables you to access the different levels of detail within them. Drilling is a way to navigate through data in views quickly and easily.
-
Drill down to display data in more detail, which displays more members.
-
Drill up to display less data.
For example, in the results of the Brand Revenue analysis, you can drill for more data in the graph of Revenue by Product. To do this you can click on the MobilePhones data point. More data is displayed in the graph, such as the MobilePhones revenue per sales office for each of the last three years.
Drilling in Tables and Trellises
When you drill down in a table, pivot table, or trellis, the detail level data is added to the current data. For example, when you drill from a continent, the table displays data for the continent and for the countries in that continent.
To drill in an attribute column in tables, pivot tables, and trellises:
-
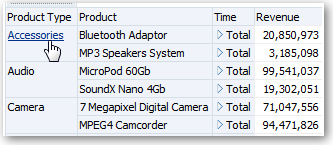
Hover over a value in a view.
The value is underlined.

Description of the illustration views38.gif
-
Click the heading or member in which you want to drill.
More detail is added to the table or trellis.

Description of the illustration views39.gif
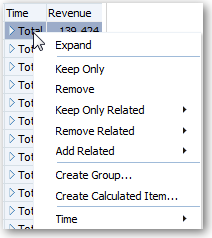
To drill in a hierarchical column in tables, pivot tables, and trellises, click the Expand or Collapse icon beside a member.
You can also use the right-click menu to expand and collapse columns.

Description of the illustration views42.gif
Drilling in Graphs
When you drill down in a graph, the detail level data replaces the current data. For example, when you drill down from a continent, the graph displays data for the countries in that continent, but not for the continent itself.
To drill in a graph:
-
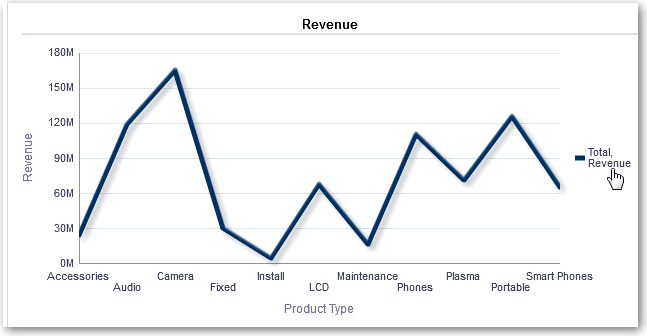
Click a label on any axis or in the legend.

Description of the illustration views43.gif
-
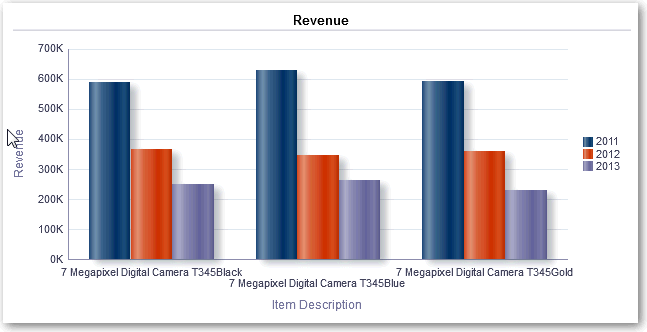
Click on a data point.

Description of the illustration views45.gif
More detail is shown in the graph.

Description of the illustration views48.gif