Linking Views in Master-Detail Relationships
You can link views such that one view drives changes in one or more other views. For example, you can link two views so that when you click a particular Region in a table, your selection affects a graph. The Region on the section slider or prompt in a graph and the data in the graph changes to reflect the Region that you clicked on the table.
You must define the two types of views to link:
-
Master view – Drives data changes in one or more detail views.
The following types of views can be master views: funnel graph, gauge, graph, pivot table, table, and trellis. In a trellis view, only on the outer edges, can be master views, not the inner visualizations.
A master view can be the same analysis as the detail view or in a different analysis. A master view can update the data in one or more detail views.
A master view contains a master column, where you set up the interaction that sends master-detail events on a channel. A channel carries master-detail events to the detail view. The master column cannot be displayed on the page edge or section slider. It must be displayed in the body of the view.
-
Detail view – Responds to master-detail events such as clicking on a value in a master view table.
The following types of views can be detail views: funnel graph, gauge, graph, pivot table, table, and trellis. In a trellis view, only the outer edge can be detail views, not the inner visualizations.
A detail view:
-
Can listen for events from multiple master views
-
Can be in the same analysis as the master view or in a different analysis
-
Cannot act as a master view to another view
-
Defining Master Views
As part of the process of Linking Views in Master-Detail Relationships, you define the master view that sends changes to the detail views.
To define a master view:
-
Open the analysis for editing.
-
For the column that is to be the master column, in the Criteria tab, click the Options button and select Column Properties.
-
On the Column Properties dialog, click the Interaction tab.
-
In the Primary Interaction box in the Value area, select Send Master-Detail Events.
-
In the Specify channel field, enter a name for the channel on which the master view sends master-detail events.
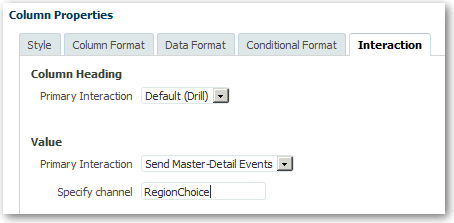
Description of the illustration analysis68.gif
-
Click on the Analysis editor: Results tab to view the default table or pivot table view.
-
(Optional) Create a different view to be the master view.
-
Click OK.
Defining Detail Views
As part of the process of Linking Views in Master-Detail Relationships, you define the detail views that receive changes from the master view.
To define a detail view:
-
Open the analysis for editing.
-
Click on the Analysis editor: Results tab.
-
Create the view that you want to use as the detail view.
-
Edit the view.
-
Click the Property button on the toolbar of the view's editor. The view's property dialog is displayed.
-
Select Listen to Master-Detail Events on one of the following dialogs:
-
Gauge Properties dialog: General tab
-
Graph Properties dialog: General tab (for a graph or funnel graph)
-
Pivot Table Properties dialog: Style tab
-
Table Properties dialog: Style tab
-
-
In the Event Channels field, enter the name of the channel on which the detail view is to listen for master-detail events. The channel name is case-sensitive and must match exactly the channel name specified in the master view. Separate channels with commas, for example, channel a, channel b.
-
Click OK.
In the following example, a table view of a City Revenue analysis is linked to a bar graph through a master-detail relationship.
In the graph view, the City column is configured as the master view. The City column sends events to the graph view through the specified CityChoice channel.
The graph view has a prompt that enables users to choose a city. Data on the graph is displayed based on the city choice.

Description of the illustration views62.gif
The graph is the detail view, with the City prompt listening for events from the table view on the specified CityChoice channel. Suppose the user clicks on a value in the City column in the table view. The, prompt in the graph view is set to that city, and the graph is refreshed.