2 Creating and Editing Reports
This chapter describes how to create and edit BI Publisher reports.
This chapter includes the following topics:
-
Section 2.4, "Creating Reports Using a Direct Connection to a Subject Area"
-
Section 2.8, "Configuring Parameter Settings for the Report"
2.1 About Report Components
A report typically consists of the following components:
-
Data Model
-
Layout
-
Properties
-
Translations
The first step in creating a new report is to select the source of the data for the report. A Data Model defines data that is used by a report. A Data Model may contain multiple data sets and it defines how data fields are structured in relation to each other. It may also contain parameters with lists of values, bursting definitions and other structures or properties that determine how data is provided to a report. For information on creating a data model, see Oracle Fusion Middleware Data Modeling Guide for Oracle Business Intelligence Publisher.
Reports that use Oracle Business Intelligence Subject Areas as the data source do not require a separate data model. For more information, see Section 2.4, "Creating Reports Using a Direct Connection to a Subject Area."
The next step is to design a layout for the report data. The layout defines how the data is presented in the report. A layout consists of a template file and a set of properties for rendering the template file. BI Publisher supports templates created from a variety of sources including Microsoft Word, Adobe Acrobat, Microsoft Excel, Adobe Flash, and BI Publisher's own layout editor. A report can include multiple layouts.
Next, configure properties for the report. The report properties enable you to control many aspects of the report generation, formatting, and display.
Optionally, add translations for the report. BI Publisher's translation support enables you to include translations for individual layouts or for all translatable strings in the layout, data model, and the report metadata.
This chapter describes the process of creating a report by selecting a data model, adding a layout, and configuring properties using the report editor. For more information about report components, see the sections that are listed in the following table.
Table 2-1 Information on Report Components
| Topic | More Information |
|---|---|
|
Creating a data model |
See the Oracle Fusion Middleware Data Modeling Guide for Oracle Business Intelligence Publisher |
|
Selecting a layout type |
|
|
Creating specific layout template types |
Chapter 3, "Creating BI Publisher Layout Templates" Chapter 4, "Creating RTF Templates" Chapter 5, "Creating RTF Templates Using the Template Builder for Word" Chapter 6, "Creating Excel Templates" Chapter 7, "Creating PDF Templates" |
|
Translating reports |
2.2 Creating Reports: Process Overview
The Create Report process guides you through the steps to create a basic report. After creating the basic report, use the report editor to configure the report and create additional layouts.
The Create Report process guides you through the following steps:
-
Launch the Create Report guide to select a data source, and create a basic report. You can create a simple layout using the guide or add the layout later.
-
Edit the simple report layout that you created using the Create Report guide, or create a new layout.
-
Configure the properties for the layout.
-
Configure parameters for the report.
See Section 2.8, "Configuring Parameter Settings for the Report."
-
Configure report properties.
-
Add translations for the layouts. Complete this step if the report requires support for multiple languages.
See Chapter 15, "Translation Support Overview and Concepts."
2.3 Creating Reports
Launch the Create Report guide in one of the following ways:
-
From the global header, click New and then click Report.
-
From the Home page, under the Create region, click Report.
-
On the catalog toolbar, click New and then click Report.
-
From the Data Model editor page, click Create Report.
2.3.1 Selecting a Data Source
Choose one of the following options to begin building your report:
-
Use Data Model
Select an existing data model from the catalog.
Click Next to proceed to Choosing Guide Me or Use Report Editor.
-
Upload Spreadsheet
Upload a Microsoft Excel file (file type.xls or .xlsx). If the uploaded spreadsheet contains multiple sheets, select the sheet to use as the data source. You can include data from only one sheet.
To use multiple sheets in a workbook, you first create a data model that includes each spreadsheet as a data set, and then use that data model as the data source for the report. For more information, see "Creating a Dataset Using a Microsoft Excel File" in Oracle Fusion Middleware Data Modeling Guide for Oracle Business Intelligence Publisher.
Click Next to proceed to Choosing Guide Me or Use Report Editor.
-
Use Subject Area
Select a subject area from the Oracle BI repository. This option enables you to directly query the Oracle BI server and eliminates the need to create a data model in BI Publisher. The Create Report guide limits you to one subject area, however, you can create a report against multiple subject areas using the report editor. For more information, see Section 2.4.3, "Creating a Report Against Multiple Subject Areas."
Click Next to proceed to Choosing Guide Me or Use Report Editor.
2.3.2 Choosing Guide Me or Use Report Editor
Table 2-2 describes the options on the Create Report page.
Table 2-2 Choosing Guide Me or Use Report Editor
| Option | Description |
|---|---|
|
Guide Me |
This option guides you through defining the layout of your data in common predefined report styles. Choose this option to:
Proceed to select the report layout. For more information, see Section 2.3.3, "Selecting the Report Layout." |
|
Use Report Editor |
This option prompts you to save the report and then opens the report editor. Choose this option to proceed to configure the report or to create a more complex layout. For more information, see Section 2.5, "Editing Reports." |
2.3.3 Selecting the Report Layout
When you choose Guide Me, you are prompted to select the report page options. After you select the data source for the report, select the report page options and report layout to define how data is displayed in the report.
To select report layout:
-
Select report page options as follows:
-
Select the Portrait or Landscape page option to define the report page orientation.
-
Select the Page Header option to include the date in the report page header.
-
Select the Page Footer option to include the page number in the report page footer.
-
-
Select one of the following report layouts:
-
Table (default)
-
Chart
-
Pivot Table
-
Chart and Table
-
Chart and Pivot Table
-
Two Charts and Table
-
-
Click Next to proceed.
2.3.4 Choosing Columns for Report Layouts
The layout that you select on the Select Layout page drives the remaining pages that you must complete to create the report. For example, if you select the Table layout, Create Table is the next page displayed.
After you select a layout, select the data source columns to include in the report. As you select columns, sample data for the columns displays on the page. The selected columns display in the order selected.
Keep the following points in mind about sample data:
-
For data models: The Create Report process uses the sample data that is saved to the data model. If sample data is not attached to the data model, the selected column headings display without data.
-
For uploaded spreadsheets: Sample data is displayed from the selected spreadsheet.
-
For subject areas: Sample data is displayed directly from the columns in the subject area.
2.3.4.1 Table Layout
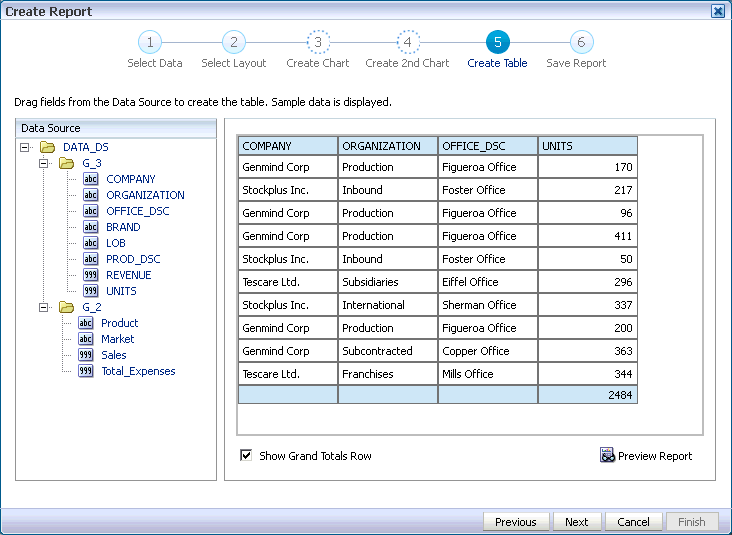
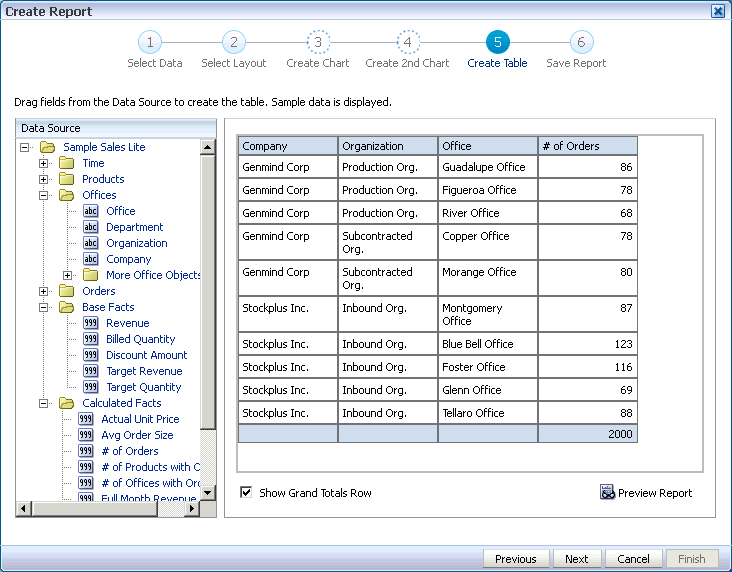
On the Create Table page you add columns to the layout by dragging and dropping them from the Data Source pane to the table area. The columns are displayed in a simple tabular format and the column widths are automatically adjusted based on the number of selected columns as shown in Figure 2-1.
To remove a column from the table, hover your mouse over the upper-right hand corner of the column header and click Delete.
The Show Grand Totals Row option is selected by default to automatically display an aggregated summary row for all columns. Deselect this option to remove the row from the table.
Click Preview Report to display the report in the report viewer.
Click Next to proceed to Saving the Report.
2.3.4.2 Chart Layout
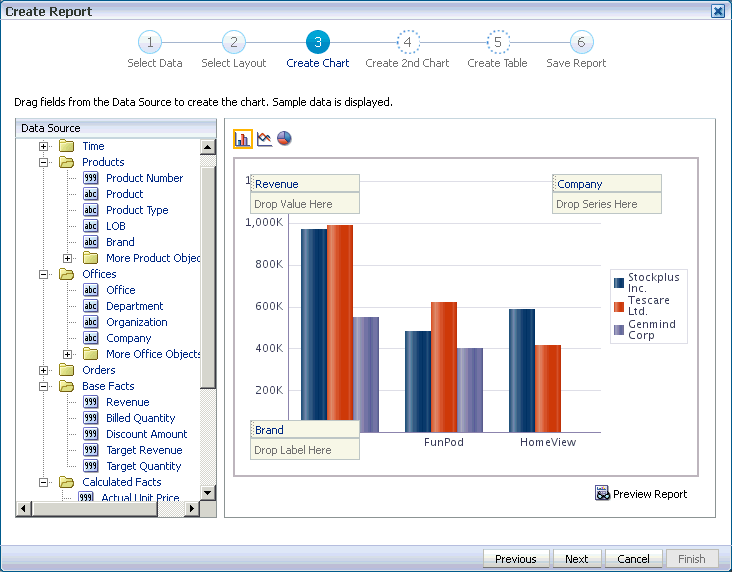
The Chart Layout page supports three types of charts. Choose the chart type by clicking its icon: Bar, Line, or Pie. Add columns to the chart by dragging and dropping them from the Data Source pane to the chart area as shown in Figure 2-2. You can specify two values each to display for the chart Value, Series, and Label.
The layout editor supports a variety of more complex charts. To add more values to this chart or create another chart type, edit this layout in the layout editor after saving the report. For more information on creating layout templates, see Chapter 3, "Creating BI Publisher Layout Templates".
To remove a value from the chart, hover your mouse over the upper-right hand corner of the item label and click Delete.
Click Preview Report to display the report in the report viewer.
Click Next to proceed to Saving the Report.
2.3.4.3 Chart and Table Layout
When you select the chart and table layout, you add columns to the Create Chart page first, click Next, and then the Create Table page displays with the columns that you previously selected for the chart. You can also add additional columns and remove columns on this page.
Click Next to proceed to Saving the Report.
2.3.4.4 Pivot Table Layout
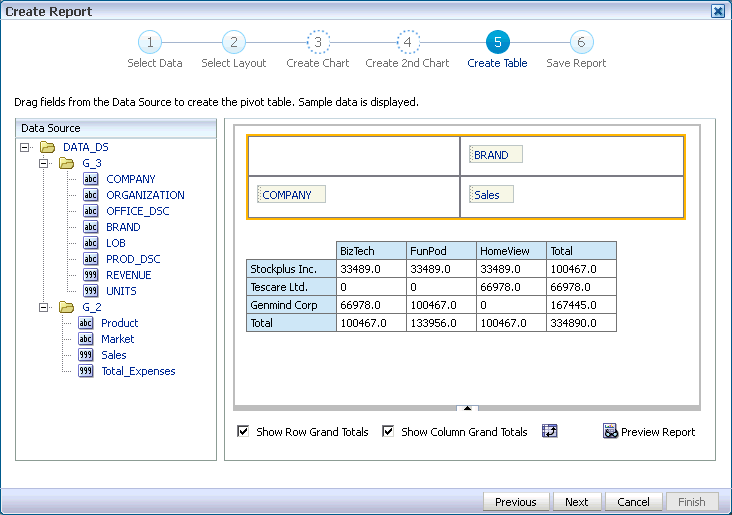
When you select columns for the pivot table layout, the columns display on the Create Table page as shown in Figure 2-3.
The Show Row Grand Totals option is selected by default. Deselect this option to hide the row in the table that includes the grand total for each column.
The Show Column Grand Totals option is selected by default. Deselect this option to hide the column in the table that includes the grand total for each row.
Click Switch Rows and Columns to flip the rows and columns axes.
Click Preview Report to display the report in the report viewer.
Click Next to proceed to Saving the Report.
2.3.4.5 Chart and Pivot Table Layout
When you select the chart and pivot table layout, you add columns to the Create Chart page first, click Next, and then the Create Table page displays with the columns that you previously selected for the chart. You can also add additional columns and remove columns on this page.
Click Next to proceed to Saving the Report.
2.3.4.6 Two Charts and Table Layout
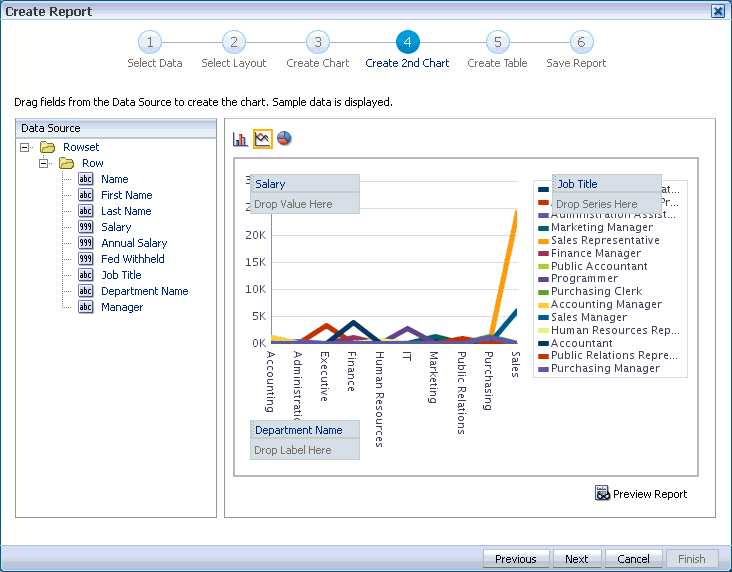
When you select the two charts and table layout, you add columns to the Create Chart page first, click Next, and then the Create 2nd Chart page displays as shown in Figure 2-4.
Once you add columns to the Create 2nd Chart page, click Next to display the Create Table page. The Create Table page displays with the columns that you already selected for the first chart. You can also add additional columns and remove columns on this page.
Click Next to proceed to Saving the Report.
2.3.5 Saving the Report
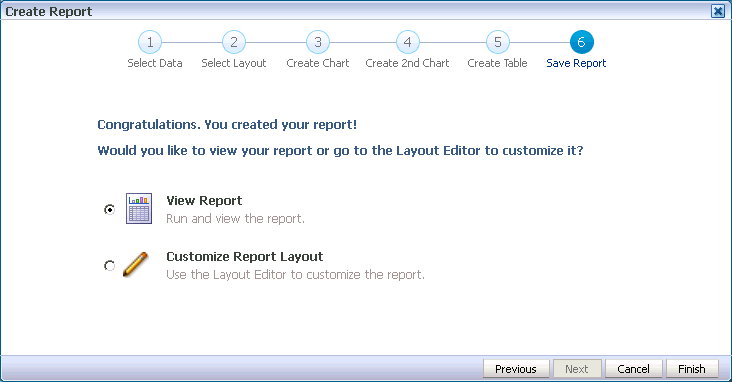
To save the report layout and the columns you added, use the Save Report page as shown in Figure 2-5.
Select one of the following options:
-
To run the report you just created, click View Report and then click Finish. The final page prompts you to save the report. After saving, BI Publisher runs and displays the report in the report viewer.
-
To customize the report layout, click Customize Report Layout and then click Finish. The final page prompts you to save the report. After saving, the report opens in the layout editor.
For more information about additional report options and layouts, see Section 2.5, "Editing Reports."
2.4 Creating Reports Using a Direct Connection to a Subject Area
Subject area reports contain queries that are issued directly to the Oracle BI server, therefore the report does not use a BI Publisher data model.
When you run a report that uses a subject area as a data source, the Oracle BI server optimizes and determines how many queries are actually issued to the database based on the columns selected for the report.
Keep the following points in mind when creating a subject area report:
-
You must use the Create Report guide to create subject area reports.
-
No data model is created for a subject area report. BI Publisher executes the subject area queries as defined in Oracle BI Enterprise Edition to retrieve the report data.
-
In the Create Report guide, you can only select one subject area for a report. To create a report that uses multiple subject areas, first create a report against a single subject area using the Create Report guide and then edit the report in the report editor to add subject areas. For more information, see Section 2.4.3, "Creating a Report Against Multiple Subject Areas."
-
For reports that use a subject area, BI Publisher calculates subtotals and totals based on the data received from the BI Server, which is already summarized. As BI Publisher is not performing the summary calculations, certain functions that require access to the original column data, such as count distinct and average, may deliver different results in BI Publisher.
-
Hierarchical columns that are available in Oracle BI Enterprise Edition are not available for use in subject area reports in BI Publisher.
-
If you require a mix of BI server data with additional data sources such as Excel or SQL queries, you cannot use a subject area report. You must create a data model for the report that issues a SQL query against the Oracle BI server to return one data set, and then create the additional data sets within the data model. For more information, see "Creating Data Sets" in Oracle Fusion Middleware Data Modeling Guide for Oracle Business Intelligence Publisher.
-
Be aware that if you link multiple fields from unrelated subject areas in a single report component such as a graph, table, or pivot table, the rendering of the component may fail because the data cannot be correlated correctly.
2.4.1 Creating Subject Area Reports
To create a subject area report:
-
Launch the Create Report guide.
-
Select a subject area. Only one subject area can be selected.
To report against multiple subject areas, after selecting the first subject area, select the Use Report Editor option, and click Finish to save the report. Then, use the report editor to add the additional subject areas. For more information, see Section 2.4.3, "Creating a Report Against Multiple Subject Areas."
-
Add columns to the report as shown in Figure 2-6.
For more information on adding columns to a report, Section 2.3.4, "Choosing Columns for Report Layouts."
2.4.2 Adding Parameters to Subject Area Reports
Parameters are usually defined in the data model for BI Publisher reports. Reports that run directly against a subject area do not use a data model, therefore, you must use the report editor to set up parameter definitions for subject area reports.
If you intend to use a subject area report in an Oracle BI Enterprise Edition dashboard and you need to use pass parameters, see "Using Prompts with Parameterized Reports" in Oracle Fusion Middleware User's Guide for Oracle Business Intelligence Enterprise Edition for more information.
To add parameters to subject area reports:
-
In report editor, click Parameters to launch the Edit Parameters dialog as shown in Figure 2-7.
-
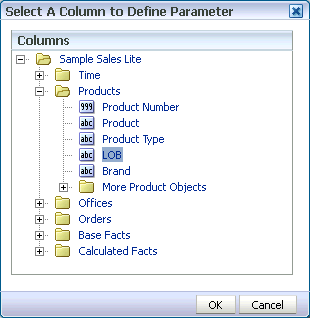
Click Add to launch the Select a Column to Define Parameter dialog as shown in Figure 2-8.
-
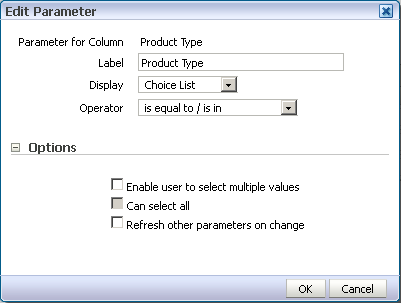
Select a parameter column and click OK to launch the Edit Parameter dialog as shown in Figure 2-9.
The options displayed for selection in the Edit Parameter dialog are driven by the parameter column data type.
-
Enter the parameter label to be displayed in the report.
-
Select a parameter display option:
-
Calendar - Provides users with a field into which they can enter a specific date, as well as a calendar pop-up to select a date. This display option is only available for selection if the parameter has a date column type.
-
Choice List - Provides users with a collapsed list of all prompt values. This display option is useful for a long list of values where you want to provide the user with the ability to search for a specific value.
-
Checkboxes - Provides users with a visible list of all prompt values where a small, selectable box displays before each value item. This display option is suitable for a prompt that contains a smaller set of data.
-
Radio Buttons - Provides users with a visible list of all prompt values where a radio button is displayed before each prompt value. This display option is useful for short lists of values where the user is to select only one prompt value.
-
Text - Provides users with a field into which they can enter a specific prompt value. This display option cannot be used for multiple prompt values. Only the field and the field label are displayed for this option.
-
-
Select the parameter operator. The default value is set to is equal to/is in.
-
Under Options, select the parameter selection options. The selection options control which selections can be passed by the parameter and whether to constrain the parameter selections or not. For more information, see Section 2.8, "Configuring Parameter Settings for the Report."
-
Click OK.
2.4.3 Creating a Report Against Multiple Subject Areas
You can use the report editor to link a report to multiple subject areas.
To add multiple subject areas to a report:
-
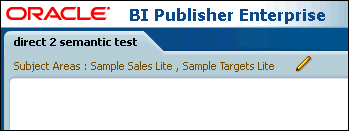
Use the report editor to open the report. The upper left corner displays the subjects areas already linked to the report as shown in Figure 2-10.
-
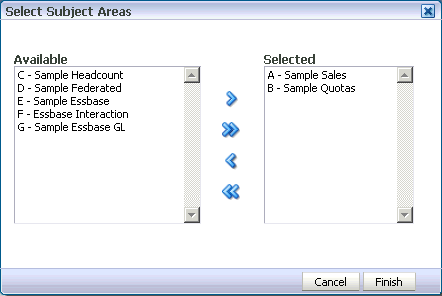
Click Edit Subject Areas to launch the Select Subject Areas dialog as shown in Figure 2-11.
-
From the Available pane, select one or more subject areas.
-
Click Add to move the subject area(s) to the Selected pane.
-
Click Finish.
2.5 Editing Reports
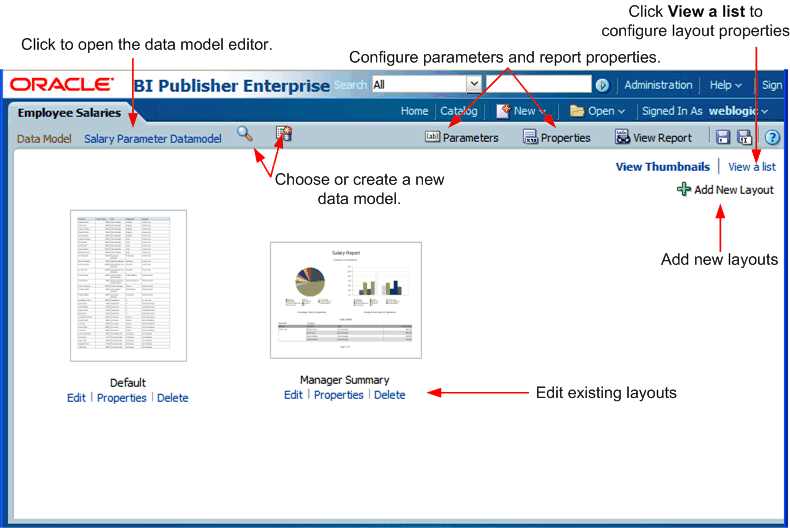
The report editor is shown in Figure 2-12. Navigate to the report editor through the Create Report process flow or by clicking a report's Edit link in the catalog.
Use the report editor to:
-
Add layouts
-
Configure layouts
-
Configure the parameters for this report
-
Configure the report properties
-
Update the data model associated with the report
This procedure addresses these options in the order listed.
2.6 Adding Layouts to the Report Definition
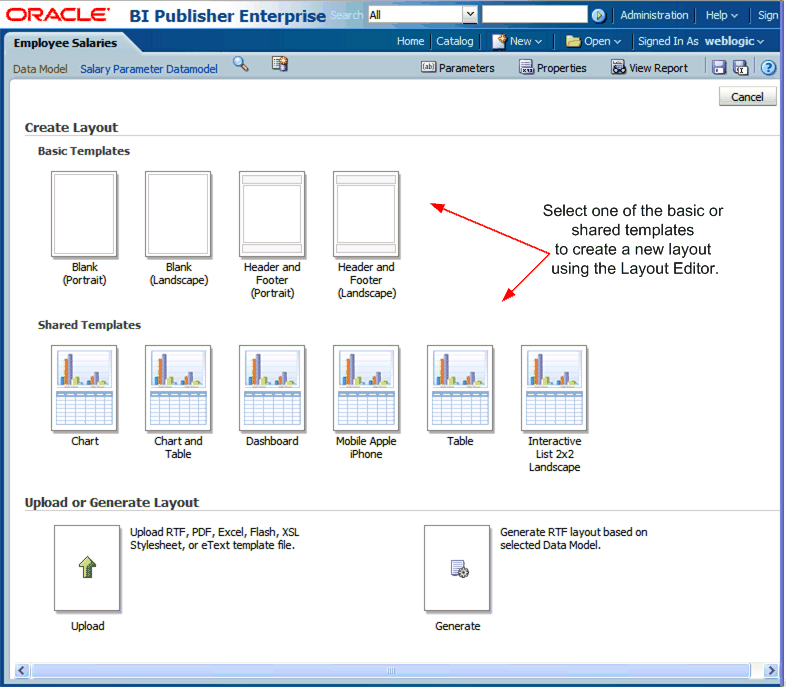
To add a new layout, from the report editor, click Add New Layout. The Add Layout page is shown in Figure 2-13.
There are three options for adding a layout to a report:
-
Create Layout - Select one of the basic or shared templates to launch the Layout Editor.
-
Upload Layout - Upload a template file layout that you have designed in one of the supported file types.
-
Generate Layout - Automatically generate a simple RTF layout.
2.6.1 Adding a Layout Using the Layout Editor
To add a layout using the Layout Editor:
-
Under the Create Layout region, click one of the basic or shared templates to launch the Layout Editor. The shared templates are preformatted layouts with common report components already inserted.
-
Design the template. For information on using the Layout Editor, see Chapter 3, "Creating BI Publisher Layout Templates."
-
When finished, click Save. In the Save Template dialog enter a name for this layout and select a locale. Click Save.
-
Click Return to return to the Report Editor.
-
Configure the settings for the layout. See Section 2.7, "Configuring Layouts Using the List View."
2.6.2 Adding a Layout by Uploading a Template File
Uploading a template file assumes that you have followed the instructions in this guide for creating a template file (RTF, PDF, Excel, Flash, or eText).
To add a layout by uploading a template file:
-
Under the Upload or Generate Layout region, click the Upload icon.
-
In the Upload dialog, perform the following:
-
Enter a Layout Name.
-
Click Browse to locate the Template File in the local file system.
-
Select the Template Type from the list.
-
Select the Template Locale from the list.
-
Click Upload.
-
If you are connected to BI Publisher through the Template Builder you can upload the layout file directly from the client tool.
For more information, see Chapter 5, "Creating RTF Templates Using the Template Builder for Word".
2.6.3 Adding a Layout by Generating a Template File
To add a layout by generating a template file:
-
Under the Upload or Generate Layout region, click the Generate icon.
-
In the Autogenerate Layout dialog, perform the following:
-
Enter a Template Name for the layout.
-
Click Generate.
-
The autogenerate feature creates a simple table-based RTF layout that includes all the fields in the data model.
Note:
The autogenerate layout feature can only be used with data sets for which metadata is available. Therefore this feature cannot be used with data sets generated from stored XML files, HTTP feeds, Web services, or migrated data templates.
2.7 Configuring Layouts Using the List View
After creating or uploading the layouts for the report, you can configure settings for the layout from the List View. Figure 2-14 shows the List View.
2.7.1 Applying a Style Template to the Layout
A style template contains style definitions that are applied to the paragraphs, headings, tables, and headers and footers of a report. A style template is optional and can only be applied to an RTF template file.
For more information on creating a style template, see Chapter 11, "Creating and Implementing Style Templates."
If you want to apply a style template to this layout, then click Choose to browse for and select the style template. To then apply the style template to an individual layout in the list, select the Apply Style Template box for that layout in the list of properties.
2.7.2 About the Layouts Toolbar
The Layout toolbar buttons are described in Table 2-3.
Table 2-3 Layout Toolbar Buttons
| Toolbar Button | Description |
|---|---|
|
Create |
Launches the add layout page to upload or create a new layout. |
|
Edit |
Launches the Layout Editor for the selected layout. This button is enabled for BI Publisher layouts (.xpt) only. |
|
Properties |
Launches the Properties page to enable the upload of localized templates and XLIFF files to associate with this layout. This button is enabled for RTF (.rtf) and BI Publisher layouts (.xpt) only. For more information on localizing templates, see Chapter 15, "Translation Support Overview and Concepts." |
|
Delete |
Deletes the selected layout. |
2.7.3 Configuring the Layout Settings Using the List View
The List View settings enable you to configure the following settings for the layout. The settings are described in Table 2-4.
| Setting | Description |
|---|---|
|
Name |
Place the cursor in the text box to enter a new name for the layout. |
|
Template File |
Displays the name of the file that was saved to the report definition. Click the template file name to download it. |
|
Type |
Displays the template file type. |
|
Output Formats |
Select the output types to be enabled for this layout. By default, all valid output types for a layout are enabled. The layout type determines the output types available. See Section 2.7.4, "Selecting Output Formats" for the complete list. |
|
Default Format |
Select the default output format for this layout when viewed or scheduled. |
|
Default Layout |
Select the layout that this report uses by default when viewed online or scheduled. Only one box in this column can be checked. |
|
Apply Style Template |
Select this box to apply the style template to this layout. Note that a style template can only be applied to RTF template files. For more information, see Section 2.7.1, "Applying a Style Template to the Layout". |
|
Active |
By default a layout is active. Clear this box when you want to keep the layout as part of the report definition, but no longer make it available. When a layout is inactive it does not display in the report viewer or the scheduler. |
|
View Online |
By default, a layout is available for report consumers who open the report in the Report Viewer. If this layout is for scheduled reports only, clear this box. |
|
Locale |
Displays the locale selected when the layout was uploaded. This field is not updatable. |
2.7.4 Selecting Output Formats
BI Publisher supports a wide range of output formats. Different layout types support different output types. Table 2-5 lists all possible output types. Table 2-6 lists valid output formats for each layout type.
| Output Format | Description |
|---|---|
|
Data (CSV) |
Enable this option to generate comma separated value output. |
|
Data (XML) |
Enable this option to generate XML output. |
|
Excel (mhtml) |
Enable this output type to view the report in Excel when report consumers have Microsoft Excel 2003. This option generates an MHTML format file that can be opened in Excel 2003 or later. This option supports embedded images, such as charts and logos; nested tables are not supported. |
|
Excel (html) |
Enable this output type only when report consumers are running the earlier versions of Microsoft Excel 2000 or 2002. This option generates HTML that can be opened in Excel. It does not support embedded images or nested tables. |
|
Excel (*.xlsx) |
Enable this option to generate the report in Excel.xlsx (Excel XML format). If your report consumers have Excel 2007 or later installed, this option provides the best preservation of layout and formatting. Note: For this output format BI Publisher does not apply any formatting for number and date. BI Publisher saves the formatting mask and the actual value (date or number) into the XLSX output file. The formatting is handled by Microsoft Excel. For example:
|
|
FO Formatted XML |
This option generates a XSL-FO (Extensible Stylesheet Language Formatting Objects) file. This output type is useful for debugging templates. |
|
HTML |
Enable HTML output for reports that require browser viewing. |
|
Interactive |
This output is only available for layouts designed using BI Publisher's Layout Editor. Interactive output enables pop-up chart value displays, scrollable and filterable tables, and other interactive features for a report. |
|
MHTML |
Enable Mime Hyper Text Markup Language to allow the report consumer to save a Web page and its resources as a single MHTML file (.mht), in which all images and linked files are saved as a single entity. A report consumer would use this option to send or save HTML output and retain the embedded images and stylesheet formatting. |
|
|
Portable Document Format is commonly required for reports that require printing or sharing. |
|
PDF/A |
Use for reports that require long-term preservation or archiving. PDF/A is a specialized subset of the PDF standard that prohibits elements that may interfere with the preservation of the file as a self-contained document. For more information see Section E.1, "Generating PDF/A Output." |
|
PDF/X |
Use for reports that require formatting for prepress graphics exchange. PDF/X is a specialized subset of the PDF standard that streamlines documents for high-quality print production output and restricts content that does not serve the print production, such as signatures, comments, and embedded multimedia. For more information see Section E.2, "Generating PDF/X output." |
|
PowerPoint (mhtml) |
Enable this output type to generate a PowerPoint file compatible with Microsoft PowerPoint 2003. Note that Microsoft PowerPoint 2010 does not support this output type. Choose PowerPoint (*.pptx) instead. |
|
PowerPoint (*.pptx) |
Enable this output type to generate a Microsoft PowerPoint file in Microsoft Office Open XML format. This output type is supported for versions of Microsoft PowerPoint 2007 and later. |
|
RTF |
Rich Text Format. Enable this output for reports that must be opened for editing. |
|
Text |
This option generates text output for eText templates. Text output is available only for eText templates. |
|
Word |
Generates Microsoft Word .docx file. |
|
Zipped PDFs |
BI Publisher can generate a zip file containing the report PDF output and index files. This option is only available for layouts that have been designed to enable zipped PDF output. For information on designing a report to generate zipped PDF, see Section A.2, "Generating Zipped PDF Output." |
Note:
Data (CSV) and Data (XML) output formats are available for all layout types. However, when you select either of these formats, no layout formatting is applied and only data is included in the output.
Table 2-6 Valid Output Formats for Each Layout Type
| Layout Type | Valid Output Types |
|---|---|
|
BI Publisher template created using the layout editor (XPT) |
Data (CSV), Data (XML), Excel (mhtml), Excel (html), FO Formatted XML, HTML, Interactive, MHTML, PDF, PDF/A, PDF/X, PowerPoint (mhtml), PowerPoint (*.pptx), RTF, Word, Zipped PDFs |
|
RTF template (RTF) |
Data (CSV), Data (XML), Excel (mhtml), Excel (html), Excel (*.xlsx), FO Formatted XML, HTML, MHTML, PDF, PDF/A, PDF/X, PowerPoint (mhtml), PowerPoint (*.pptx), RTF, Word, Zipped PDFs |
|
PDF template (PDF) |
Data (CSV), Data (XML), PDF, Zipped PDFs |
|
Excel template (XLS) |
Data (CSV), Data (XML), Excel (*.xls), Excel (html) |
|
Flash template (SWF) |
Data (CSV), Data (XML), Flash, MHTML, PDF |
|
XSL Stylesheet (FO) (XSL) |
Same outputs as RTF template |
|
XSL Stylesheet (HTML XML/Text) (XSL) |
Data (CSV), Data (XML), HTML, Text |
|
eText template (RTF) |
Data (CSV), Data (XML), Text |
|
Analyzer template (XPA) |
(Supported for backward compatibility only.) Analyzer templates can be uploaded from previous versions of BI Publisher. The Online Analyzer in current versions of BI Publisher exports the online analysis to layout editor templates (.xpt). |
2.8 Configuring Parameter Settings for the Report
Parameters are defined in the data model. The report editor enables you to configure the parameter settings specifically for each report that uses the data model.
To configure the parameters for this report:
-
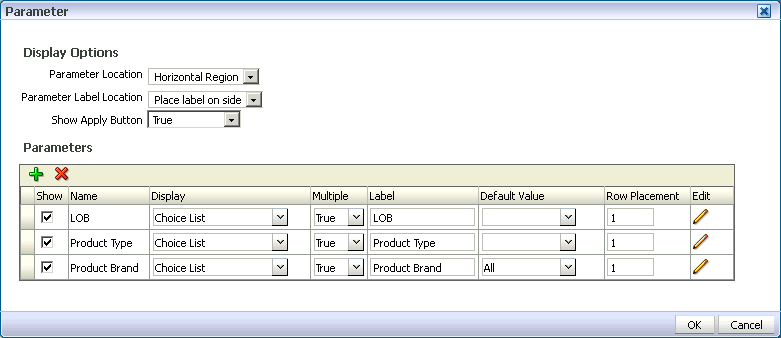
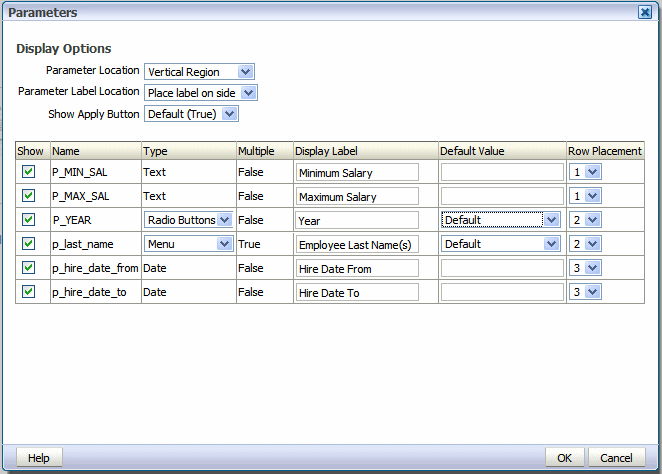
On the Report Editor page, click Parameters. The Parameters dialog is displayed as shown in Figure 2-15.
-
Customize the parameter settings for this report by making selections for the following display options:
This property controls where the parameter region is displayed in the report viewer. The options are:
-
Horizontal Region - displays the parameters horizontally across the top of the report viewer
-
Vertical Region - displays the parameters vertically along the left side of the report viewer
-
Full Page - displays the parameters on a separate page in the report viewer. After a user enters parameter values, the page is dismissed. To change parameter values, click the report viewer Parameters button to display the parameters page again.
-
Dialog - invokes a dialog box to display the parameters. After a user enters parameter values, the dialog is dismissed. To change parameter values, click the report viewer Parameters button to display the dialog again.
This property controls where the parameter labels are displayed. The options are:
-
Place label on side - places the parameter label to the left side of the entry box.
-
Place label on top - places parameter label on top of the entry box.
This property controls the display of the Apply button in the report viewer.
When set to True, reports with parameter options will display the Apply button in the report viewer. When a user changes the parameter values, he must click Apply to render the report with the new values.
When set to False, the report viewer does not display the Apply button. Instead, when a user enters a new parameter value, BI Publisher automatically renders the report after the new value is selected or entered without further action from the user.
This property is also set at the server level. To always use the server setting, choose the Default option. For information about configuring the server setting, see "Setting Report Viewer Properties" in Oracle Fusion Middleware Administrator's Guide for Oracle Business Intelligence Publisher.
When deciding whether to remove the Apply button consider the ability of the underlying data sources to quickly return data. Lists of values that are based on static lists or very fast data sources are ideally suited to turning off the Apply button. If the underlying data sources for the lists of values queries are slow, or if there are many parameter values to set and refine before rendering the report, then retaining the Apply button is recommended.
This property controls whether the parameter is displayed to the user. Disable the Show property if you do not want the user to see or change the parameter values that are passed to the data model.
This property is customizable for menu type parameters only. For menu type parameters, the following display options are available:
-
Checkbox
If the parameter allows multiple selections, (Multiple = True) this option is available. The checkbox type displays all menu options in the parameter region of the report. Users can make multiple selections, as shown Figure 2-16.
-
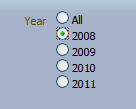
Radio button
If the parameter allows only a single selection (Multiple = False), this option is available. The radio button type displays all menu options in the parameter region of the report. Users can make a single selection as shown in Figure 2-17.
Tip:
The checkbox and radio button options are best suited for menus when the list of values is small. These options also display well when the Parameter Location is the vertical region.
This property is display only; it indicates whether multiple values may be selected for a menu parameter.
Use this property to edit the display labels shown for each parameter. The default values are defined in the data model.
Use this property to configure the default value for the parameter specifically for this report. Choose "Default" to pass the default value defined in the data model.
Use this property to configure the number of rows for displaying the parameters and in which row to place each parameter. For example, if your report has six parameters, you can assign each parameter to a separate row, 1 - 6, with one being the top row; or, you can assign two parameters each to rows 1, 2, 3. By default, all parameters are assigned to row 1.
Note that when the Parameter Location property is set to Vertical Region, only one parameter displays per row. You can use the Row Placement property to order the rows vertically.
2.9 Configuring Report Properties
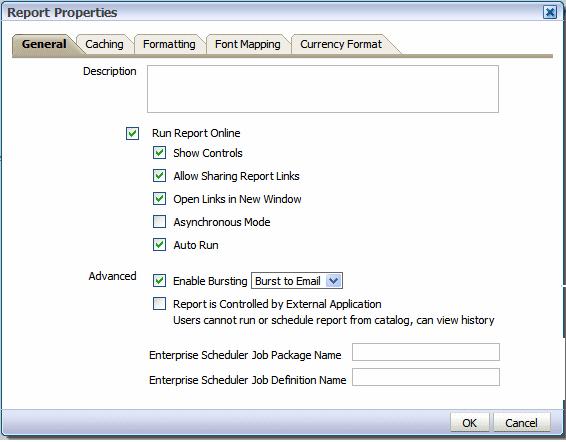
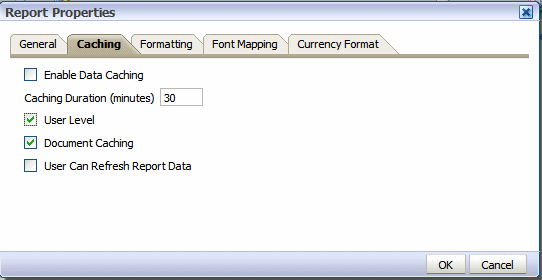
Launch the Report Properties dialog by clicking Properties in the page header. Figure 2-18 shows the Report Properties dialog.
The Report Properties dialog has the following option sets:
-
General - Set general properties for the report.
-
Caching - Specify caching options for this report.
-
Formatting - Set the runtime configuration properties for the report. See Chapter 10, "Setting Report Processing and Output Document Properties" for information on setting these properties.
-
Font Mapping - Create font mappings for this report.
-
Currency Format - Define currency formats for this report.
2.9.1 Setting the General Properties
Set the properties on the General tab as follows:
2.9.1.1 Description
(Optional) Enter a description to display with the report in the catalog. This text is translatable.
2.9.1.2 Run Report Online
Disable this property if you do not want users to view this report in the online Report Viewer. When disabled, users can Schedule the report only. For most reports you keep this enabled. Disable it for long-running, batch, or other reports for which online viewing is not appropriate. When this property is enabled, you can also set the properties that are described in Table 2-7.
Table 2-7 Run Report Properties
| Property | Description | Default |
|---|---|---|
|
Show controls |
This property controls the display of the control region of the report. The Control region consists of the Template list, Output list, and Parameter lists. Disable this property if you do not want users to view and update these options. |
Enabled |
|
Allow Sharing Report Links |
The Actions menu of the Report Viewer includes the option Share Report Link, which enables users to display the URL for the current report. Disable this property if you do not want users to see and copy the report link. |
Enabled |
|
Open Links in New Window |
This property controls how links contained within a report are opened. By default links open in a new browser window. Disable this property to open links in the same browser window. |
Enabled |
|
Asynchronous Mode |
Reports run in asynchronous mode use a unique thread to execute the report when run in the report viewer. This allows BI Publisher to cleanly terminate the thread if a user cancels the report execution. Note that there are performance implications when enabling this property. |
Not Enabled |
|
Auto Run |
When this property is enabled the report automatically runs when the user selects the Open link for the report. When Auto Run is disabled, selecting the Open link for the report displays the online viewer but does not run the report. The user must select an output type from the View Report menu to run the report. |
Enabled |
2.9.1.3 Advanced Options
Table 2-8 describes the Advanced properties.
Table 2-8 Description of Report Properties Advanced Options
| Property | Description |
|---|---|
|
Enable Bursting |
To enable bursting of the report output, select this box and then select the appropriate bursting definition from the list. When a user schedules the report, the selected bursting definition will be enabled in the Scheduler. The bursting definition is a component of the data model. For more information, see "Adding Bursting Definitions" in Oracle Fusion Middleware Data Modeling Guide for Oracle Business Intelligence Publisher. |
|
Report is Controlled by External Application. Users cannot run or schedule report from catalog, can view history |
Enable this option when BI Publisher is integrated with another application that controls the running of this report and you do not want users to run and view this report directly from the catalog. Reports run by BI Publisher are stored in the BI Publisher history tables and users can view completed reports from the Report Job History page. |
|
Enterprise Scheduler Job Package Name |
This property applies to Oracle Fusion Applications implementations only. |
|
Enterprise Scheduler Job Definition Name |
This property applies to Oracle Fusion Applications implementations only. |
2.9.2 Setting the Caching Properties
Figure 2-19 shows the Caching tab.
Table 2-9 describes the properties on the Caching tab.
| Variable | Description | Default |
|---|---|---|
|
Enable Data Caching |
When this property is enabled, the data generated by the online submission of this report is stored in the cache. Subsequent requests to run this report with the same parameter selections display the report using the data that is stored in the cache. This setting enhances performance by using stored data to generate a report rather than regenerating the data from the source. The data remains in the cache according to the time limit that is specified in the Cache Duration property. You can control whether the cache for the report is shared by users by setting the User Level property. When data caching is enabled, you have the options of setting the following properties: |
Not Enabled |
|
Caching Duration (Minutes) |
Enter the time limit for a report data set or document to remain in cache. Once the time limit has expired, the next request for the same report generates a fresh data set. |
30 minutes |
|
User Level |
This property stores a separate cache for each user. The report data shown to each user comes only from the private cache. When enabled, this property ensures that each user can only see data that they are authorized to view. However, user-level cache has less efficient performance. If the report data is not user sensitive, you can disable this property to enhance performance. |
Enabled |
|
Document Caching |
Enable this property to cache the report document. With document cache enabled, when a user views the report online, the document (data plus layout) is placed in the cache. When any other user (unless User Level is enabled) uses the online viewer to view the exact same report (same layout, same output type, same parameter selections) the document is retrieved from the cache. The document remains in the cache according to the caching duration specified. Note that scheduled reports do not use document cache. |
Enabled |
|
User Can Refresh Report Data |
When this property is enabled, the user can choose to refresh the data on demand. When the user clicks Refresh in the report viewer, BI Publisher generates a fresh data set for the report. |
Not Enabled |
2.9.3 Setting the Formatting Properties
The Formatting properties tab enables you to set runtime properties at the report level. These same properties can also be set at the system level, from the Administration page. The Formatting properties tab displays both the system-level setting and the report-level setting for each property. If different values are set at each level, the report level takes precedence.
For a full description of each property, see Chapter 10, "Setting Report Processing and Output Document Properties."
2.9.4 Configuring Font Mapping
BI Publisher's font mapping feature enables you to map base fonts in RTF or PDF templates to target fonts to be used in the published document. Font mappings can be set at the report level or the system level. When you view the report properties Font Mapping tab, any system level settings are displayed. To change the settings for this report, edit the font mappings here.
For detailed information on font mapping, see Section 10.17, "Defining Font Mappings."
To create a font mapping:
-
Under RTF Templates or PDF Templates, select Add Font Mapping.
-
Enter the following on the Add Font Mapping page:
-
Base Font: Enter the font family to map to a new font. Example: Arial
-
Select the Style: Normal or Italic (Not applicable to PDF Template font mappings)
-
Select the Weight: Normal or Bold (Not applicable to PDF Template font mappings)
-
Select the Target Font Type: Type 1 or TrueType
-
Enter the Target Font.
If you selected TrueType, then you can enter a specific numbered font in the collection. Enter the TrueType Collection (TTC) Number of the desired font.
For a list of the predefined fonts, see Section 10.17.4, "BI Publisher's Predefined Fonts."
-
2.9.5 Configuring Currency Formats
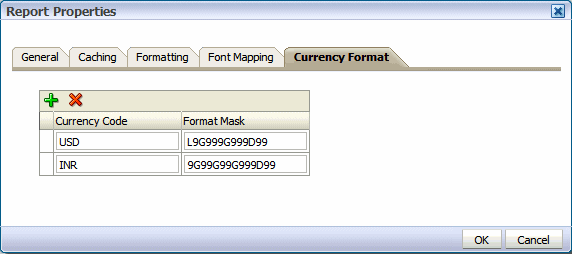
The Currency Formats tab enables you to map a number format mask to a specific currency so that reports can display multiple currencies with their own corresponding formatting. Currency formatting is only supported for RTF and XSL-FO templates.
Currency formats can be set at the report level or the system level. When you view the report properties Currency Formats tab, any system level settings are displayed. To change the settings for this report, edit the currency formats here.
To apply these currency formats in an RTF template, you must use the format-currency function. See Section 4.15.14, "Formatting Currencies" for detailed procedures.
To add a currency format:
-
Click the Add icon.
-
Enter the ISO currency code, for example: USD, JPY, EUR, GBP, INR.
-
Enter the format mask to apply for this currency.
The Format Mask must be in the Oracle number format. The Oracle number format uses the components "9", "0", "D", and "G" to compose the format, for example: 9G999D00
where
9 represents a displayed number only if present in data
G represents the group separator
D represents the decimal separator
0 represents an explicitly displayed number regardless of incoming data
For more information about these format mask components, see Section 4.15.6, "Using the Oracle Format Mask."
Figure 2-20 shows sample currency formats.
2.10 Accessing Reports via a URL
This section describes how to call a BI Publisher report via a URL from another application; for example, from a portal or from an Application Express application. It contains the following topics:
2.10.1 Security Considerations
In the BI Publisher security model, reports are placed in folders and those folders are then secured to a role and a role assigned to a user. For a user to successfully access the report, you must ensure that the user is credentialed within BI Publisher to see it. There are two options for this:
-
Use the Guest folder
Reports in the Guest folder are available to all users to see and run. Use this option if the report does not contain sensitive data. Enable the Guest folder on the Security Configuration tab of the Security Center page. For more information, see Enabling a Guest User in the Oracle Fusion Middleware Administrator's Guide for Oracle Business Intelligence Publisher.
-
Use SSO
If both the calling application and BI Publisher are configured as partner applications in an SSO server, you can call any report via a URL, and, as long as the user has rights to see or run the report, then BI Publisher will render it without the need for the user to log in. For more information on setting up security options, see Configuring Single Sign-On in Oracle Fusion Middleware Administrator's Guide for Oracle Business Intelligence Publisher.
2.10.2 Building the URL
The basic URL for a report is:
http://<server:port>/xmlpserver/<ReportDirectory>/<ReportName>.xdo
where
server:port - is the name of the server and port number where BI Publisher is runningxmlpserver - is a required static string (the name of the application)ReportDirectory - is the folder path to the report. When the report is under Shared Folders, do not include "Shared Folders" in the path. If the report is under My Folders, include the ~username as the first node in the path. See the examples following.ReportName.xdo - is the name of the report with the .xdo extension. If the name contains spaces, replace the space with a "+" character.Examples:
The following URL launches the "North America Sales" report. The report resides in the catalog under Shared Folders/Samples/Sales. Note that "Shared Folders" is not included in the path.
http://example.com:7001/xmlpserver/Samples/Sales/North+America+Sales.xdo
The following URL launches the "North America Sales" report that resides in the catalog under My Folders/Samples/Sales. Note that the user name in this case is "weblogic", therefore the first node in the path is ~weblogic.
http://example.com:7001/xmlpserver/~weblogic/Samples/Sales/North+America+Sales.xdo
2.10.3 Specifying Parameters in the URL
The preceding examples render the complete report inside the BI Publisher report viewer with all the report controls. The default layout, default output format, and default parameters are used to render the report. You can add parameters to the URL to specify how the report renders.
When constructing the URL, note the following standard URL syntax:? - denotes the first parameter& - denotes each additional parameter
The following table describes more parameters you can add to the URL.
| Parameter | Definition | Example Usage |
|---|---|---|
|
_xpt |
Specifies whether to render the report in the BI Publisher report viewer or export the document to a new window appropriate for the output type. For example, if the output type specified is html, the report document (only) will render in a browser window; if the output type is PDF you will be prompted to save or open the PDF document. When this parameter is not specified, the report renders in the BI Publisher report viewer. Valid values are:
|
_xpt=0 |
|
_xdo |
(Optional) Provides the path to the report. |
_xdo=%2FSamples%2FSalary+Report.xdo |
|
_xt |
Specifies the layout to use. Enter the name of the layout as defined in the report definition. If an invalid name is entered, the default layout is used. |
_xt=Manager+Summary |
|
_xf |
Specifies the output format. If no value is specified, the default output format is used. If an invalid value is specified, or, if a value is specified that is not enabled for the layout, the report does not render. Valid values are:
|
_xf=pdf |
|
report parameters as named in the data model |
Specify name-value pairs for the parameters specific to the report. You must use the parameter name as defined in the data model. |
dept=10 |
|
_xmode |
Specifies the report viewer mode. If not specified, defaults to view in the full report viewer. Valid values are:
|
_xmode=1 |
Example:
http://example.com:7001/xmlpserver/Samples/Salary+Report.xdo?_xpt=0&_xdo=%2FSamples%2FSalary%20Report.xdo&_xmode=4&dept=10&_xt=Simple&_xf=html
This URL runs the report "Salary Report" located under Shared Folders/Samples. Note the following:
_xpt=0 renders the document in the report viewer
_xdo=%2FSamples%2FSalary%20Report.xdo defines the report path
_xmode=4 renders the document only
dept=10 sets the report-specific parameter "dept" to "10"
_xt=Simple uses the layout called "Simple"
_xf=html sets the output format to html
