4 Monitoring the SOA Infrastructure
This chapter describes how to monitor the Oracle SOA Suite routing topology, SOA Infrastructure performance summary metrics, recent instances and faults, deployed SOA composite applications, message delivery processing requests, and service and reference binding components in the SOA Infrastructure. All SOA composite applications are deployed to the SOA Infrastructure. It also describes how to display details about BPEL process messages that require recovery and how to access the Recovery page of the BPEL process service engine to perform message recovery.
This chapter includes the following sections:
-
Section 4.1, "Discovering the Oracle SOA Suite Routing Topology"
-
Section 4.2, "Monitoring SOA Infrastructure Performance Summary Metrics"
-
Section 4.3, "Monitoring SOA Infrastructure Recent Instances and Faults and Deployed Composites"
-
Section 4.4, "Monitoring Message Delivery Processing Requests"
-
Section 4.5, "Monitoring Service and Reference Binding Components in the SOA Infrastructure"
For more information, see Section 1.2.1, "Introduction to the SOA Infrastructure Application."
4.1 Discovering the Oracle SOA Suite Routing Topology
The Topology Viewer is useful for when you are tasked to administer an existing Oracle SOA Suite environment. The Topology Viewer quickly provides you with a graphical representation of the deployed resources (servers, databases and data sources, SOA composite applications, and so on) and their relationships.
The Topology Viewer shows the routing relationships across components and elements. The Topology Viewer enables you to discover your Oracle Enterprise Manager Fusion Middleware Control environment and identify how requests are routed across components.
For example, you can use the Topology Viewer to understand the following:
-
Which databases your SOA servers rely on
-
Which data sources are used to connect to these databases
-
Which entities such as SOA servers are up and down
-
Performance metrics for components, such as the request processing time for the administration server.
-
Above the navigator, click Topology.
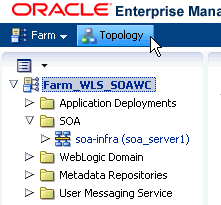
Description of the illustration sca_topology12.gif
The Topology Viewer opens in a separate window. The Topology Viewer shows the routing relationships between Oracle Fusion Middleware components (servers, clusters, and databases).
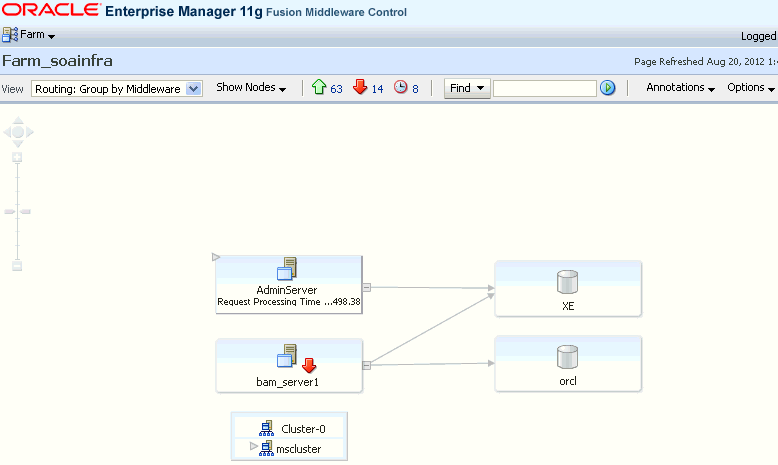
Description of the illustration sca_topology1.gif
-
Expand the handles on the left sides of the AdminServer and Cluster icons to display additional details.
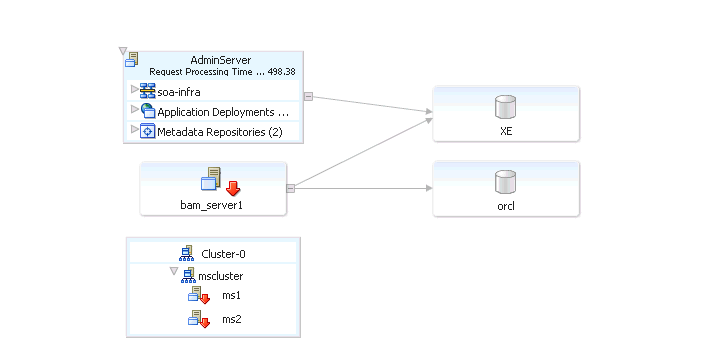
Description of the illustration sca_topology2.gif
You can further expand the soa-infra, Application Deployments, and Metadata Repositories icons to display additional details. For example, if you expand soa-infra, you can view the partitions and the SOA composite applications deployed to those partitions in the SOA Infrastructure.
-
From the Show Nodes list, select Data Sources to display the defined data sources.
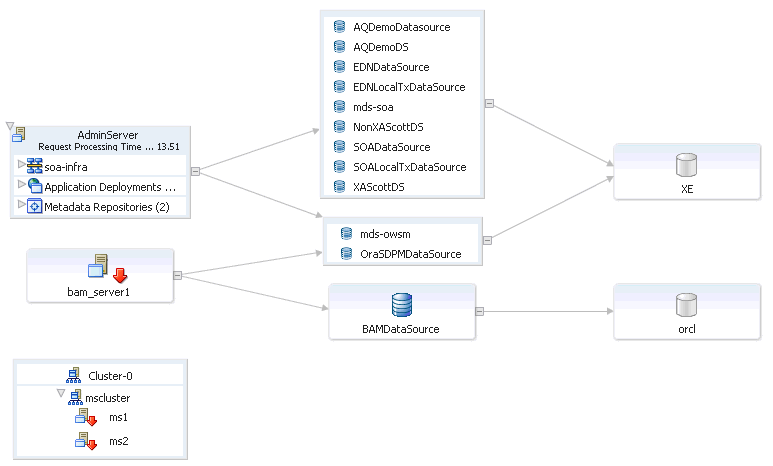
Description of the illustration sca_topology3.gif
-
From the View list, select Routing: Group by Application. This displays the routing relationships between the applications. The configured Oracle Metadata Services (MDS) repositories are also displayed.
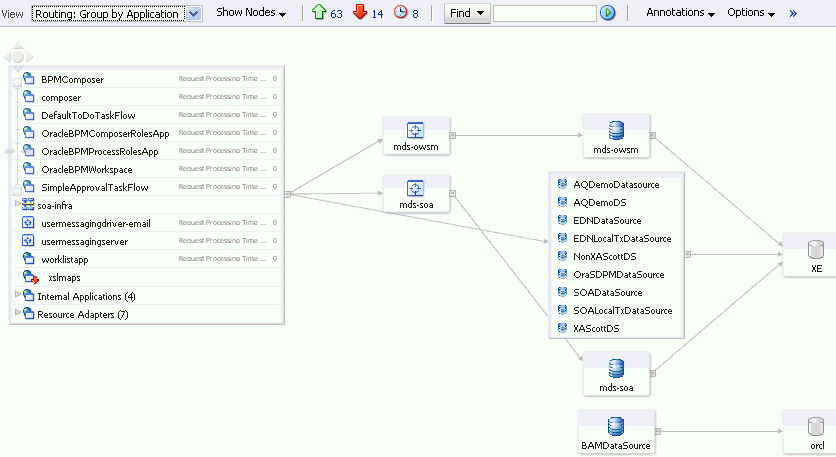
Description of the illustration sca_topology4.gif
-
Click the Up arrow to display targets whose status is running, the Down arrow to display targets whose status is down, or the Clock icon to display targets whose status is unknown.
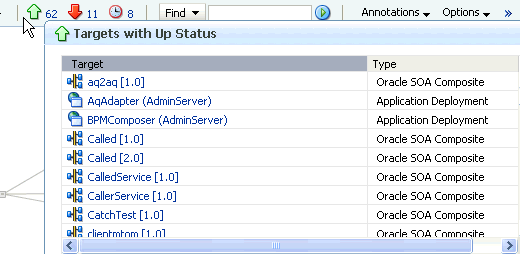
Description of the illustration sca_topology5.gif
-
From the Find list, select the target status (up, down, or unknown) or target type for which to search, and click the Search icon. You can also manually enter the name of entities for which to search, such as a SOA composite application name.
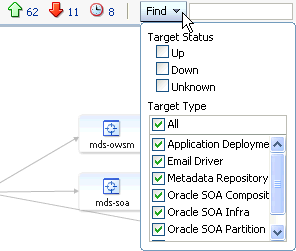
Description of the illustration sca_topology6.gif
-
From the Annotations list, click Status or Metrics to display applicable details. For example:
-
If you select Metrics, key performance metrics for the component are displayed, such as the request processing time for the AdminServer.
-
If you select Status, details about the state of various entities are displayed, such as which servers are down.
-
-
Right-click a component (such as an application) to invoke a menu for performing operations. For example, you can select Performance Summary to display performance details about the selected component or select Home to access the Dashboard page of the application.
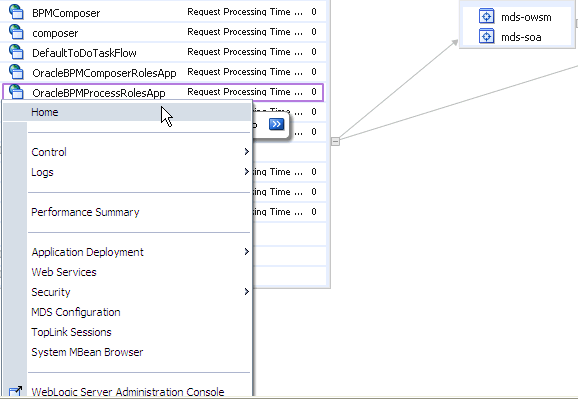
Description of the illustration sca_topology7.gif
-
Click a line between components to view the JDBC routing relationship, such as the host, port, and database being used.
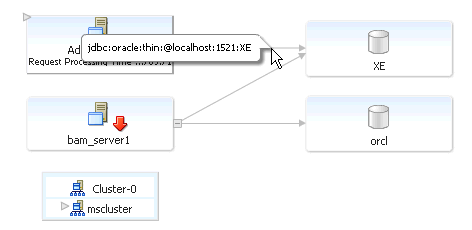
Description of the illustration sca_topology8.gif
-
Place the cursor over the edge of one of the entities (for example, the AdminServer) to invoke a small icon.
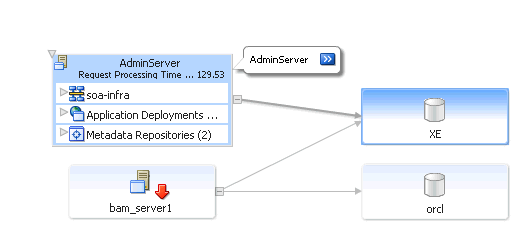
Description of the illustration sca_topology11.gif
-
Expand the icon to display details about server status, host name, CPU usage, request processing time, heap usage, active sessions, and message requests per minute.
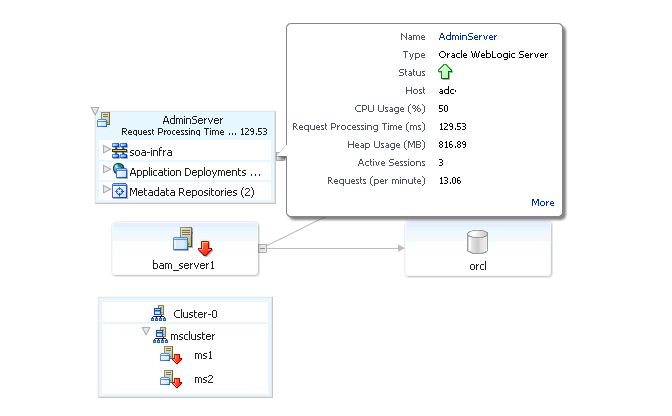
Description of the illustration sca_topology10.gif
-
From the Refresh list, select to manually or automatically refresh the status and metrics. By default, the Topology Viewer refreshes metrics every five minutes.
For more information about the Topology Viewer, see Section "Viewing the Routing Topology" of Oracle Fusion Middleware Administrator's Guide.
4.2 Monitoring SOA Infrastructure Performance Summary Metrics
You can view a summary of SOA Infrastructure performance metrics on the Performance Summary page.
-
Access this page through one of the following options:
From the SOA Infrastructure Menu... From the SOA Folder in the Navigator... - Select Monitoring > Performance Summary
- Right-click soa-infra.
-
Select Monitoring > Performance Summary.
The Performance Summary page provides a graphical representation of the following information by default:
-
Total number of messages in the SOA Infrastructure since the last server restart.
-
Total number of service component messages (BPEL process, Oracle Mediator, human workflow, and business rule (decision service)) since the last server restart.
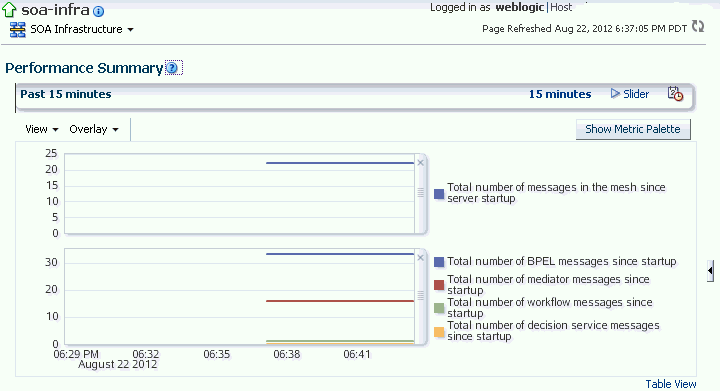
Description of the illustration sca_perfsum1.gif
-
Click Show Metric Palette to display a hierarchical tree of all metrics for the SOA Infrastructure. The tree organizes the metrics into various categories of performance data.
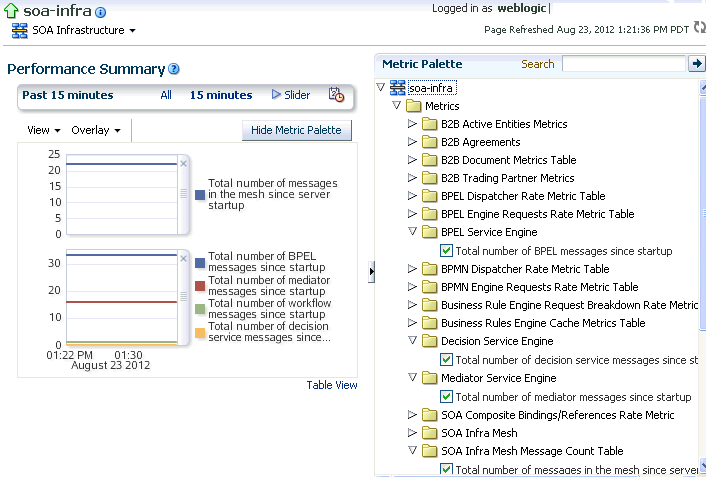
Description of the illustration sca_perfsum3.gif
-
Expand a folder and select a metric in the Metric Palette to display a performance chart that shows the changes in the metric value over time. The chart refreshes automatically to show updated data.
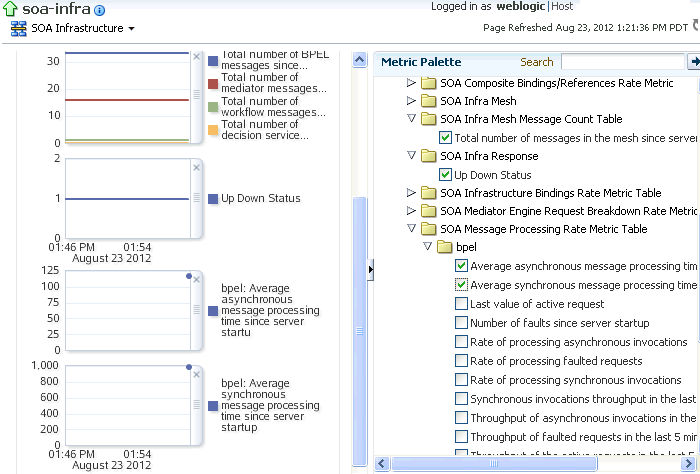
Description of the illustration sca_perfsum8.gif
-
Click Slider to display a slider tool that lets you specify the time frame for the data shown in the charts.
For more information about the Performance Summary page, see the online Help for the Performance Summary page and Section "Viewing the Performance of Oracle Fusion Middleware" of Oracle Fusion Middleware Administrator's Guide.
For information about monitoring message delivery processing requests, see Section 4.4, "Monitoring Message Delivery Processing Requests."
For information about monitoring SOA composite application summary metrics, see Section 6.1, "Monitoring SOA Composite Application Performance Summary Metrics."
For information about monitoring service engine statistics, see the following:
4.3 Monitoring SOA Infrastructure Recent Instances and Faults and Deployed Composites
You can monitor the SOA composite applications deployed to the SOA Infrastructure.
To monitor SOA Infrastructure recent instances and faults:
-
Access this page through one of the following options:
From the SOA Infrastructure Menu... From the SOA Folder in the Navigator... From the SOA Composite Menu... - Select Home.
- Select soa-infra.
- Select SOA Infrastructure.
The upper part of the SOA Infrastructure Dashboard page displays the following details:
-
A message indicating that the retrieval of recent instances and faults that are displayed on this page is restricted to the specified time period. This message is displayed if the Restrict display of instances and faults to the last time_period checkbox is selected on the SOA Infrastructure Common Properties page (it is selected by default). The default time period value is 24 hours, but you can change this value. If this checkbox is not selected, all instances and faults (including count metrics) in the SOA Infrastructure since the last purging are displayed.
-
Recent SOA composite application instances, instance IDs, and starting times. By default, only running instances are shown.
-
The status of deployed SOA composite applications and their revision numbers, the number of instances created for each application, and the number of faulted instances in each application. The total number of deployed composites also is displayed in parentheses next to the Show More link.
-
Recent faults and rejected messages, including the error message, whether you can recover from the fault, the time at which the fault occurred, the SOA composite application in which the fault occurred, the location of the fault (service binding component, service component, or reference binding component), the instance ID of the SOA composite application, and a link to log messages describing the fault or rejected message. You can recover from faults identified as recoverable at the SOA Infrastructure, SOA composite application, service engine, and service component levels.
If messages are awaiting recovery from the Recovery page of the BPEL process service engine, a message is displayed at the top of each SOA Infrastructure home page.
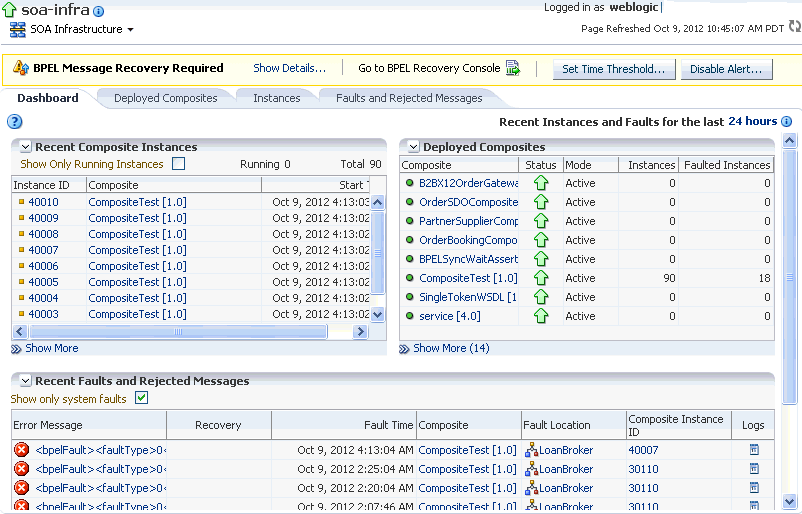
Description of the illustration gs_soahomepage.gif
Note:
After the SOA Infrastructure is started, it may not be completely initialized to administer incoming requests until all deployed composites are loaded. During SOA Infrastructure initialization, a warning message is displayed at the top of the SOA Infrastructure home page. Do not perform operations such as composite deployment, composite undeployment, and others while this message is displayed. For more information, see Section 3.2.1, "Waiting for SOA Infrastructure Startup Initialization to Complete." -
If BPEL process messages require recovery from the Recovery page of the BPEL process service engine, the BPEL Message Recovery Required message is displayed at the top of each SOA Infrastructure home page.

Description of the illustration bp_bpel_message_recov.gif
The display of this message recovery information is controlled by the bpelRecoveryStatus, excludeBpelMaxCreationTime, and bpelRecoveryAlertDurationInDays keys of the AuditConfig property in the System MBean Browser. This property is accessible from the More SOA Infra Advanced Configuration Properties section of the SOA Infrastructure Common Properties page. By default, these keys have the following values:
-
bpelRecoveryStatus is set to All.
-
excludeBpelMaxCreationTime is set to exclude the display of messages requiring recovery in the last five minutes.
-
bpelRecoveryAlertDurationInDays is set to only show the BPEL Message Recovery Required warning message when recoverable BPEL messages have been created in the last seven days.
-
Perform the following tasks:
Click This Link... To... Show Details View a message showing the number of invoke, callback, and activity messages that require recovery from the Recovery page of the BPEL process service engine. Manual recovery is not required if automatic recovery of BPEL messages is enabled. In that case, only exhausted messages must be manually recovered. Click Refresh to recalculate the number of invoke, callback, and activity messages requiring recovery. Go to BPEL Recovery Console Access the Recovery page of the BPEL process service engine to perform message recovery. You can also access the Recovery page later by selecting Service Engines > BPEL from the SOA Infrastructure menu and clicking the Recovery tab in the resulting page.
Set Time Threshold View a message showing the time period for excluding messages that require recovery. By default, this setting excludes the last five minutes of messages. This value is controlled by the excludeBpelMaxCreationTime key of the AuditConfig property on the SOA Infrastructure Common Properties page. To change this value, click Yes to access this property in the System MBean Browser. Disable Alert View a message enabling you to prevent the display of this message recovery information on the Dashboard page. If you click Yes, this message recovery information is not displayed. To display this information again on the Dashboard page, set the bpelRecoveryStatus key to All for the AuditConfig property in the More SOA Infra Advanced Configuration Properties section of the SOA Infrastructure Common Properties page. For more information, see Section 3.1, "Configuring SOA Infrastructure Properties."
-
-
In the Recent Composite Instances section, perform the following tasks:
-
Click the Number of Instances link to display a message showing the numbers of running and total instances in the SOA Infrastructure. The link is not displayed by default. To enable this link to be displayed, select the Disable fetching of instance and fault count metrics. Each metric can still be retrieved on demand checkbox in the SOA Infrastructure Common Properties page.
If you selected the Restrict display of instances and faults to the last time_period checkbox on the SOA Infrastructure Common Properties page and specified a time period or accepted the default value of 24 hours, the numbers of running and total instances in the SOA Infrastructure for that time period are displayed. If you did not select this checkbox, all instances and faults in the SOA Infrastructure since the last purging are displayed. Click Recalculate to recalculate the numbers.
-
In the Instance ID column, click a specific instance ID to show the message flow through the various service components and binding components.
-
In the Composite column, click a specific SOA composite application to access its home page.
-
Click Show More below the section to access the Instances page of the SOA Infrastructure.
-
-
In the Deployed Composites section, perform the following tasks:
-
In the Composite column, click a specific SOA composite application to access its home page.
-
Click Show More below the section to access the Deployed Composites page of the SOA Infrastructure.
-
-
In the Recent Faults and Rejected Messages section, perform the following tasks:
-
In the Error Message column, click an error message to display complete information about the fault. If the fault is identified as recoverable, click the Recover Now link to perform fault recovery.
-
In the Recovery column, if a fault is identified as recoverable, click Recover to perform fault recovery.
-
In the Composite column, click a SOA composite application to access its home page.
-
In the Fault Location column, click a specific location to access the home page of the service, component, or reference in which the fault occurred.
-
In the Composite Instance ID column, click a composite instance ID to access the flow trace of the message that contains that fault.
-
In the Logs column, click a specific log to access the Log Messages page, with the search criteria prefiltered to display any log messages related to the fault.
-
Click Show More below the section to access the Recent Faults and Rejected Messages page of the SOA Infrastructure.
The lower part of the SOA Infrastructure Dashboard page displays the following details:
-
The number of service components running in the service engines (BPEL process, BPMN process (if Oracle BPM Suite is installed), Oracle Mediator, human workflow, business rules, and spring) and the number of faulted instances for each service engine.

Description of the illustration gs_soahomepage3.gif
-
A graphical representation of the total number of instances and faults for all SOA composite applications since the SOA Infrastructure was last restarted.
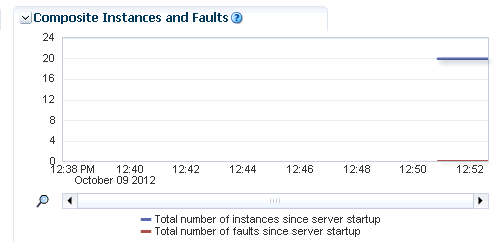
Description of the illustration gs_soahomepage2.gif
-
-
In the Name column of the Service Engines section, click a specific service engine to access its home page. If you click Spring Engine, a message is displayed indicating that it cannot be managed.
For more information, see the following sections:
-
Section 1.2.4, "Introduction to Service Components and Service Component Instances"
-
Section 8.1, "Initiating a SOA Composite Application Test Instance"
-
Section 15.4, "Performing BPEL Process Service Engine Message Recovery"
-
Oracle Fusion Middleware Administrator's Guide for details about viewing and searching log files
4.4 Monitoring Message Delivery Processing Requests
You can monitor SOA Infrastructure message delivery processing requests. These are metrics for the message delivery between the service engines, service infrastructure, and binding components. Once a message is handed over to a service engine, the amount of time it takes to process that message (instance processing time) is not captured in these metrics.
To monitor message delivery processing requests:
-
Access this page through one of the following options:
From the SOA Infrastructure Menu... From the SOA Folder in the Navigator... - Select Monitoring > Request Processing.
- Right-click soa-infra.
-
Select Monitoring > Request Processing.
The Request Processing page enables you to monitor the following details:
-
The average request processing time for both synchronous and asynchronous messages, active requests, requests processed, and faulted requests in the service engines and service infrastructure.
-
The average request processing time, requests processed, and errors occurring in service (inbound) and reference (outbound) binding components.
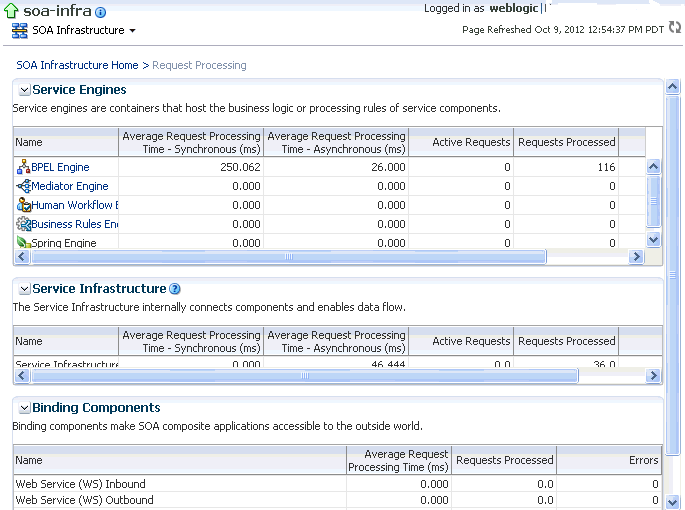
Description of the illustration soainfra_requestproc.gif
-
In the Service Engines section, click a specific service engine (for example, BPEL Engine) to access details such as recent instances using this service engine, components using this service engine, and recent fault occurrences.
For more information, see the following sections:
4.5 Monitoring Service and Reference Binding Components in the SOA Infrastructure
You can monitor all service and reference binding components used in all SOA composite applications deployed to the SOA Infrastructure. Services provide the outside world with an entry point to the SOA composite application. The WSDL file of the service advertises its capabilities to external applications. References enable messages to be sent from the SOA composite application to external services in the outside world.
To monitor service and reference binding components in the SOA Infrastructure:
-
Access this page through one of the following options:
From the SOA Infrastructure Menu... From the SOA Folder in the Navigator... - Select Services and References.
- Right-click soa-infra.
-
Select Services and References.
The Services page displays details about the names and types of the services, the SOA composite applications in which the services are used, the partitions in which the SOA composite applications are deployed, the total number of messages processed, the average processing time, and the number of faults occurring in the services.
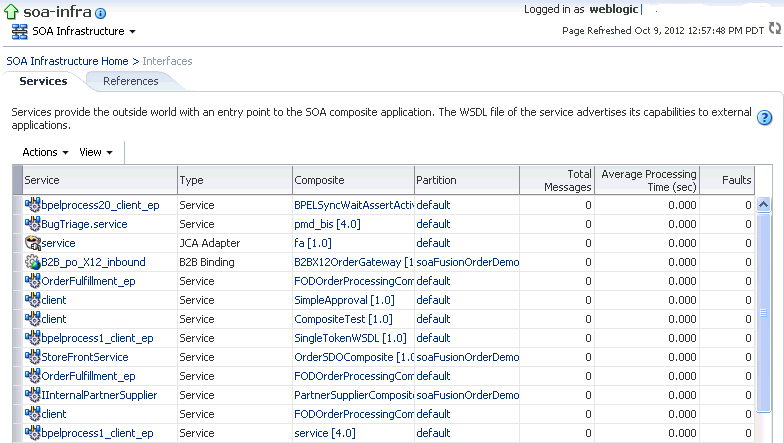
Description of the illustration sca_services.gif
-
In the Service column, click a specific service to access its home page.
-
In the Composite column, click a specific SOA composite application to access its home page.
-
In the Partitions column, click a specific partition to access its home page.
-
Click the References tab.
The References page displays details about the names and types of the references, the SOA composite applications in which the references are used, the partitions in which the SOA composite applications are deployed, the total number of messages processed, the average processing time, and the number of faults occurring in the references.
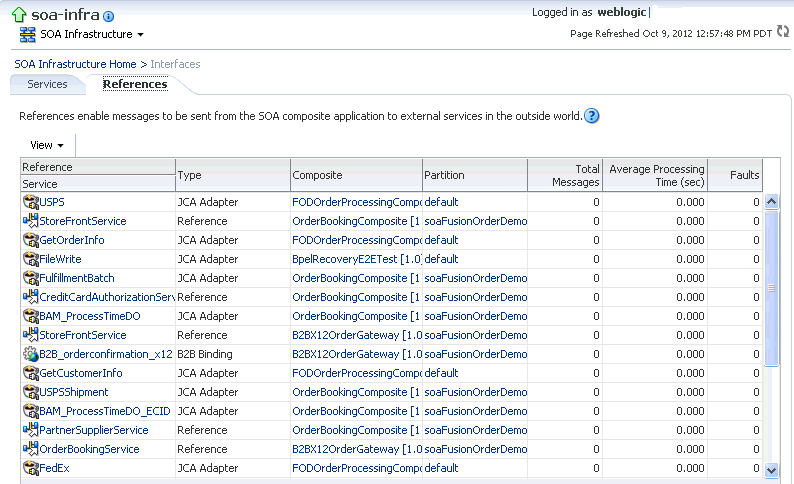
Description of the illustration sca_references.gif
-
In the Reference column, click a specific reference to access its home page.
-
In the Composite column, click a specific SOA composite application to access its home page.
-
In the Partitions column, click a specific partition to access its home page.
For more information about services and references, Section 1.2.5, "Introduction to Binding Components."
4.6 Using SOA Health Check
The SOA Health Check framework provides a number of health checks and health check categories to monitor the health of your system. Checks include memory checks, data source checks, SOA-related service checks, SOA application-targeting checks, BPEL-related checks, and so on.
Startup checks execute automatically at server startup, and periodic checks can be scheduled to run at periodic intervals. You can also execute individual health checks or health check categories using WLST.
This section includes the following topics:
4.6.1 SOA Health Checks
Table 4-1summarizes the SOA health checks that are available in this release.
| Health Check Name | Description |
|---|---|
|
BPELAsyncRequestCheck |
Checks if the BPEL asynchronous request count is within the configured threshold of 1000. |
|
BPELComponentInstanceCheck |
Checks if the number of open BPEL component instances are within the threshold of 1000. Also checks if the number of faulted BPEL component instances are within the threshold of 500. |
|
DatasourceCheck |
Checks if the data sources are appropriately targeted for use by the soa-infra application. For each data source, the check verifies if the targets of the data source cover all targets of the soa-infra application. If any of the soa-infra application targets is missing from any of the data source targets, an error is raised. |
|
DBStatsCheck |
Checks if the MDS database statistics are current. |
|
EDNMessageCheck |
Checks if the pending messages count in the EDN event queue and OAOO queue are within thresholds. The threshold limit used for the EDN event queue is 2000 and the threshold limit used for the OAOO queue is 5000. |
|
JDBCPoolsCheck |
Checks if the SOA, EDN, and MDS data sources are healthy at runtime. |
|
SOAAppCheck |
Verifies targeting of SOA applications. SOA applications should at least target all of the soa-infra application targets. |
|
SOALibraryCheck |
Verifies the targeting of SOA, and related, libraries. SOA libraries should at least target all of the soa-infra application targets. |
|
ServiceCheck |
Verify if SOA-related services are functional. Currently, this check verifies if the OWSM Policy Manager service is functional. |
|
MemoryCheck |
Checks if the available (free) heap memory is above the configured threshold of 25%. |
A health check ends with one of the following states:
-
Success: The check completed, and passed.
-
Error: The check completed, but did not pass.
-
Warning: The check completed and passed, but something may need user attention.
-
Failure: The check could not be completed/executed.
-
Skipped: The check is not applicable for the environment.
-
Disabled: The check is disabled and cannot be run.
4.6.2 Health Check Categories
The SOA health check framework logically groups health checks into health check categories. A health check can be part of more than one category.
When you execute a health check category, using the WLST command for example, all health checks in the category automatically get executed. Certain health check categories are automatically executed. For example, the Startup category, if enabled, runs all the startup health checks at server startup.
Table 4-2 summarizes the SOA health check categories and their constituent health checks.
Table 4-2 SOA Health Check Categories
| Health Check Category | Description | Default health checks included in the Category |
|---|---|---|
|
Startup |
Runs at server startup |
DatasourceCheck, JDBCPoolsCheck, SOAAppCheck, SOALibraryCheck, ServiceCheck, MemoryCheck |
|
Quick |
Lightweight set of checks |
JDBCPoolsCheck, ServiceCheck, MemoryCheck |
|
Intermediate |
Intermediate set of checks |
BPELAsyncRequestCheck, BPELComponentInstanceCheck, DBStatsCheck, EDNMessageCheck |
|
Extensive |
Extensive set of checks |
For future use |
|
Config |
Configuration checks |
DatasourceCheck, SOAAppCheck, SOALibraryCheck |
4.6.3 Invoking SOA Health Checks
The SOA health checks can be invoked in a number of ways, as described in the following sections:
4.6.3.1 Server Startup
When a production SOA server starts, health checks in the Startup category are automatically run. The startup health check is enabled by default. The result of the startup run is logged in the SOA server logs.
You can choose to disable the startup run using WLST commands. You can also change the category of tests run at startup using the appropriate WLST command. See "enableHCStartupRun" and "setHCStartupRunCategory" in Oracle Fusion Middleware WebLogic Scripting Tool Command Reference.
4.6.3.2 Periodic Invocation
SOA health check is pre-configured with periodic runs that automatically run on the production SOA server. Table 4-3 lists the pre-configured periodic runs.
Table 4-3 Pre-Configured Periodic Runs
| Periodic Run Name | Category | Scheduling | Enabled by Default? |
|---|---|---|---|
|
Frequently |
Quick |
Every two hours at :07 |
Yes |
|
Daily |
Intermediate |
Every day at 05:15 |
Yes |
|
Weekly |
Extensive |
Every Sunday at 03:30 |
No (for future use) |
Periodic runs are enabled by default. The result of the periodic runs are logged in the SOA server logs.
You can disable periodic runs, or change the health-check category associated with a periodic run. You can also change the scheduling, or add new periodic runs. See "createHCPeriodicRun", "enableHCPeriodicRun", "setHCPeriodicRunInterval", "setHCPeriodicRunSchedule", and "setHCPeriodicRunCategory" in Oracle Fusion Middleware WebLogic Scripting Tool Command Reference.
4.6.3.3 WLST Invocation
You can use WLST commands to:
-
List health checks
-
Configure health checks
-
List health check categories
-
Execute a health check by name
-
Execute a category of health checks
-
Get results (Returned as an HTML report at the specified location)
-
Purge results
See "SOA Health Check Commands" in Oracle Fusion Middleware WebLogic Scripting Tool Command Reference for details on all health check commands.
The WLST commands need to be executed in the online mode. You must be connected to the SOA server.