5 Developing Applications Using Modeling
This chapter describes how to use the modeling tools and technologies to create Unified Modeling Language (UML) class, profile, activity, sequence, and use case diagrams, as well as database, EJB, and business component diagrams to model your various business services and database structures.
This chapter includes the following sections:
5.1 About Modeling with Diagrams
JDeveloper supports six standard UML diagrams types, and four additional diagram types to model the software and systems development for your applications.
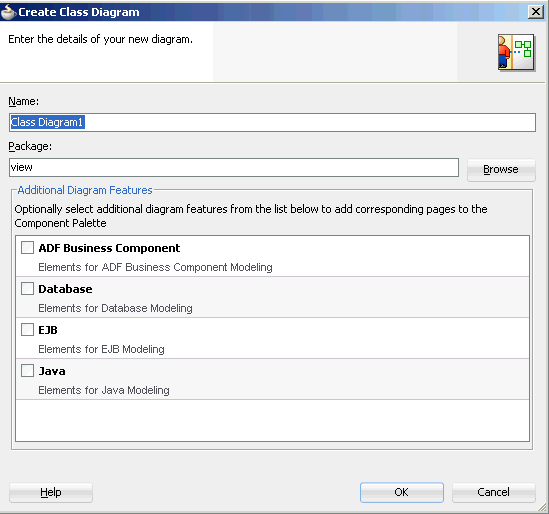
To create your diagrams there are New Gallery wizards. The wizard lets you choose the diagram type, the package, and select the components you want available in the Component window. You can also create a UML application, which allows you to quickly create diagrams and related components. Figure Figure 5-28 shows an example create dialog for a class diagram.
5.2 Getting to Know the Diagram Types
The UML diagrams available are UML-compliant. Once your diagram is created, you will find many UML elements available to drop and drag onto your diagrams from the Components window.
All of the diagram types can be created using the New Gallery wizards and are supported with JDeveloper diagram editor, Components window, and the Properties window. There are also transformation options for database objects.
5.2.1 UML Diagrams
JDeveloper offers six standard UML diagram types:
-
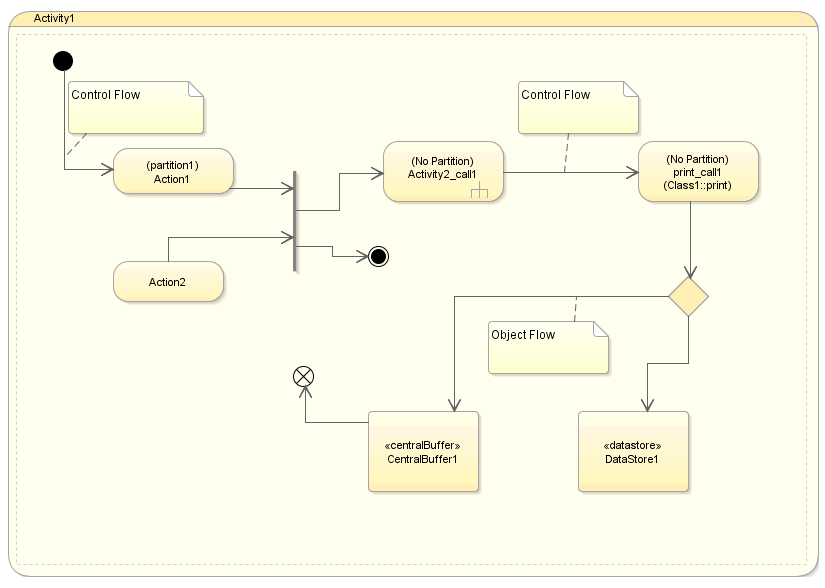
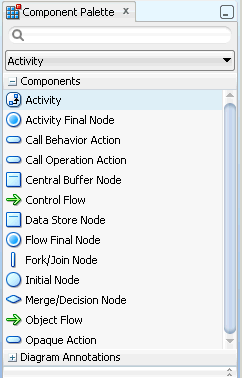
Activity Diagram. Model system behavior as coordinated actions. You can use activity objects to model business processes, such as tasks for business goals, like shipping, or order processing.
-
Activity Diagram with Partitions. Create visual dividing lines, or modeling constructs to groups, or dividing activities and actions that share similar characteristics.
-
Class Diagram. Model the structure of your system. Use to inspect the architecture of existing classes, interfaces, attributes, operations, associations, generalizations and interface realizations.
-
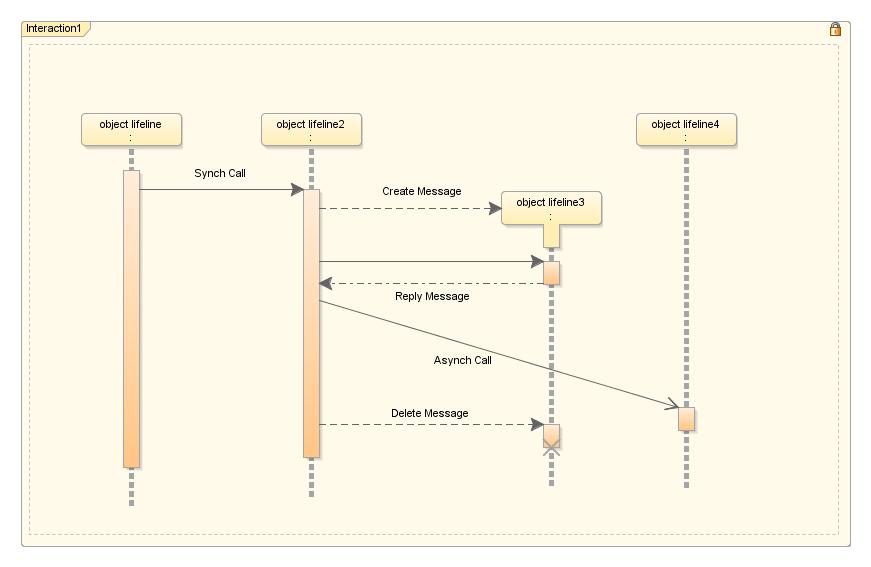
Sequence Diagram. Model the traces of system behavior as a sequence of events. Sequence diagrams primarily show this as messages between objects ordered chronologically.
-
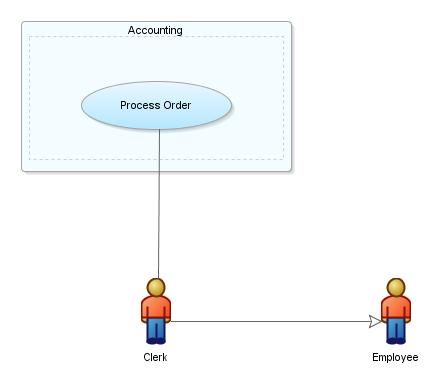
Use Case Diagram. Model what a system is supposed to do. A use case diagram is a collection of actors, use cases, and their communications.
-
Profile Diagram. Define extensions to UML using profiles and stereotypes.
5.2.2 Business Services and Supporting Database Structure Diagrams
There are four diagrams to choose from to model your business services:
-
Business Components Diagram. Model entity objects, view objects, application modules and the relationships between them.
-
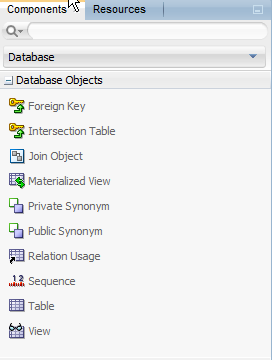
Database Diagram. Model your online and offline database tables and their relationships as well as views, materialized views, sequences, public and private synonyms.
-
EJB Diagram. Model the entity beans, session and message-driven beans inside a system, and the relationships between them.
-
Java Class Diagram. Model the relationships and the dependencies between Java classes, interfaces, enums, fields, methods, references, inheritance relationships, and implementation relationships.
5.3 Creating, Using, and Managing Diagrams
Oracle JDeveloper provides you with a wide range of tools and diagram choices to model your application systems. There are handy wizards to walk you through creating your diagrams and elements, as well as a Components window and Properties window to make it easy to drag and drop, and to edit a variety of elements without leaving your editing window.
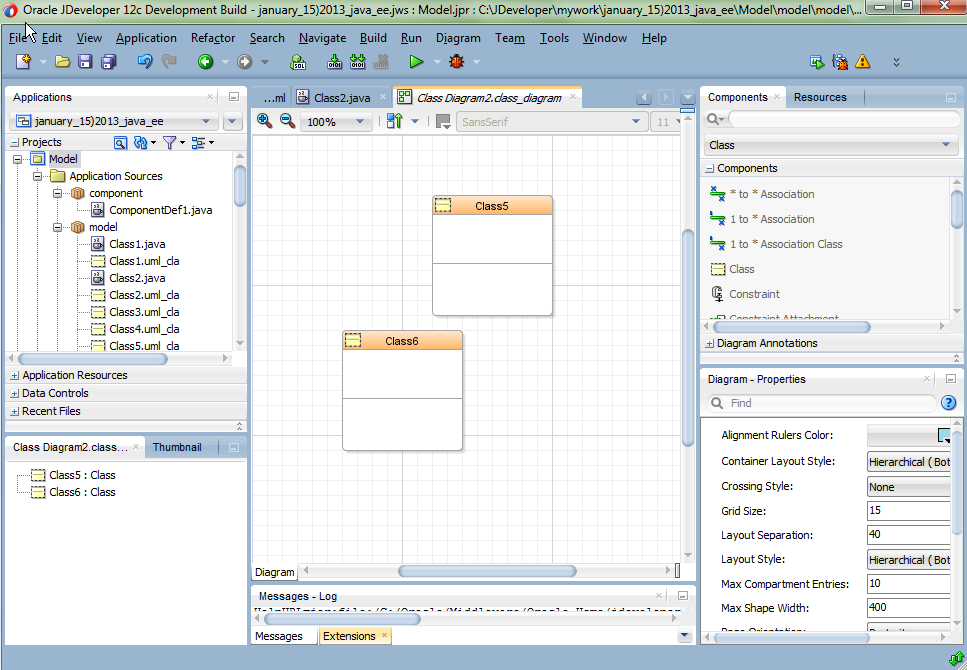
Figure 5-1 shows the diagram editor window, with a class diagram, as well as the Applications window and Components window. Open diagrams by double-clicking them in the Applications window, and once open, drag-and-drop components onto the diagram editor from the Components window.
5.3.1 Using the Basic Diagramming Commands
Once you have created your diagram, add components to your diagram from the Components window. Zoom in and out of your diagrams with keystroke commands or view them at original size, or a percentage of the original size. When you are finished, you can publish your diagram as an image or print it using the right-click context menu or the main menu commands.
5.3.1.1 How to Create a New Diagram
The New Gallery wizard creates your diagrams ready for you to start adding your components.
-
In the Applications window, select your project, then choose File > New From Gallery > General > Diagrams.
-
Select a diagram type, click OK.
-
The default package for a diagram is the default package specified in the project settings. An empty diagram is created in the specified package in the current project, and opened in the content area. Click OK.
5.3.1.2 How to Rename a Diagram
Renaming your diagram renames that diagram without leaving a copy of the original diagram in the original name.
-
In the Applications window, select the diagram to rename.
-
Choose File > Rename.
5.3.1.3 How to Publish a Diagram as an Image
Use the right-click context option to publish your diagram as a graphic image. You can preview and print your diagram once it is published as an image.
To publish a diagram as a image:
-
Right-click your diagram, then choose Publish Diagram.
Or
Click on the surface of the diagram, then choose Diagram > Publish Diagram.
-
Select the destination folder from the table for the image file.
-
From the File type drop-down list, select the file type for the image file (SVG, SVGZ, JPEG, or PNG).
-
In the File name box, enter a name for the image file, including the appropriate file extension (.svg, .svgz, .jpg, or .png).
-
Click Save.
5.3.1.4 How to Copy Elements to Another Diagram
Use the context menu or keystrokes to copy elements across different diagrams.
To copy elements from a diagram and paste them into another diagram:
-
Select the diagram elements, then choose Copy on the context menu, or choose the Copy icon on the toolbar, or press Ctrl-C.
-
Open the destination diagram.
-
Place the pointer where you want the diagram elements to be added, then choose Paste from the context menu (or choose the Paste icon on the toolbar, or press Ctrl-V.
5.3.1.5 How to Setup a Page for Printing
Change from portrait to landscape or your margins for printing using page setup.
To setup the page before printing:
-
Click on the surface of the diagram you want to print, then choose File > Page Setup.
-
Make changes to the settings on the tabs of the Page Setup dialog.
5.3.1.6 How to Set the Area of a Diagram to Print
Set a specific area of your diagram to print using set print area off the File menu option.
To set the area of the diagram to print:
-
Choose File > Print Area > Set Print Area.
-
On the diagram, drag the mouse pointer to enclose the objects on the diagram to print. The area to print is shown with a dashed outline. If you do not set an area, then the whole diagram is printed.
5.3.1.7 How to Clear a Diagram Print Area
To clear a diagram print area choose File > Print Area > Clear Print Area.
5.3.1.8 How to See a Preview of Your Page Before Printing
To see a preview of your page go to File > Print Preview. You can also set print options from this page by choosing Print Options. On the Print Option page you can add header and footer content as well as text formatting.
5.3.1.9 How to Zoom in and Out of a Diagram
Use Ctrl+scroll to zoom in and out of diagrams. When you are using the thumbnail view, use scroll to zoom. There are also zoom options on the diagram toolbar.
5.3.1.10 How to Display a Diagram in its Original Size
In the zoom drop-down list, located on the diagram toolbar, choose 100%, or click the diagram, then choose Diagram > Zoom > 100%.
5.3.1.11 How to Display an Entire Diagram
In the zoom drop-down list, located on diagram toolbar, choose Fit to Window, or click the diagram, then choose Diagram > Zoom > Fit to Window.
5.3.1.12 How to Display the Selected Elements at the Maximum Size
In the zoom drop-down list, located on the diagram toolbar, choose Zoom to Selected, or click the diagram, then choose Diagram > Zoom > Zoom to Selected.
5.3.1.13 How to Delete a Diagram
Delete the diagram and related diagram elements using the menu bar.
-
In the Applications window, select the diagram to remove.
-
Choose Edit > Delete. These commands remove the diagram file from the system and close the editing window for that diagram. The elements for the deleted diagram remain in the applications window and on the file system.
You can also delete a diagram from the Applications window. In the Applications window, right-click on the diagram name and choose Delete.
5.3.2 Working with Diagram Elements
Most of your diagram elements are available in the Components window. There are a variety of tools to help you manage your elements visually, as well as managing the properties of your elements.
5.3.2.1 How to Locate an Element on a Diagram
Click on the element name in the Structure window. The element is selected in the diagram. You can also use the thumbnail window of the diagram to find an element. To display a thumbnail view of a diagram, select the diagram either in the applications window or by clicking on the background of the diagram, then choose Window > Thumbnail. You can grab the view area box and move it over elements on the thumbnail view of the diagram. The corresponding elements are brought into view on the main diagram.
5.3.2.2 How to Select Specific Elements on a Diagram
Press and hold down the Ctrl key, then click the element on the diagram.
5.3.2.3 How to Select All Elements on a Diagram
Select all elements on a diagram to perform actions on all elements at the same time, such as align, copy, delete, or move. Click on the diagram surface, and then select any element, and choose Edit > Select All. You can also drag out an area on the diagram surface to select all or multiple elements.
5.3.2.4 How to Select All Elements of the Same Type
If you want to edit or manage many elements of the same type, at the same time, use the select all option.
To select all elements of the same type:
-
Select an object of the type you want.
-
From the context menu, choose Select All This Type.
5.3.2.5 How to Deselect an Element in a Group of Selected Elements
If you select a group of elements, and you want to exclude particular elements, use the deselect option. This might be quicker than selecting the entire group one element at a time.
To deselect a selected element in a group of selected elements:
-
Press and hold down the Ctrl key.
-
Click the element(s) on the diagram to deselect.
5.3.2.6 How To Group Elements
Grouping elements locks two or more elements into a single group that serves as a container for the aggregate.
To group elements on a diagram:
-
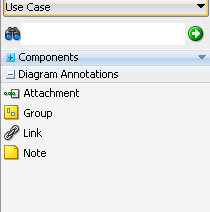
Expand the diagram annotations accordion, if necessary. In the Components window, click Group.
-
Position the pointer at the corner of the area on the diagram to group the elements, then press and hold down the mouse button.
-
Drag the mouse pointer over the area.
-
Release the mouse button when the objects are entirely enclosed.
5.3.2.7 How to Manage Grouped Elements
Use the Manage Group feature to move elements in and out of groups, move elements to other groups, or move groups in and out of other groups.
To manage grouped elements on a diagram:
-
Select the group to manage.
-
Right-click and select Manage Group.
You can also move elements in and out of groups by Shift+dragging the element to the desired position.
5.3.2.8 How to Change Properties Diagram Elements Using the Properties Dialog
Open the Properties dialog in one of the following ways:
-
On the diagram, double-click the element
Or
-
Select the element on the diagram, then, from its context menu, choose Properties.
5.3.2.9 How to Change Element Properties Using the Properties window
-
Open the Properties window by selecting Window > Properties. The Properties window displays both visual and semantic properties.
-
Select the diagram element.
-
Select the property to change.
-
On the right of the Properties window, select the control and change the value. (The control may be an edit box, a drop-down list, a checkbox, etc.).
Note:
These properties are not all valid for all elements.
5.3.2.10 How to Change the Element Color or Font
-
Select the element or elements on the diagram.
-
Then in the Properties window (Window >Properties), on the Graphical Options tab, select the current color (or the box for font type), make the required change(s), then press Enter.
Or
On the tool bar, select the font type, font size, or color box, then make the required change.
Or
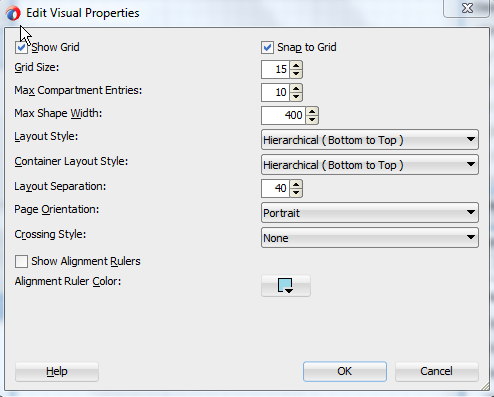
Choose Visual Properties from the context menu, then make the required change.
5.3.2.11 How to Change the Visual Properties of New Diagram Elements
Define the default font and color of any elements you add to your diagrams using the Preferences dialog.
To change the color or font of diagram elements to be added to a diagram:
-
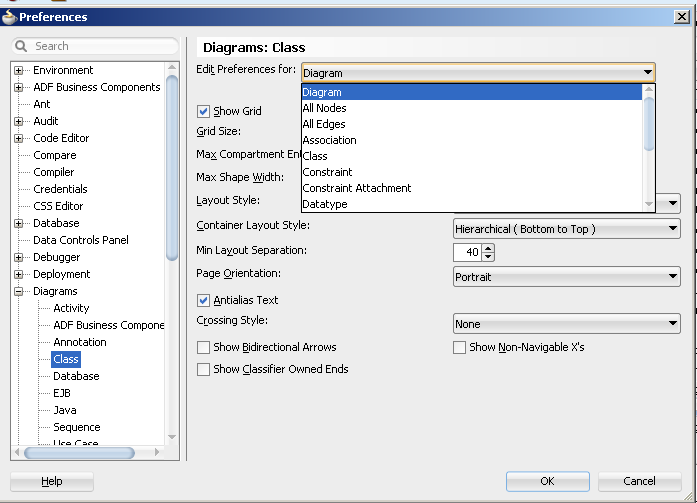
Choose Tools > Preferences, select Diagrams, select the diagram type, and then (from the Edit Preferences For drop-down box), select the element type to change, as shown in Figure 5-3.
-
On the make the required changes.
5.3.2.12 How to Copy and Paste Visual Properties From One Element to Another
Use the Preferences dialog to copy preferences between elements.
To copy and paste visual properties to elements:
-
Select the element with the properties you want to copy.
-
Right-click and select Visual Properties.
-
Right-click and select Paste Graphical Options.
5.3.2.13 How to Resize Elements on a Diagram
Resize an element by dragging the grab bars until the item is the size you want. Some diagram elements cannot be resized, such as initial and final nodes.
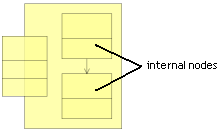
Certain element types also have internal grab bars, that are displayed when an element is selected. These internal grab bars are for resizing the compartments of those diagram elements.
Whenever a diagram element is resized towards the visible edge of the diagram, the diagram is automatically scrolled. New diagram pages are added where an element is resized off the diagram surface.
-
Select the element to resize.
-
Position the pointer on any grab bar on the element and hold down the mouse button. The pointer is displayed as a double-headed arrow when it is over a grab bar.
-
Drag the grab bar until the element is resized, then release the mouse button.
5.3.2.14 How to Move Diagram Elements
Dragging elements on the diagram surface is the easiest way of moving elements. To move elements over a larger areas, cut and paste. Whenever a diagram element moved towards the visible edge of the diagram, the diagram is automatically scrolled. New diagram pages are added where an element is moved off the diagram surface.
-
Select the element, or elements to move.
-
Position the pointer on the elements, then press and hold down the mouse button.
-
Drag the selected elements to their new position.
-
Release the mouse button. If an element overlaps another element they are displayed on top of one another. Right-clicking the element and choose Bring to Front to view.
5.3.2.15 How to Undo the Last Action on a Diagram
You can undo and redo your most recent graphical actions by choosing Edit >Undo [...] or clicking the undo icon. Graphical actions change the appearance of elements on the diagram surface and include the following:
-
Cutting and pasting elements on diagrams.
-
Altering the position and size of diagram elements.
-
Changing the font, color, and line width of diagram elements.
Any change to a diagram element that is not graphical, such as changing the properties of that element, cannot be undone. Changing the properties of an element also prevents any previous graphical changes from being undone.
To redo an action, choose Edit > Redo [...] or click the redo icon
5.3.3 Customizing the Look and Feel of Your Diagrams
Diagrams can be laid out in hierarchical, symmetrical, grid, and row styles. Elements within your diagrams can also have customized layout styles. There are many preferences available to customize the way you diagram looks. Most preferences can be set using the various diagram preferences dialogs at Tools > Preferences > Diagrams (diagram type), as shown in Figure 5-4. From the general preferences dialog you can choose Edit Preferences for to set specific preferences for new diagrams. The general preferences dialog sets preferences for all diagrams of that type Right-click and choose Visual Properties to edit preferences for the diagram currently in your editing window.
5.3.3.1 Using a Hierarchical Diagram Layout
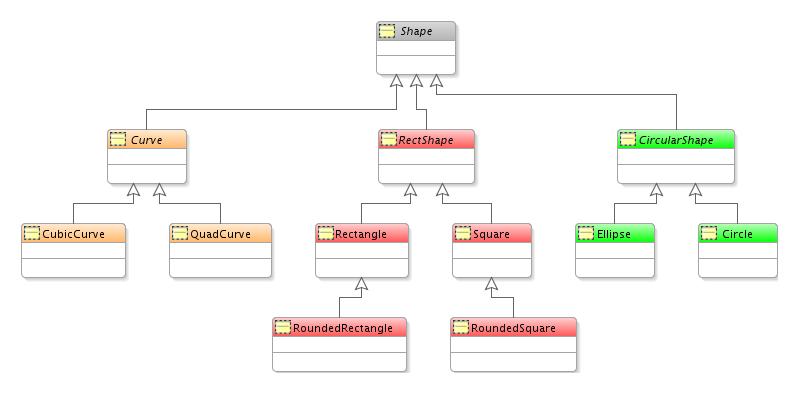
Hierarchical layout puts diagram elements in hierarchies based on generalization structures and other edges with a defined direction, as show in Figure 5-5. edges between the nodes are laid out using the most direct route. Nodes on a diagram that are not connected to any other nodes are laid out in a grid layout. Hierarchical layout is available in four orientations: top to bottom, bottom to top, left to right and right to left.
5.3.3.2 Using a Symmetrical Diagram Layout
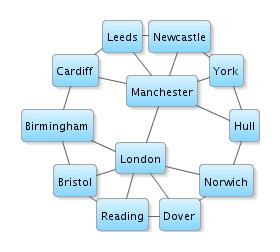
Symmetrical layout aligns diagram elements symmetrically based on the edges between the nodes as shown in Figure 5-6. Under certain circumstances, a symmetrical layout will position nodes in a radial layout around a central node. Nodes on a diagram that are not connected to any other nodes are laid out in a grid layout.
5.3.3.3 Using an Orthogonal Diagram Layout
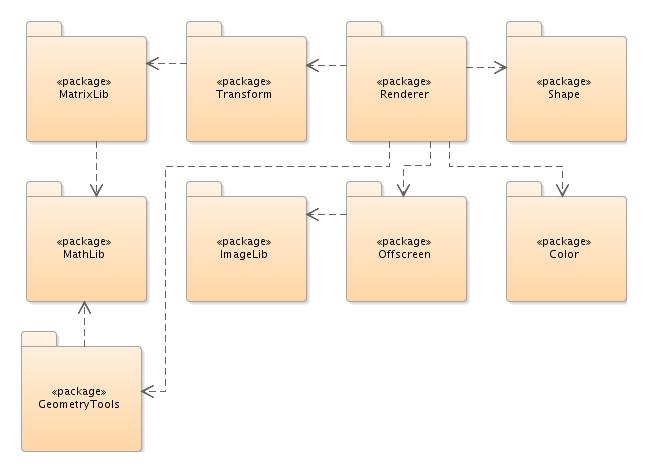
Orthogonal diagrams show hierarchical and non-hierarchical elements where the aligned edges of a component all follow the same direction, as shown in Figure 5-7. For class diagrams, a layout is created which represents each generalization hierarchy in an aligned fashion.
5.3.3.4 Using a Grid Diagram Layout
Grid layout puts the diagram elements in a grid pattern with nodes laid out in straight lines either in rows from left to right, or in columns from top to bottom, as shown in Figure 5-8. Nodes are laid out starting with the top left node.
5.3.3.5 How to Layout Diagram Elements
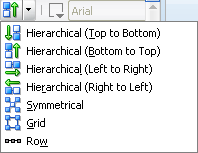
Layout styles are available by opening the context menu for a diagram and choosing Lay Out Shapes, or by using the Diagram Layout Options Dropdown as shown in Figure 5-9,
To layout elements on a diagram:
-
Choose one of the following:
-
Select the individual elements on the diagram.
-
Click the surface of the diagram to layout all the elements on a diagram.
-
Select the container element to layout all the elements within a container element.
-
-
On the diagram tool bar, choose the required layout style from the dropdown list, shown in Figure 5-9.
After the selected elements have been laid out they remain selected to be moved together to any position on the diagram.
To set the layout for new elements on a diagram go to View > Properties window.
To se the default layout for elements on a diagram go to Tools > Preferences > Diagrams.
5.3.3.6 How to Layout Diagrams Using the Grid
Diagram elements can be automatically snapped to the nearest grid lines, even if the grid is not displayed on the diagram. Grid cells on the diagram are square and only one value is required to change both the height and width of the grid cells. By default, elements are not snapped to the grid on activity diagrams. To set the default diagram grid display and behavior go to Tools > Preferences, select Diagrams. From there you can select the Show Grid checkbox to display the grid or Snap to Grid checkbox to snap elements to the grid. The grid does not have to be displayed for elements to be snapped to it.
To define diagram grid display and behavior for the current diagram:
-
Click the surface of the diagram.
-
In the View > Properties window, select to Show Grid, or Snap to Grid.
5.3.3.7 How to Distribute Diagram Elements
Distributing diagram elements spacially arranges elements to specific point, such as top, bottom, etc. When you are distributing elements, the outermost selected elements on the vertical and horizontal axes are used as the boundaries. To fine tune the distribution, move the outermost elements in the selection, then redistribute the element.
To distribute diagram elements:
-
Select three or more diagram elements and choose Diagram > Distribute.
-
Select the distribution for the elements.
-
Select the horizontal distribution: None, Left, Center, Spacing, or Right.
-
Select the vertical distribution: None, Top, Center, Spacing, or Bottom.
-
-
Click OK.
5.3.3.8 How to Align Diagram Elements
Elements can be aligned vertically and horizontally. You can also change the location of elements to have equal vertical and horizontal spacing.
-
Select two or more elements. Choose Diagram > Align.
-
Choose from the following:
-
Select the horizontal alignment.
-
Select the vertical alignment.
-
-
Use the Size Adjustments checkboxes to set the size of the selected elements:
-
Select the Same Width for all the selected elements to have the same width. The new element width is the average width of the selected element.
-
Select the Same Height for all the selected elements to have the same height. The new element height is the average height of the selected elements.
-
-
Click OK.
5.3.3.9 How to Hide Edges on a Diagram
Hide a single edge or any number of edges on your diagrams. Edges that are hidden on a diagram continue to show in the Structure window, with "hidden" appended. If there are any hidden edges, you can bring them back into view individually or all at once.
-
Select the diagram edge to hide. (To select all edges of a particular type, right-click an edge, then choose Select All This Type.)
-
Right-click and choose Hide Selected Shapes.
You can also go to the Structure window, select the edge or edges to hide, right-click and choose Hide Shapes.
5.3.3.10 How to Show Hidden Edges on a Diagram
In the Structure window, select the edge to show, right-click and choose Show Hidden Shapes.
5.3.3.11 How to Show all Hidden Edges on a Diagram
In the Structure window, select the edges to show, right-click and choose Show Hidden Shapes.
5.3.3.12 How To List All Hidden Edges Together in the Structure Window
Right-click an object listed in the Structure window and choose Order By Visibility.
5.3.3.13 How to Display Related Classes on a Diagram
Classes and interfaces related to those currently displayed on the diagram can be brought onto the diagram. This includes classes or interfaces that are extended, implemented, or referenced by the selected class or interface.
Choose from the following options to display related classes on a diagram:
-
Select the class or interface, on the diagram, then choose Model > Show > Related Elements.
-
Right-click the class or interface, on the diagram, then choose Show > Related Elements.
5.3.3.14 How to Layout Edges on a Diagram
Diagram edges can be laid out in either oblique or rectilinear line styles. Oblique lines can be repositioned at any angle. Rectilinear lines are always shown as a series of right angles.
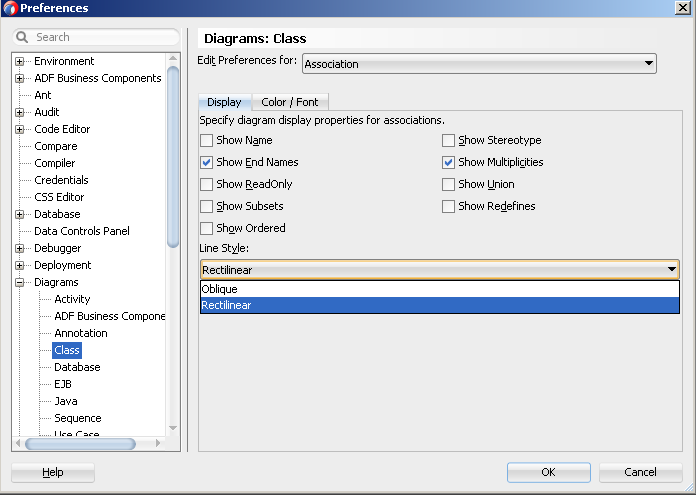
You can set the default line style for each diagram edge using the Line Style prefernence.using the "Line Style" preference under Tools > Preferences > Diagrams > Class and edit preferences for Association, as shown in Figure 5-10.
You can also set the line style for all instances of that diagram type. Keep in mind that when the line style of an individual edge is changed to oblique, and you change the line style from rectilinear to oblique, no change will be apparent on the diagram, but you will then be able to move any of the lines on the diagram into a new position at any angle.
You can select individual ideogram edges and change their line style. If you change an individual line from oblique to rectilinear, the line will be redrawn using right angles. If you change an individual line from rectilinear to oblique, no change will be made to the line, but you can reposition it (or portions of it) at any angle.
You can also choose the crossing styles for your lines to be bridge or tunnel style. Selecting bridge creates two parallel lines where the lines intersect. Selecting tunnel creates a semi-circle shape on the intersection. The default style is a regular crossing over of the two lines where the lines intersect.
5.3.3.15 How to Change Crossing Styles on a Diagram
You can choose the crossing styles for your lines to be bridge or tunnel style. Selecting bridge creates two parallel lines where the lines intersect. Selecting tunnel creates a semi-circle shape on the intersection. The default style is a regular crossing over of the two lines where the lines intersect. You can also choose no crossing style, which is the default setting.
5.3.4 Working with Diagram Nodes
Nodes can be hidden or shown. You can create nodes inside or outside elements.
5.3.4.1 How to Create a Node on a Diagram
Create a node using the Components window.
To create a node on a diagram:
-
Select the node type you want to create from those listed in the Components window for your diagram.
-
Click the diagram where you want to create the node, or drag it from the component palette. This adds the node at its default size.
Or
Click and hold down the mouse button where you want to place one of the corners of the node and drag the node outline to the opposite node corner and release the mouse button.
-
Enter the name for the node when the default element name is highlighted on the new node.
5.3.4.2 How to Create Internal Nodes on a Diagram Element
Elements can be represented on a diagram as internal nodes on other diagram elements.
Internal nodes can be used to create the following:
-
Inner classes and inner interfaces.
-
Relation usages.
To create an internal node on a diagram element:
-
Select the node on the diagram to create an internal node.
-
Choose Diagram > View As Expanded to display an expanded view of the node.
-
Create the node for the internal node inside the expanded box, or drag the appropriate node from the Applications window, or diagram, and drop it in the expanded node to create an inner node.
5.3.4.3 How to Change the Way Nodes are Presented on a Diagram
Select the diagram element(s) and choose one of the following:
-
Diagram > View As > Compact.
-
Diagram > View As > Symbolic.
-
Diagram > View As > Expanded.
5.3.4.4 How to Optimize the Size of Nodes on a Diagram
Use the optimize feature of the right-click context menu to optimize your nodes. Optimizing will adjust the size of the nodes so that all attributes show.
To optimize the size of nodes on a diagram:
-
Select the nodes to resize.
-
Right-click the selected nodes then choose Optimize Shape Size > Height and Width, as one option, or separately.
5.3.5 Annotating Your Diagrams
Notes are used for adding comments to a diagram or the elements on a diagram. A note can be attached to one or more elements. A note is stored as part of the current diagram, not as a separate file system element. Note options are available in the Components window, as shown in Figure 5-13.
5.3.5.1 How to Add a Note to a Diagram
Use the Diagram Annotations feature in the Components window to add a note to your diagram.
-
Click the Note icon in the Diagram Annotations section of the Components window.
-
To create the note at the default size, click the diagram to create the note.
Or
To create the note at a different size, click the diagram, drag the note box to the desired size, and release the mouse button.
-
Enter the text for the note, then click the diagram surface.
5.3.5.2 How to Attach a Note to an Element on a Diagram
The Components window Diagram Annotations feature provides an Attachment component to attach notes to your diagram elements.
To attach a note to an element on a diagram:
-
Click the Attachment icon in the Diagram Annotations section of the Components window.
-
Click the note.
-
Click the element that you want to attach the note to.
5.3.6 Transforming Databases, Classes and Interfaces
JDeveloper supports UML transformations on your database tables, Java classes, and interfaces. You can use these transformation features to produce a platform-specific model like Java from a platform-independent model like UML. You can perform transformations multiple times using the same source and target models. There are also some reverse transforms to UML from Java classes.
Transformations can be done in the following ways:
-
Transformation on the same diagram as the original.
-
Transformation on a new diagram created for the transformed element.
-
Transformation only in the current project, and not visually on a diagram.
5.3.6.1 How to Transform Classes or Interface
You can use the UML modeling tools to create a UML Class model, and then transform it to an offline database or vice-versa.
To transform UML, Java classes, or interfaces:
-
Select the elements to transform.
-
Do one of the following:
-
To create only the definitions of the transformed elements, but not add them to a diagram, choose Diagram > Transform > Model Only.
-
To create the transformed elements on the current diagram choose Diagram > Transform > Same Diagram.
-
To create a new diagram for the transformed elements, and display the transformed elements on it, choose Diagram > Transform > New Diagram.
-
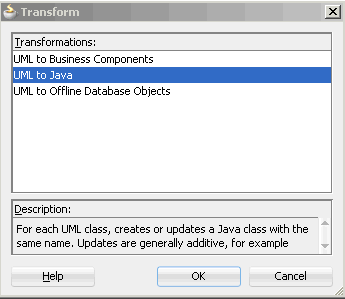
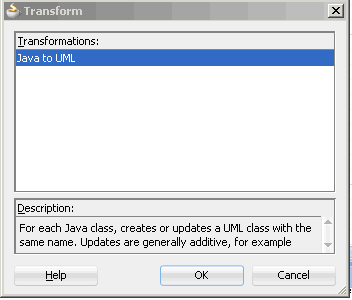
Select the transformation you want to perform on the selected elements, then click OK, as show in Figure 5-14 and Figure 5-15.
-
5.3.6.2 How to Transform UML and Offline Databases
You can use the UML modeling tools to create a UML Class model, and then transform it to an offline database or vice-versa. Note that if you want to transform all of the elements on a diagram use File > New > From Gallery > Database Diagram > Offline Database Objects > Offline Database Objects from UML Class Model.
To transform a UML class diagram to an offline database:
-
Open the diagram to transform.
-
Select the elements to transform. Right-click and choose Transform.
-
Choose from one of the following:
-
Model Only. The offline database model based on the UML Class model is created in the Applications window in the current project.
-
Same Diagram. The offline database model based on the UML Class diagram is created. The offline database model can be viewed in:
-
The Applications window.
-
The UML Class diagram, as modeled tables.
-
-
New Diagram. The offline database model based on the UML Class diagram is created. The offline database model can be viewed in both:
-
The Applications window.
-
A new database diagram, as modeled tables and constraints.
-
-
-
Choose UML to Offline Database.
-
Click OK.
To transform an offline database diagram to UML
-
Select the offline database object or objects you want to transform.
-
Right-click and choose Transform. Select from one of the following options:
-
Model Only. A UML class model based on the database schema is created in the Applications window in the current project.
-
Same Diagram. A UML class diagram based on the offline schema is created. The new classes can be viewed in both:
-
The Applications window.
-
The UML Class diagram, as classes for each transformed database table.
-
-
New Diagram. When the wizard finishes, a UML class diagram based on the offline database schema is created. The classes can be viewed in both:
-
The Applications window as a new UML classes.
-
A new class diagram, as classes for each transformed database table.
-
-
-
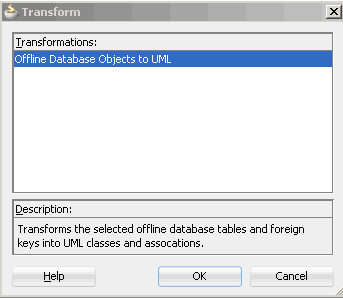
The Transform dialog appears as shown in Figure 5-16. Select Offline Database Objects to UML.
-
Click OK.
To create offline database objects from UML:
-
In the Applications window, select the project containing the UML classes to transform.
-
Choose File > New > From Gallery.
-
In the Database Tier choose Items > Offline Database Objects from UML Class Model. When you invoke the wizard from the New Gallery, the offline database objects creating during the transform process are only available in the Applications window.
During transformation you have the following choices:
-
How the UML names are converted to offline database names.
-
How UML class hierarchies and many-to-many associations are handled.
-
Where the schema the objects are going to.
-
Which log messages you want to see. You can choose which transformation messages to be logged, and you can choose whether to send the messages to the Log Window or to a log file.
-
-
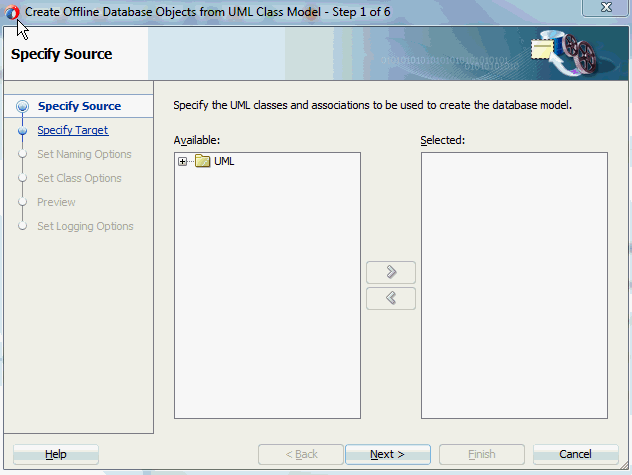
The Offline Database Objects from UML Class Model wizard opens, as show in Figure 5-17. Select the UML classes and associations to transform.
-
Click Finish. The offline database objects are created in the Applications window.
To choose the type of transformation messages to log:
-
Invoke the Offline Database Objects from UML Class Model wizard.
-
On the Set Logging Options page, choose where you want the log messages to appear, and the type of actions you want logged.
You have the option of reviewing the changes before running the transform. In addition, you can specify the types of transformation messages to be logged, and whether they appear in the Log Window or are sent to a log file.
There are four types of generalization to specify on the Set Class Options page on the Offline Database Objects from UML Class Model Wizard.
The options are:
-
Transform root classes
-
Transform leaf classes
-
Transform all classes, with generalization
-
Transform all classes, creating foreign keys
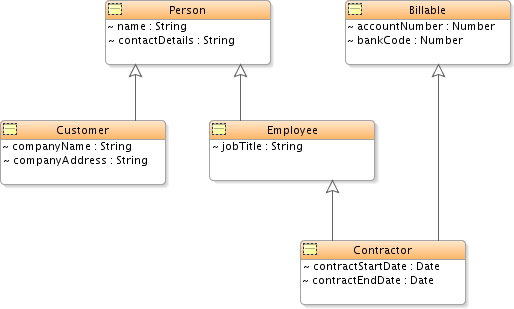
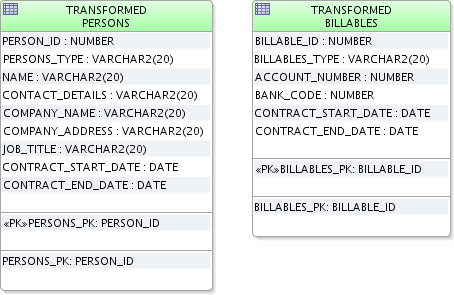
Consider the case of two root classes and three leaf classes, as shown in Figure 5-18.
If you select the option Transform Root Classes, root classes are transformed into offline tables, and all the attributes and foreign keys from their descendant classes in the hierarchy are also transformed as shown in Figure 5-19. You also have an option of creating a discriminator column. The discriminator column contains marker values for the persistence layer to decipher what subclass to instantiate for a particular row.
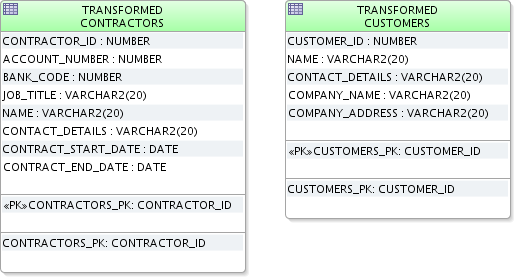
If you select the option Transform only leaf classes, inheriting from generalized classes, leaf classes are transformed into offline tables, and they inherit their columns and foreign keys from their ancestor classes, as shown in Figure 5-20.
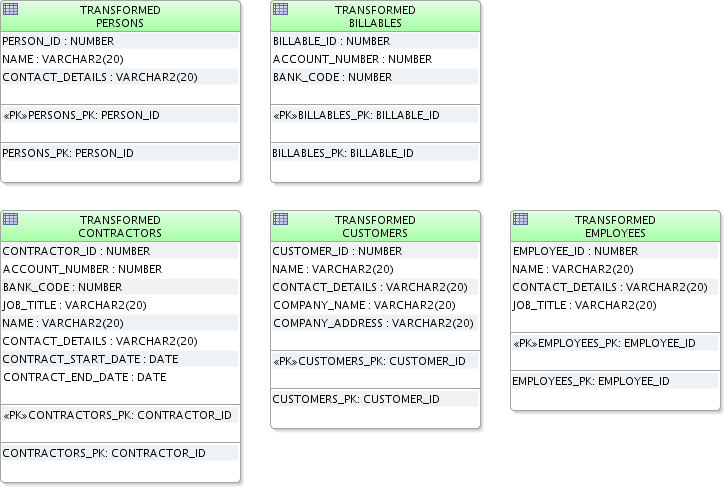
If you select the option Transform all classes, inheriting from generalized classes, an offline table is created for every class in the transform set. Each table inherits columns and foreign keys from its ancestor tables but is otherwise independent, as shown in example Figure 5-21.
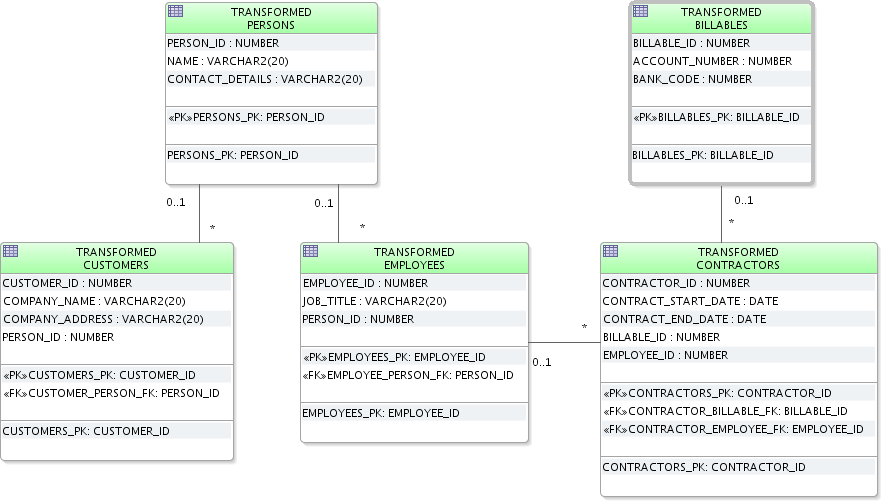
If you select the Transform all classes, creating foreign keys option to generalized classes, an offline table is created for every class in the transform set. No columns or foreign keys are inherited; a foreign key is created to the parent table or tables, as shown in Figure 5-22.
5.3.7 Storing Diagrams Locally
Diagrams are stored on disk as diagram files. Diagram files reference the elements that are displayed on the diagram and contain display information for those elements (size, color, font, display of various properties etc.). Diagram files are stored in the folder for the package in which the diagram resides, and is stored in the model path specified in the project settings. Notes, diagram links and dependencies are also stored in the diagram file.
To set the model path, choose Application > Default Project Properties > Project Source Paths > Modelers.
Diagram elements such as Java classes are referenced in the diagram file, but their definition and implementation details are only stored in the implementation files for those elements. Although the diagrammatic details for these elements (position, color, size, etc.) are stored in the diagram file, no separate model definitions of these elements are stored.
5.4 Creating UML Elements Off a Diagram
The UML elements that you create in the New Gallery are listed in the databases window and can be dropped onto your diagrams after they are created independently of the diagram.
5.4.1 How to Create UML Elements Off a Diagram
Use the New Gallery to create UML elements without a pre-existing diagram.
To create UML elements off a diagram:
-
Select the project in the Applications window.
-
Select File > New. The New Gallery opens.
-
In the Categories panel, open the General node and select the UML node. The UML elements are listed in the Items panel.
-
In the Items panel, select the UML element to create, then click OK. The properties dialog opens for the selected UML element.
-
Complete the properties dialog, then click OK. The UML element is added to the applications window.
5.5 Importing and Exporting UML
UML models created using other modeling software can be imported into JDeveloper using XML Metadata Interchange (XMI) if the models are UML 2.1.1 to 2.4.1 compliant.
The XMI specification describes how to use the metamodel to transform UML models as XML documents.
5.5.1 How to Import and Export UML Models Using XMI
The following are restrictions that apply to importing:
-
Diagrams cannot be imported.
-
XMI must be contained in a single file. Any profiles referenced by XMI must be registered with JDeveloper through Tools > Preferences > UML > Profiles before importing. The profiles must be in separate files. For more information see, Section 5.5.3, "Using UML Profiles".
-
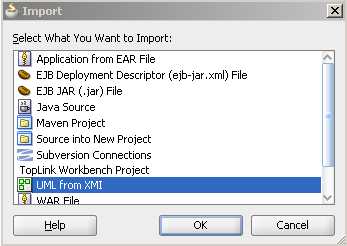
With an empty project selected in the Applications window, choose File > Import.
-
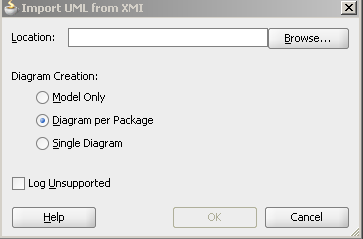
Select UML from XMI, then click OK. Diagrams can be automatically created from the imported model. The dialog will offer you this option during the process, as shown in Figure 5-24.
-
Complete the Import UML from XMI dialog.
-
Select your project.
-
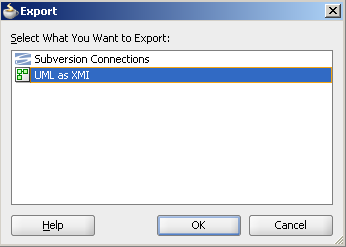
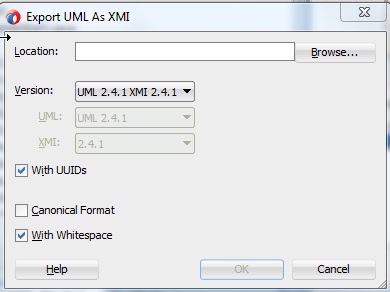
Choose File > Export.
5.5.2 Typical Error Messages When Importing
There are some typical errors and warnings that you can encounter in your XMI Import Log during import. Many of these can be easily resolved with a few simple steps, as detailed in table Table 5-1. Double clicking on the items in the log navigates to the problem element. Often issues arise because of incorrect namespaces and standard object references.
As with other XML, the structure of a valid file is specified by XML schemas, which are referenced by xmlns namespaces. The XML consists of elements that represent objects or the values of their parent element object and attributes that are values. Sometimes the values are references to other objects that may be represented as an href as for HTML.
Table 5-1 Typical Error Messages When Importing
| Error Type | Error Detail | Resolution |
|---|---|---|
|
Missing Profile |
|
In UML there is an extension mechanism that allows further XML schemas to be specified in a 'profile'. The messages above indicate that a relevant profile has not been registered. To register a profile see, Chapter 5, "Using UML Profiles". |
|
Invalid XMI Version |
Error(2,360): 2.0 is incorrect version for http://schema.omg.org/spec/XMI/2.1 |
This message occurs because there is a mismatch between the xmi:version attribute and the xmlns:xmi namespace. The xmi:version should be 2.1 |
|
Invalid UML Namespace |
Warning(2,356): http://schema.omg.org/spec/UML/2.1.1/Unknown is not a recognized namespace. |
This message occurs because the xmlns:uml namespace should be http://schema.omg.org/spec/UML/2.1.1/uml.xml |
|
Invalid L2 Standard Profile Namespace |
|
This case is when a standard profile is already registered with the tool. Change the XMI so that the xmlns namespace is http://schema.omg.org/spec/UML/2.1.1/StandardProfileL2.xmi and the reference is http://schema.omg.org/spec/UML/2.1.1/StandardProfileL2.xmi#_0. |
|
Invalid L3 Standard Profile Namespace |
|
There is a second standard profile already registered. If the profile is incorrectly referenced the messages will be similar to the L2 Profile Namespace. The correct namespace is http://schema.omg.org/spec/UML/2.1.1/StandardProfileL3.xmi and the correct reference is http://schema.omg.org/spec/UML/2.1.1/StandardProfileL3.xmi#_0. |
|
Invalid Standard Data Type Reference |
Error(7,75): Attempt to deference missing element http://schema.omg.org/spec/UML/2.1.1/Unknown#String |
|
5.5.3 Using UML Profiles
UML Profiles are subsets of the UML metamodel. These subsets specify well-formedness rules beyond those identified in the UML metamodel. Well-formedness rule is a term used in the normative UML metamodel specification to describe a set of constraints written in UML Object Constraint Language (OCL) that contribute to the definition of a metamodel element. JDeveloper comes with a handful of standard profiles for UML.
5.5.3.1 How to Add a Custom Profile
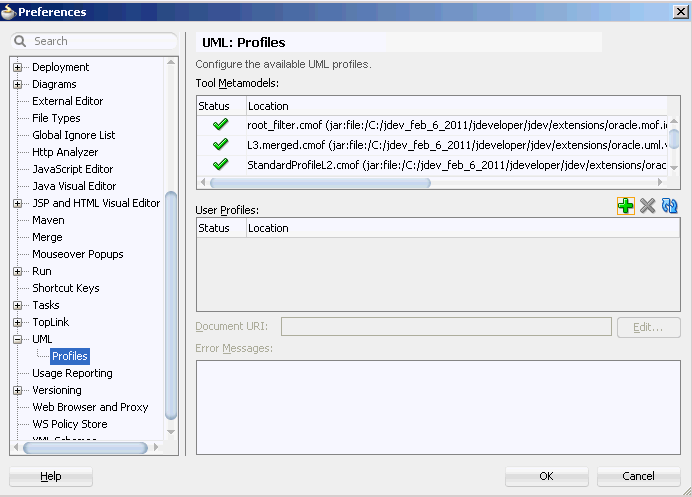
You can add your custom profiles by going to Tools > Preferences > UML > Profiles, and clicking Add. The profiles page shows all of the current profiles available in the applicatiom.as shown on Figure 5-27. Once you have added a custom profile, edit the URI (Universal Resource Indicator) for the profile by selecting the profile and clicking Edit. The URI tells the application where to look for the profiles. For more information on UML Profiles, there are some sample profiles in the OMG Catalog at, http://www.omg.org/technology/documents/profile_catalog.htm.
5.5.3.2 How to Apply a Profile to a UML Package
When you are doing UML transformations, you select a profile to apply the stereotypes for the UML translation to the target format. When you are transforming a UML package, you need to tell the system which profile to use, and what to call the resulting object, (i.e., class, or package).
To apply a UML profile to a package:
-
Open the Package Properties dialog of your UML package by right-clicking on it in the Applications window and choosing Properties.
-
In the Package Properties dialog, select Profile Application. Click Add and choose a UML profile.
-
In the Package Properties dialog, select Packaged Element.
-
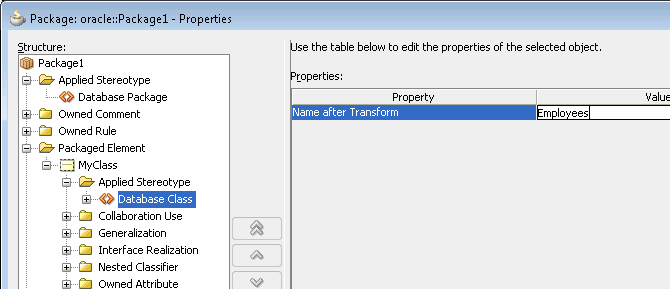
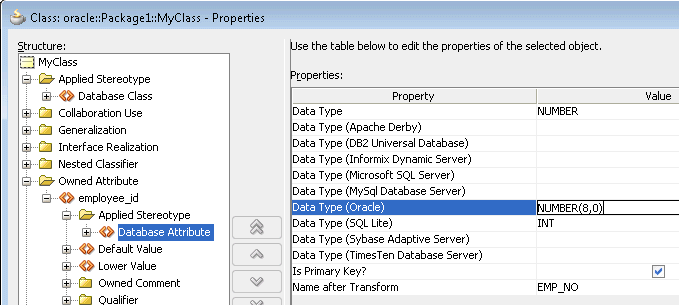
Expand the Class node, and choose Applied Stereotype and click Add. The properties available depend on the UML profile you are using. Figure 5-28 shows the Name after Transform property from the UML profile DatabaseProfile.
5.5.3.3 Using DatabaseProfile for UML Transformations
JDeveloper comes with a UML profile called DatabaseProfile which determines how class models are transformed to offline database models. For more information about UML profiles, see Section 5.5.3, "Using UML Profiles."
DatabaseProfile contains stereotype properties that control how elements are transformed. The stereotypes and their properties in this profile are described in Table 5-2.
Table 5-2 Stereotypes and Properties in DatabaseProfile
| Stereotype | Applied to | Offline Database Type | Properties | Notes |
|---|---|---|---|---|
|
Database Package |
UML::Package |
SCHEMA |
Name after transform |
|
|
Database Class |
UML::Class |
TABLE |
Name after transform |
|
|
Database Attribute |
UML::Property |
COLUMN |
Name after transform |
A UML Property can be an "attribute" or an association end |
|
Database Datatype |
UML::Type |
n/a |
DatatypePrimary |
In the metamodel, Type is the superclass for a large range of elements, including, Class, Association, PrimitiveType and so on. This stereotype can be applied to all of them. It can be read by the transformer whenever a property (attribute) is of a certain type. |
|
Database Association |
UML:: |
CONSTRAINT |
Name after transformForeign Key naming rule |
|
|
Database Generalization |
UML:: |
CONSTRAINT |
Name after transformForeign Key naming rule |
Certain transforms create foreign keys out of generalizations and this stereotype can apply here. |
The attributes, or properties, are described in Table 5-3.
Table 5-3 Properties of Stereotypes in DatabaseProfile
| Property | Description | Type |
|---|---|---|
|
Name after transform |
The name of the transformed database object. If blank, default naming rules are applied. |
String |
|
Datatype |
SQL text of the datatype. There are a number of datatypes, including default, ansi, Oracle, and other supported database types. |
String |
|
Foreign key naming rule |
The rule to use when naming a foreign key from an association: use the UML name, use the databaseName property or derived a default name from the table names. |
Both Tables |
|
Primary |
Flag to indicate that transformed column is part of the primary key for the parent table. |
Boolean |
To use DatabaseProfile to transform a class model:
-
Open the Package Properties dialog of a UML package
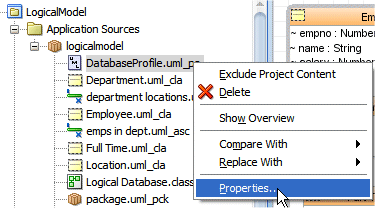
package.uml_pckby right-clicking on it in the Applications window and choosing Properties.For more help at any time, press F1 or click Help from within the Package Properties dialog.
-
In the Package properties dialog, select Profile Application and click Add.
-
In the Properties window, select
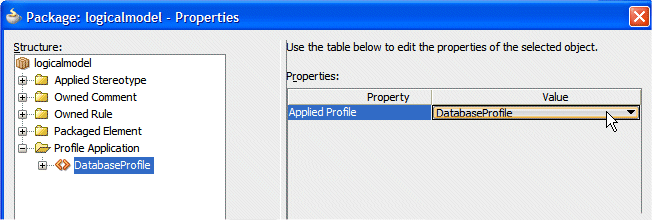
DatabaseProfilefrom the list of available profiles, as shown in Figure 5-29. Specify the name to use after the package has been transformed into an offline database schema. Select the Applied Sterotype node and click Add. Under Properties, a new propertyName after transformis listed. Enter a name. Click OK. A new fileDatabaseProfile.uml_pais now listed in the Applications window, as shown in Figure 5-30. -
To examine the Database Profile file, right-click it in the Applications window and choose Properties. The dialog shows the profile now used in the transform. Click OK to close the dialog.
-
Now you can apply stereotypes to the various elements in the project. In the example shown in Figure 5-30, you apply stereotypes to the Employee class by right-clicking
Employee.uml_claand choosing Properties. This opens the Class Properties dialog for that element.To specify the name to use after transformation, select Applied Stereotype, click Add, and choose
Database Class. Under Properties, enter a value next to Name after Transform, as shown in Figure 5-31. -
Once you have set the stereotypes to apply, proceed to transform the UML Class model following the steps in Section 5.3.6.2, "How to Transform UML and Offline Databases." The stereotypes and properties in DatabaseProfile you set are applied during transformation.
You can apply stereotypes to other elements as well. For example, you can specify datatypes and a primary key to attributes owned by a particular class. In the same Class Properties dialog, expand Owned Attibute. and select an existing attribute, or create one by clicking Add and entering a name for it.Expand the node for the owned attribute, select Applied Stereotype and click Add. Figure 5-31 shows that at this level you can specify a number of datatypes, whether the attribute should be transformed to a primary key, and the name after transform.
For information about the stereotypes and properties covered by DatabaseProfile, see Table 5-2, "Stereotypes and Properties in DatabaseProfile" and Table 5-3, "Properties of Stereotypes in DatabaseProfile".
5.5.4 UML Profile Diagrams
The profile diagram is structure diagram which describes the lightweight extension mechanism to UML by defining custom stereotypes, tagged values, and constraints. Profiles allow adaptation of the UML metamodel for different platforms and domains or your modeled business processes. Metamodel customizations are defined in a profile, which is then applied to a package. Stereotypes are specific metaclasses, tagged values are standard meta-attributes, and profiles are specific kinds of packages.
Semantics of standard UML metamodel elements are defined in a profile. For example, in a Java model profile, generalization of classes can be restricted to single inheritance without having to explicitly assign a Java class stereotype to each and every class instance. Profiles can be dynamically applied to or retracted from a model. They can also be dynamically combined so that several profiles will be applied at the same time on the same model.The profiles mechanism is not really a first-class extension mechanism. It does not allow to modify existing metamodels or to create a new metamodel as MOF does. Profiles only allow adaptation or customization of an existing metamodel with constructs that are specific to a particular domain, platform, or method. You can't take away any of the constraints that apply to a metamodel, but using profiles, you can add new constraints.Use the New Gallery to create your profile diagram. Choose File > New > From Gallery > Diagrams > Profile Diagram.
5.5.5 Creating MOF Model Libraries
Create MOF (Meta-Object Facility) Model Library .jar files to enable your UML objects from one project to be reused by another.
To create a MOF Model JAR File
-
Select the model node in your application project.
-
Go to New > From Gallery > Deployment Profiles > MOF Model Library. Click OK.
-
Add the name of your deployment profile. Click OK. The next dialog appears.
-
In the MOF Model Library dialog, select the location for your JAR file and complete the dialog. Click OK.
-
Deploy your changes to the JAR you have just created by choosing the project and right-clicking and choosing Deploy > MyMOFLibrary. If you want to add a library to your project go to Tools > Manage Libraries > Libraries > New and add the source path for your MOF Model Library. If you redeploy, you can update the JAR with any new changes you make.
5.6 Modeling with UML Class Diagrams
The definitions of the classes on a diagram, their members, inheritance, and composition relationships are all derived directly from the Java source code for those classes. These are all created as Java code, as well as being displayed on the diagram. If you change, add to, or delete from, the source code of any class displayed on the diagram, those changes will be reflected on those classes and interfaces on the diagram. Conversely, any changes to the modeled classes are also made to the underlying source code. Some information relating to composition relationships, or references, captured on a Java class diagram is stored as Javadoc tags in the source code.
A Java class diagram can contain shapes from other diagram types (Oracle ADF Business Components, UML elements, Enterprise JavaBeans, and database objects).
5.6.1 Understanding Class Diagrams
Classes are represented as rectangles containing class name and details. Classes can be displayed as compact, symbolic or expanded nodes. To set the display properties go to Tools > Preferences > Diagrams > (Diagram Type) > Display Options.
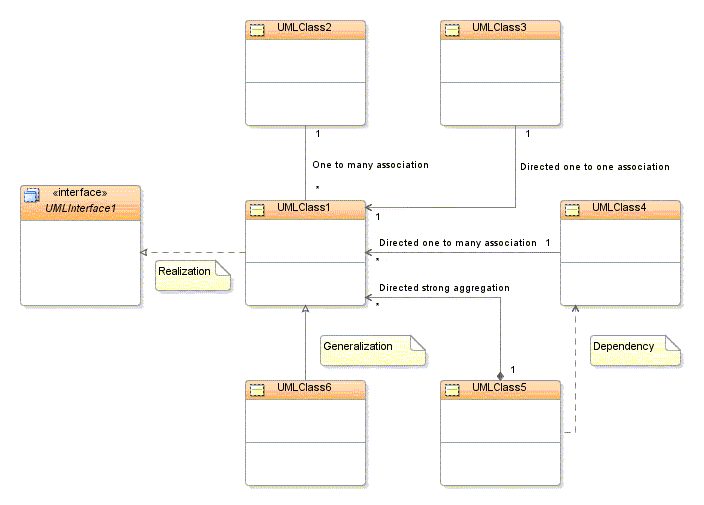
You can also change the way elements are represented on a diagram. On the diagram, classes and interfaces are divided into compartments, with each compartment containing only one type of information. An ellipsis (...) is displayed in each compartment when not large enough to display its entire contents. To display all the attributes of a modeled class, right-click the class and choose Optimize Shape Height. Figure 5-33 shows an example of a typical class diagram layout.
All attributes and operations display symbols to represent their visibility. The visibility symbols are: + Public, - Private, # Protected, and ~ Package.
Table 5-4 Elements in Class Diagram
| Elements | Description |
|---|---|
|
Interface |
Interfaces are represented with a keyword in the name compartment: «interface». interfaces can be displayed as compact, symbolic, or expanded nodes. Nested classes and interfaces can be modeled inside standard and expanded interfaces. |
|
Enumeration |
Enumerations are data types with a finite, and normally small, set of named literals. Enumerations contain sets of named identifiers that are its values. |
|
1 to * Association |
One to many association defines a relationship between classes. Represented on the diagram as a solid line. |
|
Directed One to One Association |
Directed One to One Association is represented on the diagram as a solid line with an open arrowhead in the direction of the association. |
|
Directed One to Many Association |
Directed One to Many Association is represented on the diagram as a solid line with an open arrowhead in the direction of more than one association. |
|
Directed Composite Aggregation |
Represented on the diagram as a solid line with an open arrowhead in the direction of the association and a filled diamond shape at the originating end of the association. |
|
Generalization |
Defines generalization relationships between classifiers. Represented on the diagram as a solid line with an empty arrowhead pointing towards the specialized classifier or interface. |
|
Realization |
Defines where an interface is realized by a class. Represented on the diagram as a dashed line with an empty arrowhead pointing towards the implemented interface. |
|
Class |
Represents an object. Classes form the main building blocks of an object-oriented application. Represented on the diagram as a rectangle containing three compartments stacked vertically. |
|
Package |
Use to divide a system into multiple packages, which can simplify and make the system easier to understand. |
|
Data Type |
Data types are modeled elements that define your data values. |
|
Primitive Type |
Primitive types or data types are data types such as boolean, byte, decimal, DateTime, Double Float, and Time. |
|
Constraint |
Constraints are the degree of freedom, or lack thereof that you have in modeling a system behavior, or solution. |
5.6.2 Working with the Class Diagram Features
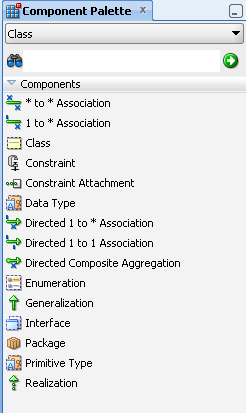
Use the Properties window to set properties for your elements. Each of the elements is represented by a unique icon and description as shown in Figure 5-34.
Create classes and interfaces by dragging the class onto the diagram. The element is created in the location specified by the model path in your project settings and default properties. (Application > Default Project Properties). You can also model packages by clicking on the package. If you right-click a modeled package and choose Drill Down, a diagram is displayed for that package.
Class properties are added to modeled classes and interfaces on a diagram by doing one of the following:
-
Double-click the modeled class or interface to access the properties dialog.
-
Right-click the class or interface and choose Properties.
5.6.2.1 How to Add Nested Classes and Nested Interfaces
Nested classes and nested interfaces are created either by creating them in the modeled class or interface using in-place create (with symbolic presentation only) and by changing shape display preferences, or by right-clicking the class and choosing View As > Expanded then creating another class inside the expanded node.
5.6.2.2 How to Add Attributes and Operations
Attributes and operations are added to modeled classes and interfaces by doing any of the following:
-
Double-click the modeled class or interface, then add the attribute or operation using the element property dialog.
-
Right-click the class or interface and choose Properties, then add the attribute or operation using the element property dialog.
-
Drag an existing attribute or operation from one class or interface on a diagram to another class or interface on the same diagram.
The order of an attribute or operation within a class or interface is changed by dragging it up or down on the screen. The Sort Alphabetically property for attributes or operations must be deselected: (Tools >Preferences > Diagrams > Class > Edit Preferences for: Class or Interface | Attributes or Operations | Sort Alphabetically).
5.6.2.3 How to Hide Attributes and Operations
Use the right-click context menu to hide or show attributes and operations elements on your diagram.
To hide one or more attributes or operations:
-
Select the attributes or operations to hide.
-
Right-click the selected items and choose Hide > Selected Shapes. To show attributes or operations choose Show All Hidden Members.
5.6.2.4 How to Add Generalizations, Realizations, and Associations
Generalized structures are created on a diagram of classes by using the Generalization icon on the Class Components window.
Where an interface is realized by a class, model it using the Realization icon on the Class Components window for the diagram.
A variety of associations can be created between modeled classes and interfaces using the association icons. Associations are modified by double-clicking the modeled association and changing its properties.
5.6.2.5 How to Create Java Classes, Interfaces and Enums
Java classes, interfaces, or enums are created on a diagram by clicking on the Java Class icon, Java Interface icon or Java Enum icon on the Java Components window for the diagram, and then clicking on the diagram where you want to create the class. The Java source file for the modeled class or interface is created in the location specified by your project settings.
Java Class, Java Interface, and Java Enum icons are represented on a diagram as rectangles containing the name and details of the Java class. Java classes and interfaces are divided into compartments, with each compartment containing only one type of information.
An ellipsis (...) is displayed in each compartment that is not large enough to display its entire contents. To view a modeled class so that all the fields and methods are displayed, right-click the class and choose Optimize Shape Size, then Height and Width.
Each type of class on a diagram is identified by a stereotype in the name compartment. This is not displayed by default.
Members (fields and methods) display symbols to represent their visibility. The visibility symbols are: + Public, - Private, # Protected. If no visibility symbol is used, the field or method has package visibility.
5.6.2.6 How to Model Inner Java Classes and Interfaces
A diagram can include primary or inner classes from different packages, the current application, or from libraries. Inner Java classes and inner interfaces are defined as members of their 'owning' class. Hence, they are also referred as member classes.
Inner classes and inner interfaces are displayed in the inner classes compartment of the modeled Java class or interface on the diagram. Inner classes are prefixed with the term Class, and inner interfaces are prefixed with the term Interface, between the visibility symbol and the class or interface name.
To create an inner class or inner interface on a modeled Java class or interface, either add the inner class to the implementing Java code, or create a new Java class or interface as an internal node on an existing modeled class.
Inner Java classes and inner Java interfaces cannot have the same name as any containing Java class, Java interface or package or contain any static fields or static methods.
5.6.2.7 Modeling Composition in a Java Class Diagram
A variety of references (previously referred to as associations) can be created quickly between classes and interfaces on a diagram using the various reference icons on the Java Class Components window for the diagram. References created between modeled Java classes are represented as fields in the source code of the classes that implement the references. Compositional relationships are represented on the diagram as a solid line with an open arrowhead in the direction of the reference. Table 5-5 displays the references that can be modeled on a diagram.
Table 5-5 References Between Classes or Interfaces
| Reference | Description |
|---|---|
|
Reference (Object) |
A singular, direct reference from one class or interface to another. This is represented in the code of the reference's originating class as a field of type |
|
Reference (Array) |
A reference to an array of another class or interface. This is represented in the code as an array of type |
|
Reference (Collection) |
This is represented in the code as a Collection declaration, and adds an |
|
Reference (List) |
This is represented in the code as a List declaration, and adds an |
|
Reference (Map) |
This is represented in the code as a Map declaration, and adds an |
|
Reference (Set) |
This is represented in the code as a Set declaration, and adds an |
Note:
If you want to quickly change the properties of a reference on a diagram, double-click it to display the Code Editor and change the details of the reference.
Labels are not displayed on references by default. To display the label for a reference, right-click the reference and choose Visual Properties, then select Show Label. The default label name is the field name that represents the reference. If you select this label name on the diagram and change it, an @label <label_name> Javadoc tag will be added before the field representing the reference in the code.
You can change the aggregation symbol used on a reference on a diagram by right-clicking the reference, choosing Reference Aggregation Type, then choosing None, Weak (which adds an @aggregation shared Javadoc tag to the code representing the reference), or Strong (which adds an @aggregation composite Javadoc tag to the code representing the reference). Aggregation symbols are for documentary purposes only.
5.6.2.8 Modeling Inheritance on a Java Class Diagram
Inheritance structures, which are represented in the Java source as extends statements, can be created on a diagram of Java classes using the Extends icon on the Java Class Components window for the diagram. Extends relationships are represented on the diagram as a solid line with an empty arrowhead pointing towards the extended class or interface.
Where an interface is implemented by a class, this can be created using the Implements icon on the Java Components window for the diagram. Creating an implements relationship adds implements statement to the source code for the implementing class. Implements relationships are represented on the diagram as a dashed line with an empty arrowhead pointing towards the implemented Java interface.
5.6.2.9 Extending Modeled Java Classes
Extends relationships model inheritance between elements in a class model. Extends relationships can be created between Java classes and between Java interfaces, creating an extends statement in the class definition. Enums cannot extend other classes, or be extended by other classes.
Note:
As multiple class inheritance is not supported by Java, only one extends relationship can be modeled from a Java class on a diagram. Multiple extends relationships can be modeled from a Java interface.
5.6.2.10 Implementing Modeled Java Interfaces
Implements relationships specify where a modeled Java class is used to implement a modeled Java interface. This is represented as an implements keyword in the source for the Java class. Implements relationships are represented on class diagrams as dashed lines with an empty arrowhead pointing towards the interface to be implemented. Enums cannot implement interfaces.
If the implemented interface is an extension (using an extends relationship) of other modeled interfaces, this is reflected in the Java source code for the interface.
A class that implements an interface can provide an implementation for some, or all, of the abstract methods of the interface. If an interface's methods are only partially implemented by a class, that class is then defined as abstract.
5.6.2.11 Modeling Java Fields and Methods
You can create members (fields and methods) of a Java class or interface on a diagram. The fields and methods are added to modeled Java classes and interfaces on a diagram by double-clicking the modeled Java class or interface then adding the field or method using the Java Source Editor.
-
Fields are used to encapsulate the characteristics of a modeled Java class or Java interface. All modeled fields have a name, a datatype and a specified visibility.
When a field or method is displayed on a class on a diagram, it is prefixed with + (if declared as public), - (if declared as private) or # (if declared as protected). Static fields are underlined on the diagram.
-
Methods are defined on a class to define the behavior of the class. Methods may have return types, which may be either a scalar type or a type defined by another class.
5.6.2.12 How to Refactor Class Diagrams
If you rename or move a class using the in-place edit functionality on a diagram, the source code for the class is refactored automatically. Renaming or moving a Java package on a diagram automatically refactors the contents of that package.
Deleting a field, method, or inner class on a diagram automatically applies the Delete Safely refactoring pattern. To apply a refactoring pattern to a Java class, interface, enum, or member on a diagram, select the class or member on the diagram and choose the refactoring pattern from the refactoring menu.
The following refactoring patterns are available for the Java classes, interfaces, and enums on a Java class diagram:
-
Rename
-
Move (applies to both single and multiple selections on the diagram)
-
Duplicate
-
Extract Interface
-
Extract Superclass
The following refactoring patterns are available for the Java fields and methods on a Java class diagram:
To invoke a refactoring operation:
-
Select a program element in a source editor window, databases window, or structure pane.
-
Right-click on the program element.
-
Choose an operation from the context menu.
-
You can also choose Refactor from the toolbar and select a refactoring operation from the drop-down list.
-
Rename
-
Move
-
Make Static
-
Pull Members Up
-
Push Members Down
-
Change Method (Java methods only)
5.7 Modeling EJB/JPA Components
Enterprise JavaBeans (EJBs) modeling helps you visualize your EJB entity relationships and architecture, and to quickly create a set of beans to populate with properties and methods, and to create a graphical representation of those beans and the relationships and references between them. Whenever a bean is modeled, the underlying implementation files are also created.
To model EJBs start by creating an EJB diagram. For more information, see Section 5.3.1.1, "How to Create a New Diagram." You can later add other elements like UML classes, Java classes, business components, offline database tables, UML use cases and web services to the same diagram. For more information, see Section 5.3.2, "Working with Diagram Elements."
The following are the modeling options available:
-
Entity beans can be either Container-Managed Persistence (CMP) or Bean-Managed Persistence (BMP). Before creating entity beans with bean-managed persistence, you may want to first consider whether you will need to create relationships between those entity beans. Relationships can only be created between entity beans with container-managed persistence.
-
Session beans can be have their session type changed on a class diagram by right-clicking on the session bean and choosing Session Type, then Stateful or Session Type, then Stateless.
-
Message-driven beans are most often used to interact (using EJB References) with session and entity beans.
5.7.1 Working with EJB/JPA Modeling Features
Enterprise JavaBeans are created on a diagram by using the Entity Bean icon, Session Bean icon or Message-Driven Bean components on the Components window. Select the component and then click the diagram in the desired spot. The implementation files for the modeled elements are created in the location specified by your project settings.
Tip:
If you want to model the implementing Java classes for a modeled bean on a diagram, right-click the modeled bean and choose Show Implementation Files.
Properties and methods are added by either double-clicking the bean and adding the property or method using the EJB Module Editor or by creating the new property or method 'in-place' on the modeled bean itself.
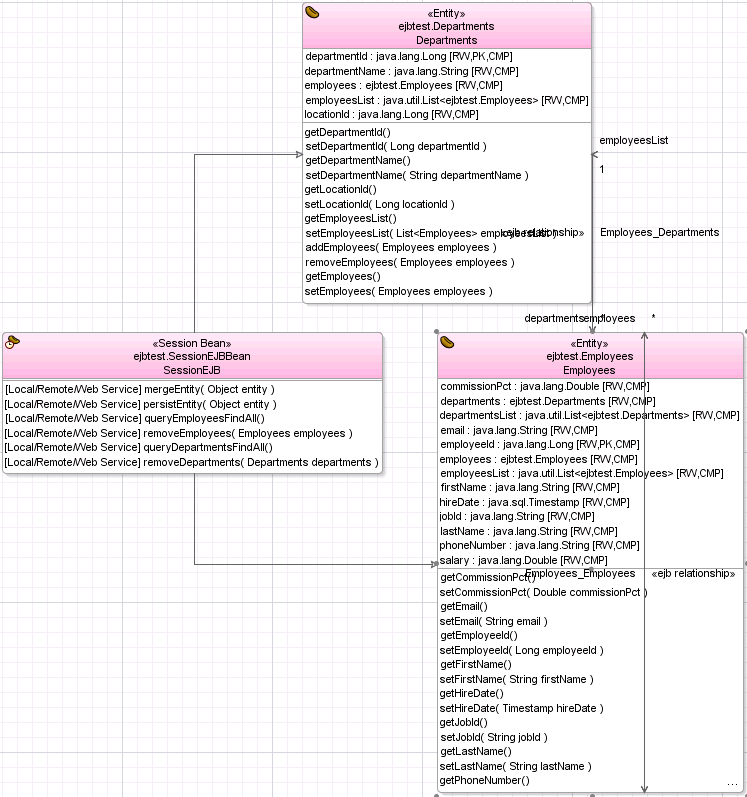
Modeled session and entity beans are made up of several compartments. For example, Message-driven beans have only a name compartment containing the «message-driven bean» stereotype and the name of the bean. For EJB 3.0 beans the model looks different because there are no compartments for interfaces.
Notice the relationship and edges between the beans. References can be created from any bean to another bean with a remote or local interface. References can only be modeled between beans that are inside the current deployment descriptor.
To create a diagram of EJB/JPA classes:
-
Create a new EJB diagram in a project or application in the New Gallery.
-
Create the elements for the diagram using the EJB Components window. Table 5-6 shows the EJB Components window.
Table 5-6 EJB Components window Icons
Drop-down List Icon Name EJB Nodes

Entity

Message-driven Bean

Session Bean
Entity Relationships

Bidirectional * to * Relationship

Bidirectional * to 1 Relationship

Bidirectional 1 to 1 Relationship

Unidirectional * to * Relationship

Unidirectional * to 1 Relationship

Unidirectional 1 to * Relationship

Unidirectional 1 to 1 Relationship
EJB Edges

Entity Inheritance Edge

Session Facade Edge
Diagram Annotations

Attachment

Group

Link

Note
5.7.1.1 How to Model EJB/JPA Relationships
You can model a relationship between any two entities on a class diagram by dragging the relationship component from the Components window. You can also show the inheritance edge between the root and child entity.
To model a relationship between two entities on a diagram:
-
Click the icon for the relationship to create.
Notes:
The navigability and multiplicity of a relationship end can be changed after it has been created.If EJB component icons are not displayed, select EJB Components from the dropdown on the Components window .
-
Click the entity at the 'owning', or 'from', end of the relationship.
-
Click the entity bean at the 'to' end of the relationship.
-
Click the relationship line on the diagram, then click the text fields adjacent to the association to enter the relationship name.
Note:
To change the multiplicity of a relationship end on the diagram, right-click on the relationship end and choose either Multiplicity > 1 or Multiplicity > *.
5.7.1.2 Using References Between Beans
References can be created from any bean to any other bean with a remote interface using the EJB Reference icon and local references can be created from any bean to any other bean with a local interface using the EJB Local Reference icon on the EJB Components window for the diagram.
A variety of relationships can be created quickly between modeled entity beans using the 1 to * Relationship icon, Directed 1 to 1 Relationship icon, Directed 1 to * Relationship and Directed Strong Aggregation icons.
5.7.1.3 How to Create Properties on Modeled Beans
Properties can be added to modeled EJBs by either double-clicking the bean and adding the property or method using the EJB Module Editor or by creating the new property or method directly on the modeled bean.
When creating a property directly on a modeled bean, enter the name and datatype of the property. For example:
name : java.lang.String
A public (+) visibility symbol is automatically added to the start of the property.
Note:
If a property type from the java.lang package is entered without a package prefix, for example, String or Long, a property type prefix of java.lang. is automatically added. If no type is given for a property, a default type of 'String' (java.lang.String) is used
5.7.1.4 How to Create Methods on Modeled Beans
Both local/remote and local/local home methods can be created on modeled beans on a class diagram.
When creating a method in-place on a modeled bean, enter the name, and optionally the parameter types and names, and return type of the method. The method return type must be preceded by a colon (:). For example:
getName(String CustNumber) : java.lang.String
A public (+) visibility symbol is automatically added to the start of the method.
Notes:
If a return type from the java.lang package is entered without a package prefix, for example, String or Long, a return type prefix of java.lang. is automatically added to the Java in the method's class. If no parameter types are provided, the method will be defined with no parameters. If no return type is specified, a default return type of void is used. To change a property of the method, double-click the class on the diagram, or on the applications window, then change the details of the method using the EJB Editor.
5.7.1.5 How to Model Cross Component References
References can be created between modeled beans on a class diagram.
-
EJB References can be created from any bean to any other bean with a remote interface.
-
EJB Local References can be created from any bean to any other bean with a local interface.
Note:
References can only be made to beans that are inside the current deployment descriptor.
To model a reference between modeled beans:
-
Click the icon from those listed on the EJB Components window:
-
EJB Reference
-
EJB Local Reference
-
-
Click the bean at the 'owning', or 'from', end of the reference.
-
Click the bean at the 'to' end of the reference.
5.7.1.6 How to Display the Implementing Classes for Modeled Beans
Each modeled bean has underlying Java source files that contain the implementation code for that element. These implementation files can be displayed on the diagram as modeled Java classes.
To display a modeled implementing Java class for a modeled bean:
-
Select the bean, the Java implementation you want to model on the diagram, then choose Model > Show > Implementation Files.
-
Or, right-click the bean and choose Show Implementation > Files.
5.7.1.7 How to Display the Source Code for a Modeled Bean
The Java source code for a modeled bean can be displayed in the source editor with simple commands on the diagram.
To display the Java source code for a model element:
-
Right-click the element on the diagram. Choose Go to Source, then choose the source file you want to view.
Or -
Select the element and choose Model > Go to Source.
5.7.1.8 How to Change the Accessibility of a Property or Method
You can change the accessibility of a property or method using right-click.
To change the accessibility of a property or method:
-
Right-click the property or method you want to change.
-
Choose the required accessibility option from the Accessible from option.
The accessibility options are:
-
Local Interface
-
Remote Interface
-
Local and Remote Interfaces
-
5.7.1.9 How to Reverse Engineer a Diagrammed JPA Entity
Modeled entity beans can be reverse-engineered on a diagram of EJBs from table definitions in your application database connection.
To reverse-engineer a table definition to an entity bean:
-
Open, or create a diagram.
-
Expand the node in the Connections window for your database connection.
-
Expand the user node, then the Tables nodes.
-
Click the table, the definition to use to create an entity bean, and drag it to the current diagram.
To reverse-engineer several tables to entity beans, hold down the Ctrl key, select the tables in the databases window and drag these tables to the diagram, then release the Ctrl key.
-
Select the EJB version and click OK.
5.8 Modeling with Database Diagrams
Modeling your database structures gives you a visual view of your database schema and the relationships between the online or offline tables. You can also transform database tables to UML classes and interfaces and vice-versa using the transformation features. For more information on database transformation see Chapter 5, "How to Transform UML and Offline Databases".
5.8.1 Working with the Database Modeling Features
With JDeveloper, you can model offline database objects as well as database objects from a live database connection. You can also create database objects such as tables and foreign key relationships right on your diagram and integrate them with an online or offline database. Offline objects appear in the projects accordion under the offline database heading, and online objects appear under the database connection in the application resources accordion > database connection, in the databases window
Use database diagrams to view your structure of database objects and relationships, as well as create directly on your diagram components such as tables and foreign key relationships, views and join objects, materialized views, synonyms and sequences.
All of the database objects from online or offline databases, as well as the new objects you create are displayed in the Applications window.
5.8.1.1 How to Create a Database Diagram
Create your database diagram using the New Gallery. See Section 5.3.1.1, "How to Create a New Diagram.".
Once your database diagram is created, you can choose from the components in the Components window, as shown in Figure 5-36.
5.8.1.2 How to Create an Offline Database Object
Create an offline database object on the diagram by clicking on the icon on the Database Objects Components window, and then clicking on the diagram where you want to create the object. This process doesn't create new objects, but adds existing objects to a database diagram.
You can also drag objects from a database connection in the Databases window, or from an offline schema in the Applications window, onto a diagram.
5.8.1.3 How to Create a Foreign Key
Foreign keys can be created by clicking Foreign Key on the Database Components window, then clicking the table you want to originate the foreign key, and then clicking the destination table for the foreign key. The Create Foreign Key dialog allows you to select an existing column in the target table, or create a new column.
5.8.1.4 How to Create Join Objects
You can create join objects between two table usages in a view by clicking Join Objects, then clicking on the two table usages to be joined. The Edit Join dialog allows you to specify the join.
5.8.1.5 How to Create and Add Materialized Views
All templates are defined in the Offline Database Properties dialog.If the object being created has a template defined in the offline database in which it is being created, then using the <ObjectType> component creates objects based on its template.So, for example if the offline database 'Database1' has a Template table 'MyTab' , when you create a new table in Database1 using the table option in the Component window, the new table created is based on Template 'MyTab'. The existing objects from the offline database are added to the diagram.
5.8.1.6 How to Add and Create Private and Public Synonyms
Synonyms are created on a diagram by clicking Synonym on the Database Components window, and then clicking on the diagram where you want to create the synonym. You can also drag drop objects from online database connection, and import objects from the database connection to the offline database by adding the existing objects from database connection to the diagram.
Public synonyms are created in the PUBLIC schema.
5.8.1.7 How to Define a Base Relation Usage
Define a base relation for a view by clicking on Relation Usage on the Database Components window, and then clicking on the view.
5.8.1.8 How to Add and Create a Sequence
Sequences are created on a diagram by clicking on Sequence)on the Database Components window for the diagram, and then clicking on the diagram where you want to create the sequence. You can also drag sequences from a database connection, or from an offline database in the Applications window, and drop them on the diagram. You can also drag tables from an online database connection, or import objects from the database connection to offline database by adding existing objects from database connection to the diagram.
5.8.1.9 How to Create a Sequence Based on a Template
Sequences based on templates are created on a diagram by clicking on (Sequence from Template) on the Database Components window for the diagram, and then clicking on the diagram where you want to create the sequence. You can also create a sequence by drag dropping from the online database connection, or objects can be imported from a database connection to offline database by just add the existing objects from database connection to the diagram.Similarly, existing objects from offline DB can be added to the diagram.The Choose Template Object dialog is displayed, which allows you to choose the template you want to base the materialized view on.
5.8.1.10 How to Create a Synonym Based on a Template
Synonyms based on templates are created on a diagram by clicking on (Synonym from template) on the Database Components window for the diagram, and then clicking on the diagram where you want to create the synonym. The Choose Template Object dialog is displayed, which allows you to choose the template you want to base the materialized view on. You can also create a a synonym by drag dropping from the online database connection, or objects can be imported from a database connection to offline database by just add the existing objects from database connection to the diagram.
5.8.1.11 How to Add and Create Tables
Tables are created on a diagram by clicking on Table on the Database Components window, and then clicking on the diagram. You can also drag tables from a database connection, or from an offline database in the Applications window, and drop them on the diagram. Similarly, existing objects from offline DB can be added to the diagram the same way.
You can choose to view table column icons on a modeled table which indicates which columns are primary keys, or foreign keys, or unique keys.
The first column in the modeled table indicates whether the column is in a primary, unique, or foreign key:
-
Column is in a primary key
-
Column is in a foreign key
-
Column is in a unique key
The second column indicates whether the table column is mandatory.
Note:
If a table column is in a primary key it will only display the primary key icon even though it may also be in a unique key or foreign key.
5.8.1.12 How to Create Database Tables from Templates
Tables are created on a diagram by clicking on Table from template on the Database Components window, and then clicking on the diagram. The Choose Template Object dialog is displayed, which allows you to choose the template to base the materialized view on. You can also create a table by drag dropping from the online database connection. Objects can be imported from a database connection to offline database by adding the existing objects from database connection to the diagram.
5.8.1.13 How to Create Database Views and Add Database Objects
Views are created on a diagram by clicking on View, and then clicking on the diagram. Views can also be created by drag dropping objects from online database connection. Objects can also be imported from database connection to offline database by adding existing objects from the database connection to the diagram.You can also create a a database view by drag dropping from the online database connection, or objects can be imported from a database connection to offline database by just add the existing objects from database connection to the diagram.
Define the view by adding tables and views, or table columns or elements of other views to the newly defined view. You can also drag views from a database connection, or from an offline database in the applications window, and drop them on the diagram.
5.8.1.14 How to Create Database Views from Templates
Views are created on a diagram by clicking on View from template, and then clicking on the diagram. The Choose Template Object dialog is displayed to choose the template you want to base the materialized view on.
5.8.1.15 How to Change the Database or Schema
-
On the database diagram, right-click and choose Create Database Objects In > Database or Schema.
-
Complete the Specify Location dialog or Select Offline Schema dialog.
Note:
All subsequent database objects will be created in the database or schema you have chosen. Existing objects are unchanged.
5.9 Modeling with Activity Diagrams
Use activity diagrams to model your business processes. Your business process are coordinated tasks that achieve your business goals such as order processing, shipping, checkout and payment processing flows.
Activity diagrams capture the behavior of a system, showing the coordinated execution of actions, as shown in Figure 5-37.
5.9.1 Working with the Activity Diagram Features
The Components window contains the elements available for your activity diagram. An Activity is the only element that you can place directly on the diagram. You can place the other elements inside an Activity. Each of the elements is represented by unique icons as well as descriptive labels, as shown in Figure 5-38 and Table 5-7.
Table 5-7 Activity Diagram Elements
| Element | Description |
|---|---|
|
Action |
An action is the fundamental unit of behavior specification, for example, Send Invoice or Receive Payment. It represents a single step within an activity. An action takes a set of inputs and converts them into a set of outputs. The execution of an action represents some transformation or processing in the modeled system. An action may receive inputs in the form of control flows and object flows (the latter via input pins) and passes the results of its processing or transformations to outgoing control flows or object flows (the latter via output pins) and onto downstream nodes. Execution of the action cannot begin until all its prerequisites are satisfied. |
|
Activity |
A behavior performed by a system, for example a business process. An activity is a behavior defined by its owned actions, object nodes and the flows between them. |
|
Activity Final Node |
Terminates the execution of the activity when it first receives a control token. There can be multiple final nodes in an activity. An Activity Final Node indicates that every action on this diagram has finished. |
|
Fork/Join |
Displayed as a vertical or horizontal bar. A Fork is a control node that has a single incoming flow and two or more outgoing flows. A Join is a control node that synchronizes a number of incoming flows into a single outgoing flow. Fork/Join pairs can be combined as a single diagram node. |
|
Call Behavior Action |
Maps the action inputs and outputs are simply mapped to the behavior parameters as appropriate. |
|
Call Operation Action |
Transmits an operation call request to the target object, where it may cause the invocation of associated behavior. The behavior results become the action outputs. The argument values of the action are available to the execution of the invoked behavior. |
|
Central Buffer |
A type of object node. It gives the node the capability of storing (buffering) tokens. It manages the tokens that arrive at incoming flows from one or more object nodes and selects which tokens and in what order these tokens will be presented to the downstream object nodes via the outgoing flows. |
|
Control Flow |
Shows the flow of control tokens. |
|
Data Store |
A type of object node that passes a buffer for non-transient data. |
|
Flow Final Node |
Terminates any incoming flow without terminating the execution of the entire activity. |
|
Initial Node |
The starting point for executing an activity. It has no incoming flows and one or more outgoing flows. There can be only one initial state on a diagram. |
|
Object Flow |
Connects object nodes. Object flows can be connected to actions using pins. |
|
Merge Node |
A merge node has two or more incoming flows and a single outgoing flow. A Decision has one incoming flow and two or more outgoing flows |
5.9.1.1 How to Create an Activity Diagram
use the New Gallery wizard to create your activity diagram following the steps in Chapter 5, "How to Create a New Diagram".
5.9.1.2 How to Create Initial and Final Nodes
To create nodes, click the Initial Node icon, the Activity Final Node icon, or Final Flow Node icon in the Component window, then click on the diagram where you want to place the node.
5.9.1.3 How to Show Partitions
You create partitions on a diagram by selecting an action, then selecting Show Activity Partition under Display Options in the Properties window.
To show a partition on an activity diagram:
-
In the activity diagram, select an action.
-
In the Properties window, expand the Display Options node.
-
Select Show Activity Partition. The action on the diagram displays the text, (No Partition).
-
Click on the text. An editing box appears where you can enter a name for the partition.
5.10 Modeling with Sequence Diagrams
The sequence diagram describes the interactions among class instances. These interactions are modeled as exchanges of messages. At the core of a sequence diagram are class instances and the messages exchanged between them to show a behavior pattern, as shown in Figure 5-39.
5.10.1 Working with the Sequence Diagram Features
The elements you add from the Components window are laid out in a default position on your sequence diagram. Object lifelines are aligned vertically, unless they are related to another object lifeline, in which case they are aligned with the create message. Synchronous and asynchronous messages and are placed in time order down the page.
Figure 5-40 displays the elements in the Components window available to use in your sequence diagram. Each element is represented by a unique icon as well as a descriptive label.
Table 5-8 Sequence Diagram Elements
| Element | Description |
|---|---|
|
Asynchronous Message |
Represented on a diagram by a diagonal line with an open arrowhead. An asynchronous message is one for which the sender does not have to wait for a response before continuing with processing. |
|
Creation Message |
Represented on a diagram by the shifting down, relative to the originating object, of the rectangle and dashed line that represents the object to be created. A creation message is a message that leads to the creation of an object |
|
Interaction |
Captures the behavior of a single case by showing the interaction of the objects in the system to accomplish the task. |
|
Message |
A message is a model element that defines a specific kind of communication between participants in an interaction. A message conveys information from one participant, which is represented by a lifeline, to another participant in an interaction. |
|
Object Lifeline |
Represented on a diagram by a rectangular box with a vertical dashed line descending beneath it. An object lifeline represents the existence of an object over a period of time |
|
Return |
A return message is a message that returns from an object to which a message was previously sent. Return messages are valid only from synchronous messages, and are themselves synchronous. |
|
Stop or Destroy Message |
Represented on a diagram by showing the execution specification at the end of the message with a large cross through it. A stop message is a message that leads to the deletion of an object (or to the indication that an object is no longer needed). |
5.10.1.1 How to Add and Create a Sequence Diagram
use the New Gallery wizard to create your activity diagram following the steps in Chapter 5, "How to Create a New Diagram".
5.10.1.2 How to Start a Sequence Tracer
On any part of the sequence diagram, open the context menu and choose Trace Sequence. The tracer steps through each of the execution specifications and messages, highlighting each one.
Note:
Trace Sequence is available for a selected Interaction. It does not appear in the context menu for the diagram.
5.10.1.3 How to Autolay Elements in an Interaction
Model your interactions within a system by adding the Interaction component to your diagram. Interactions are a container for the specific elements that comprise the behavior.
You can right-click an Interaction and choose Sequence, then Automatic Layout to autolayout the elements within the Interaction.
5.10.1.4 How to Add Lifelines and Classifiers
You add object lifelines to a sequence diagram by first adding an interaction then clicking on the Object Lifeline icon, and then clicking on the interaction. An edit box opens for you to enter an instance name for the object. This can be left blank for anonymous instances.
You can add a classifier by right-clicking on the object lifeline and choosing Attach Classifier, which opens a list of elements from which you choose the one you want associated with the object lifeline. Another way to attach a classifier is to drag the classifying object from the databases window onto the object lifeline. These methods are confirmed by the appearance (in the top left of the object lifeline) of an icon representing the classifying element.
5.10.1.5 How to Work with Synchronous Messages
You add a synchronous message by clicking on the Message icon, then clicking on the vertical dashed line or execution specification that is the starting point for the message, and then on the vertical dashed line that is the destination of the message.
Merge execution specifications by overlapping them on the diagram. Then right-click and choose Merge Overlapping Occurrences.
You can move an execution specification (and the messages attached to it) to a position higher or lower than its original one. In some cases this will result in an invalid diagram. When this happens, the message line will turn red and the destination object will contain an arrow icon which indicates the direction the object should be moved, to make the diagram valid.
To resize an execution specification box, drag the small black box that appears on the lower edge when you select it. An execution specification will be resized if you drag a message line extending from it.
Open an editing box for the text by clicking on the message line and then clicking inside the gray box that appears.
The starting point and destination point of a synchronous message can be the same object lifeline, in which case you have created a self call.
Synchronous messages are depicted on the sequence diagram by solid lines with filled arrowheads.
5.10.1.6 How to Add a Creation Message
Add a creation message by clicking on the Creation Message icon, then on the originating object, then on the object to create. The rectangle and dashed line that represents the object is shifted down the page relative to the originating object.
If the object to be created is not already on the diagram, click within the interaction that contains the originating object to create an object lifeline representing the object. By default, a creation message is given the name "create". You can open an edit box for the message name by clicking on the message line and then clicking inside the gray box that appears.
5.10.1.7 How to Add a Stop or Destroy Message
Before you add a stop or destroy message, you must already have added an object lifeline for the object that the message deletes.
Add a stop or destroy message by clicking on the Stop or Destroy Message icon, then on the originating object, then on the object to delete. If you start and end the stop message on the same object, you will create a self-deleting object. The execution specification at the end of a stop message is shown with a large cross through it. You can open an edit box for the message name (for example, close) by clicking on the message line and then clicking inside the gray box that appears.
If you add a stop message earlier in the sequence than other execution specifications, those execution specifications will be not be implementable and will be shown with a warning flag.
5.10.1.8 How to Add a Return Message
Add a return message by clicking on the Return icon, then on an end execution specification, then on the corresponding start execution specification. You will not be able to end this return message line on any other object. The return message is depicted by a dashed line with a filled arrowhead. You can open an edit box for the text of the message by clicking on the message line and then clicking inside the gray box that appears.
5.10.1.9 How to Add an Asynchronous Message
Add an asynchronous message (and the execution specifications at each end) by clicking on the Async Message icon, then clicking on the vertical dashed line or execution specification that is the starting point for the message, then on the vertical dashed line that is the destination of the message. You can open an edit box for the text of the message by clicking on the message line and then clicking inside the gray box that appears.
The starting point and destination point of an asynchronous message can be the same object lifeline, in which case you have created a self call.
Asynchronous messages are depicted on the sequence diagram using diagonal lines and open arrowheads.
5.10.1.10 How to Work with Sequence Diagram Combined Fragment Locks
On your sequence diagram interactions you will see combined fragment lock icons. Locking and unlocking an interaction allows you to keep the combined fragment behavior within that interaction on that diagram, or extend its reach to other interactions and other diagrams.
5.10.1.11 Using Combined Fragments
A combined fragment defines an expression of an interaction defined by an interaction operator and corresponding interaction operands. A Combined Fragment reflects a piece or pieces of interaction (called interaction operands) controlled by an interaction operator, whose corresponding boolean conditions are known as interaction constraints. It displays as a transparent window, divided by horizontal dashed lines for each operand.
Figure 5-41 shows a loop fragment that iterates through purchase items, after the cashier requests payment. At this point, two payment options are considered and an alternative fragment is created, divided to show the two operands: cash and credit card. After the fragment completes its trace, the cashier gives a receipt to the customer, under the fulfilled condition of payment requirements met.
Figure 5-42 shows the combined fragments that display in the Components window when your diagram is open in the diagramming window.
Table 5-9 Combined Fragments Interaction Operators
| Interaction Operator | Description |
|---|---|
|
alt |
Use to divide up interaction fragments based on Boolean conditions. |
|
assert |
Use to specify the only valid fragment to occur. |
|
Break |
Use to designate that the combined fragment represents a breaking scenario in the sense that the operand is a scenario that is performed instead of the remainder of the enclosing interaction fragment. |
|
Critical |
Use to indicate a sequence that cannot be interrupted by other processing. |
|
Loop |
Use to indicate that the operand repeats a number of times, as specified by interaction constraints. |
|
Neg |
Use to assert that a fragment is invalid, and implies that all other interaction is valid. |
|
Opt |
Use to enclose an optional fragment of interaction. |
|
Par |
Indicate that operands operate in parallel. |
|
Seq |
Use to indicate that the combined fragment is weakly sequenced. This means that the ordering within operands is maintained, but the ordering between operands is undefined, so long as an occurrence specification of the first operand precedes that of the second operand, if the occurrence specifications are on the same lifeline. |
|
Strict |
Use to indicate that the behaviors of the operands must be processed in strict sequence. |
5.11 Modeling with Use Case Diagrams
Use case diagrams overview the usage requirements for a system. For development purposes, use case diagrams describe the essentials of the actual requirements or workflow of a system or project, as shown in Figure 5-43.
5.11.1 Working with the Use Case Diagram Features
Use case diagrams show how the actors interact with the system by connecting actors with their actions. If an actor supplies information, initiates the use case, or receives information as a result of the use case, then there is an association between them.
Figure 5-44 displays the Components window with the elements available to add to your use case diagram. Each element is represented by a unique icon and descriptive label.
An Interaction is the only element you can add directly to the diagram. You put all of the other elements within an Interaction.
| Component | Description |
|---|---|
|
Actor |
Represents an abstract role within a system. |
|
Communication |
Identifies where an actor is associated with a particular use case. |
|
Dependency |
Shows a relationship between one element and another. |
|
Extend |
Shows a target use case extends the definition of a source use case. |
|
Generalization |
Identifies where one or more elements specialize another element. For example, an actor Team Member could be specialized to actors Manager and Developer. |
|
Include |
Shows a relationship in a use case that includes another use case. |
|
Subject |
Two types of subjects are available. One system usually contains sets of use cases and actors that comprise the whole system being modeled. The second type usually contains groups of use cases that comprise a coherent part of the system being developed. |
|
Use Case |
Indicates that one element requires another to perform some interaction. |
5.11.1.1 Getting A Closer Look at the Use Case Diagram Elements
You can determine the appearance and other attributes for subject, actor and other objects of these types by modifying the properties in the Properties window, or by right-clicking the object and modifying the properties, or by creating and customizing an underlying template file.
You can use templates to add the supporting objects to the Components window. For more information, see Chapter 5, "How to Create Use Case Components Templates".
5.11.1.2 How to Add a Subject to a Use Case Diagram
You can show the system being modeled by enclosing all its actors and use cases within a subject. Show development pieces by enclosing groups of use cases within subject lines. Add a subject to a diagram by clicking on Subject in the Components window, then drag the pointer to cover the area that you want the subject to occupy. Figure 5-45 shows an accounting subject attached to their related actors. If you drop an element just inside a subject, the subject line expands to enclose the element. You also can manually resize subjects. If you reduce the size and there are elements that can no longer be seen, an ellipsis appears in the lower right corner.
5.11.1.3 How to Create Actors and Use Cases
Create actors on a diagram by clicking on the Actor icon on the Components window, and then clicking on the diagram where you want to create it.
To change the properties of an actor or use case, double-click on the modeled element and edit the element details in the editor.
5.11.1.4 How to Represent Interactions Between Actors and Use Cases
You can represent interactions between actors and use cases on a diagram using the Communication icon on the Components window. You can create generalization structures between actors and between use cases by using the Generalization icon. To represent where one use case includes another, use the Include icon, and to represent where one use case extends another use the Extension icon.
You can annotate a diagram of use cases using notes, dependency relationships and URL links. Annotation components are available at the lower part of the Components window under Diagram Annotations.
5.11.1.5 How to Represent Relationships Between Use Cases and Subjects
You can represent interactions between use cases and subjects using the Communication icon on the Components window.
5.11.1.6 How to Edit the Use Case Template Source Code
Select the Source tab. To insert HTML tags at specific locations, open the context menu and choose Insert HTML.
As a general rule, do not remove tags that include the uml: prefix (for example <uml:usecase_extends>). If you are removing an entire section of the template (for example, between a td tag and a /td tag), any uml: prefixes can be safely removed along with the other content of the section.
5.11.1.7 How to Change the Appearance of Text on the Use Case Template
Select the Editor tab and the text that you want to change, then choose one or more of the formatting options from the toolbar.
5.11.1.8 How to Insert HTML Interface Objects, Code Objects, and Development Inputs
Select the Editor tab, select the place in the template where you want to make the insertion, then choose the required location and object from the context menu.
You can insert HTML interface objects (such as buttons and checkboxes), HTML code objects (such as anchors and tables), and development inputs (such as comments and processing instructions).
You are initially given the choice of inserting an object before a selected template item or after it, or into the <head> section of the template. Subsequently, these options are unavailable if inappropriate. If you choose HTML or Browse from the context menu, a dialog box is opened from which you can choose one of various HTML interface objects and code objects. Choosing an item here will open an insertion dialog to enter properties appropriate to the object.
5.11.1.9 How to Create Use Case Components Templates
New use case templates can be created by copying the one included in JDeveloper. You can modify the copies as needed.
For each new Components window there must be one use case template that supports it. The use case template that you specify is not copied or moved: it remains in its original location.
To create a new Components page and add a new use case component:
-
Go to Tools > Configure Palette.
-
In the Configure Components dialog, select use case for Page Type.
-
Click Add.
-
Enter a name for the new Components page.
-
From the drop-down list, choose Use Case, then click OK. The new page appears in the Components window. The Pointer item is included automatically.
-
Open the context menu for the component area of the Components window and select Add Component. The Add Use Case Template dialog opens.
-
Enter a name for the new component.
-
Enter the path to the use case template on which the new component is to be based. The path can be a URL.
-
To add the new component to the Component Page, click OK.
5.12 Storing UML Elements Locally
UML elements are stored in individual files. Their location is dependent on the package property of the element. These element files hold the properties defined against the various elements, but the diagram file still defines which elements are displayed on the diagram and the visual properties of those elements. Element files for modeled UML elements are stored in the appropriate package folder under the folder specified in the project model path. To set the model path, choose Application > Default Project Properties > Project Source Paths > Modelers.
