3 Using the Built-in Diagnostic System Modules
This chapter describes the built-in diagnostic system modules, which are provided by the WebLogic Diagnostics Framework (WLDF) as a simple and easy-to-use mechanism for performing basic health and performance monitoring of a WebLogic Server instance.
This chapter includes the following sections:
-
Accessing Data Collected by a Built-in Diagnostic System Module
-
Creating a Custom Diagnostic System Module Based on a Built-in
Overview
The WLDF built-in diagnostic modules collect data from key WebLogic Server run-time MBeans that monitor the main components of a server instance, such as the following, and store it in the Archive:
-
JVM
-
WebLogic Server run time
-
JDBC, JMS, transaction, and logging services
-
Java EE containers hosting servlets, EJBs, and Connector Architecture resource adapters
When configured in a WebLogic Server instance, the built-in diagnostic modules are particularly useful for providing a low-overhead, historical record of server performance. As server workload changes over time, or the performance characteristics change as a result of updates made to the server's configuration, you can examine the data collected by the built-ins to obtain details about performance changes. For example, if you notice a slowdown in the response time of one or more deployed applications, you can use the Monitoring Dashboard or the Metrics Log table in the Administration Console to examine the data collected by the built-ins for performance bottlenecks associated with one or more WebLogic Server subsystems. Then using other diagnostic tools, such as custom diagnostic modules, watches and notifications, or Java Flight Recorder, you can drill down further into details about those bottlenecks to pinpoint specific causes and test the effectiveness of solutions.
In WebLogic domains configured to run in production mode, a built-in diagnostic module is enabled by default in each server instance. (In domains configured to run in development mode, built-ins are disabled by default.) However, a built-in diagnostic module can be enabled or disabled for a server instance easily and dynamically, using either the WebLogic Server Administration Console or WLST.
Data collected by the built-in diagnostic modules can be accessed easily, using tools such as the Metrics Log table in the Administration Console or the Monitoring Dashboard. The data can also be accessed programmatically using JMX or WLST.
Types of Built-in Diagnostic System Modules
WLDF provides three built-in diagnostic system module types:
-
Low— Captures the most important data from key WebLogic Server run-time MBeans (enabled by default in production mode). -
Medium— Captures additional attributes from the WebLogic Server run-time MBeans captured byLow, and also includes data from additional run-time MBeans. -
High— Captures the most verbose data from attributes on the WebLogic Server run-time MBeans captured byMedium, and also includes data from a larger number of run-time MBeans.
The built-in diagnostic system module type configured for a server instance is specified in the WLDFServerDiagnosticMBean.WLDFBuiltinSystemResourceType=string MBean attribute, where string can be set to one of Low, Medium, High, or None.
Data Collected by Built-in Diagnostic System Modules
When you enable a built-in diagnostic module in a WebLogic Server instance, WLDF begins collecting data from key WebLogic Server run-time MBeans to obtain information, such as the following:
| Data Category | Example of Information Collected |
|---|---|
| JVM statistics | Amount of available free memory and JVM processor load on host machine. |
| Thread statistics | Threads being held by a request and the number of pending user requests. |
| JDBC subsystem statistics | Examples of information collected may include:
|
| JMS subsystem statistics | Examples of information collected may include statistics about:
|
| Logging subsystem statistics | The number of log messages that the WebLogic Server instance has generated. |
| JTA subsystem | Examples of information collected may include:
|
| Java EE container statistics | Examples of information collected may include statistics about:
|
Note:
The specific configuration of each built-in diagnostic module is internal to WebLogic Server and subject to change in a future release.Configuring a Built-in Diagnostic Module
You can configure a built-in diagnostic module for a WebLogic Server instance quickly and easily using either the WebLogic Server Administration Console or WLST. For example, using the Administration Console, you can perform the following steps:
-
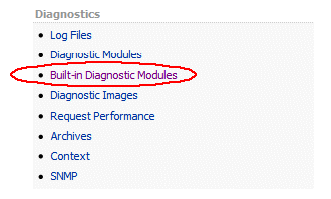
Select Built-in Diagnostic Modules in the Diagnostics area of the Administration Console home page.

Description of the illustration built-in-modules.gif
-
In the Summary of Built-in Diagnostic Modules page, select the server instance for which you want to configure a built-in diagnostics module.
-
In the Settings for server-name page, select the built-in diagnostics module type you want to configure:
Low,Medium, orHigh.
Description of the illustration medium-builtin.gif
By default, once you select a built-in diagnostics module for a server instance, it is automatically activated and begins collecting the data in the Archive. From the Summary of Built-in Diagnostic Modules page, you can later deactivate the built-in module if desired by setting it to None.
Note:
Although WebLogic Server allows you to target multiple diagnostic system modules to a server instance, only one built-in diagnostic module type may be activated at any time.For more information about configuring built-in system diagnostic modules in the Administration Console, see the following topics in the Oracle WebLogic Server Administration Console Online Help.
-
"Configure a built-in diagnostic system module"
-
"Select a built-in diagnostics system module"
-
"Disable a built-in diagnostic system module"
Accessing Data Collected by a Built-in Diagnostic System Module
The following sections describe the different ways you can access the data collected by a built-in diagnostic system module:
Using the Monitoring Dashboard
The Monitoring Dashboard is a good choice for viewing the data collected by the built-in diagnostic system modules. The Metric Browser simplifies selecting the specific MBean attributes you want to graph, and the tools available for customizing views and drilling down on data of interest are easy to use.
The Monitoring Dashboard does not provide a means to select the data collected by a particular diagnostic system module, including any of the built-ins. However, for a given server instance, you can easily select the run-time MBean instance and corresponding metrics you want to display. See Chapter 16, "Using the Monitoring Dashboard," for complete details about the Monitoring Dashboard.
To view data collected by a built-in module:
-
Launch the Monitoring Dashboard, which you can do from the WebLogic Server Administration Console or separately in a Web browser. For more information, see Running the Monitoring Dashboard.
-
In the Monitoring Dashboard, create a custom view, as described in "Create custom views" in the Oracle WebLogic Server Administration Console Online Help.
-
Navigate to the Metric Browser and select the following:
-
The server instance for which you want to display data collected by the built-in diagnostic system module.
-
The Collected Metrics Only button.
-
The MBean type and instance corresponding to the run-time MBean for which the data was collected.
-
-
Create a chart.
-
Open the Chart Properties dialog box, select Custom (only applies to collected metrics), and specify the time range during which the data you wish to view was collected.
-
In the Metric Browser, select the metrics you want to display.
Using the Metrics Log Table in the Administration Console
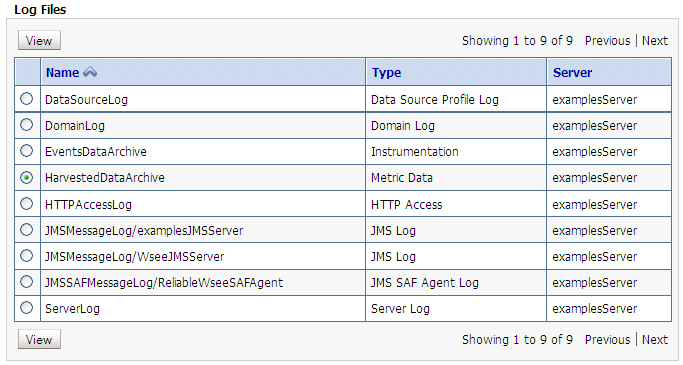
You can access data collected by the built-in diagnostic system modules in the Metrics Log table, which is displayed by selecting the log file name HarvestedDataArchive in the Summary of Log Files console page.

Description of the illustration log_file_list.gif
To display the metrics collected by a built-in diagnostic module in the Metrics Log table of the Administration Console, complete the following steps:
-
Select HarvestedDataArchive in the Summary of Log Files console page, and click View.
-
In the Metrics Log console page, click Customize this table.
-
To constrain the table to display only metrics collected by a built-in diagnostic module, enter a string in the WLDF Query Expression field that specifies that built-in, such as the following:
-
WLDFMODULE = 'wldf-server-low'— Specifies metrics collected by theLowbuilt-in diagnostic module. -
WLDFMODULE LIKE 'wldf-server-%'— Specifies metrics collected by any of the built-in diagnostic modules.
-
-
In the Available column display box, select WLDF Module, and click the right arrow to move it to the Chosen box.

Description of the illustration wldfmodule.gif
-
Click Apply.
If the Archive contains a large amount of data, you can filter the Metrics Log table further by adding expressions to the WLDF query string. For example:
-
(WLDFMODULE LIKE 'wldf-server-%') AND (NAME LIKE '%Name=examples-demo%')restricts the number of metrics displayed to harvested attributes with an instance name that includes the stringexamples-demo. -
(WLDFMODULE LIKE 'wldf-server-%') AND (TYPE LIKE '%ServletRuntime%')restricts the number of metrics displayed to harvested attributes of the ServletRuntimeMBean. -
(WLDFMODULE LIKE 'wldf-server-%') AND (TYPE LIKE '%JMSDestination%' AND ATTRNAME = 'MessagesCurrentCount')restricts the number of metrics displayed to harvested instances of theJMSDestinationRuntimeMBean.MessagesCurrentCountattribute.
For more information about WLDF query expressions, see Appendix A, "WLDF Query Language".
Creating a Custom Diagnostic System Module Based on a Built-in
To simplify the process of creating a diagnostic system module, you can use one of the built-in diagnostic system modules as a starting point and customize it to suit your requirements. From the Create a Diagnostics System Module page of the WebLogic Server Administration Console, you can select Use a built-in diagnostic system module as a template, and then select the particular built-in module upon which you want to base your new diagnostic module.

Description of the illustration clone-builtin.gif
After you select the particular built-in module you want to use as a template, and click OK, you can navigate to the Settings for module-name page and make the following customizations as appropriate:
-
The Collected Metrics tab displays the set of metrics configured for the particular built-in you are using as a template. By default, all the metrics configured in the built-in are enabled in your custom diagnostic module:
-
To delete a configured metric, select it and click Delete.
-
To add a metric not configured with the built-in used as a template, click New, and use the Create a Metric assistant to specify the metric.
For more information about customizing the metrics configured for your diagnostic system module, see "Configure metric collection for a diagnostic system module" in Oracle WebLogic Server Administration Console Online Help.
-
-
The Watches and Notifications tab displays a set of watches and notifications that are configured but not actually enabled in the built-in module you are using for a template. The set of watches and notifications available represent those that cover typical server-level situations for which notifications are generally desirable when certain state criteria thresholds are met. You can delete, or add to the set of watches and notifications as appropriate. You may also update threshold values to suit your situations.
Note:
If you use one or more watches and notifications that are configured in the built-in module, you must make sure that they are enabled in your diagnostic system module. In the Watches and Notifications tab of the Administration Console, select Enabled then click Save.
For more information about targeting and activating diagnostic system modules, see Configuring Diagnostic System Modules.