16 Monitoring BPEL Process Service Components and Engines
This chapter includes the following sections:
-
Monitoring BPEL Process Service Engine Request and Thread Performance Statistics
-
Monitoring Deployed BPEL Process Service Components in the Service Engine
-
Viewing Statistics About the Time a Request Spends in the BPEL Process Service Engine
For conceptual information about service components and service engines, see the following sections:
Note:
You see any type of fault on the Flow Instances page (for example, fault policy faults, BPEL message recovery, rejected messages, EDN faults, and so on). All faults are part of the business flow instance details. For information, see Tracking Business Flow Instances at the SOA Infrastructure or Partition Level.
16.1 Monitoring the Flow Trace of a Business Flow Instance
This section describes how to monitor the flow trace of a business flow instance. The flow trace is a runtime trail of the message flow. A business flow instance corresponds to an end-to-end business transaction. Business flows consist of a single SOA composite application or multiple SOA composite applications connected together to fulfill a specific business process. The flow trace of a business flow instance is identified by a unique flow ID value that is displayed in the Search Results table of the Flow Instances page after you invoke a flow instance search.
Note:
This section assumes a business flow instance has been initiated. If not, see Initiating a Test Instance of a Business Flow for instructions.
To monitor the flow trace of a business flow instance:
Access the Flow Trace page through one of the following options:
-
To access business flow instances in all partitions:
From the SOA Infrastructure Menu... From the SOA Folder in the Navigator... -
Select Home.
-
Select the Flow Instances tab.
-
Click the Search icon to populate the Search Results table with business flow IDs.
-
In the Flow ID column, click a specific business flow instance number.
-
Expand SOA folder.
-
Right-click soa-infra.
-
Select Home > Flow Instances.
-
Click the Search icon to populate the Search Results table with business flow IDs.
-
In the Flow ID column, click a specific business flow instance number.
-
-
To access business flow instances in an individual partition:
From the SOA Infrastructure Menu... From the SOA Folder in the Navigator... -
Select Manage Partitions.
-
In the SOA Partitions column, click a specific partition.
-
Click the Flow Instances tab.
-
Click the Search icon to populate the Search Results table with business flow IDs.
-
In the Flow ID column, click a specific business flow instance number.
-
Expand SOA > soa-infra.
-
Click a specific partition.
-
Click the Flow Instances tab.
-
Click the Search icon to populate the Search Results table with business flow IDs.
-
In the Flow ID column, click a specific business flow instance number.
-
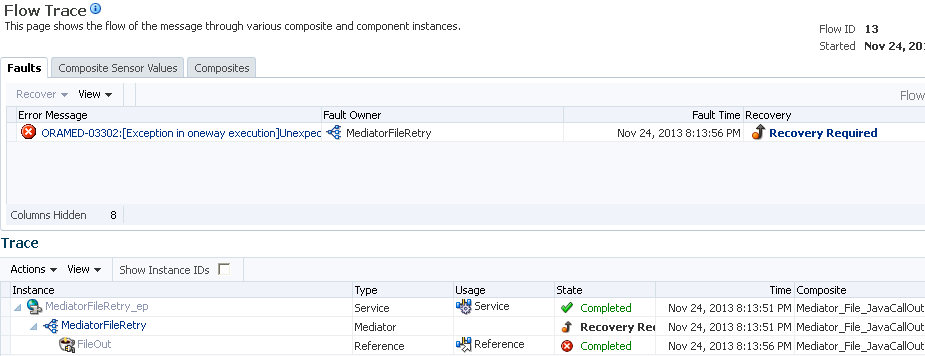
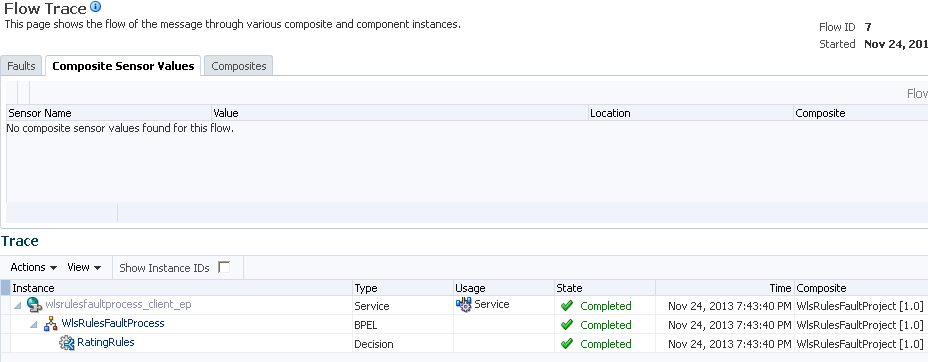
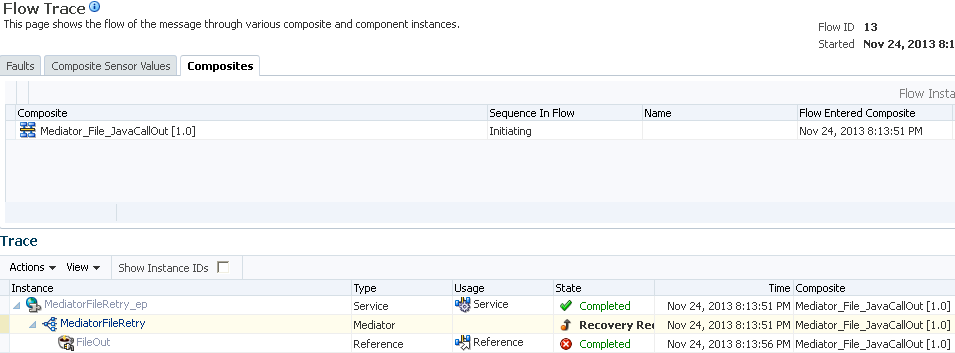
The Flow Trace page consists of two sections. Depending on which tab is selected, the top section shows the Faults, Composite Sensor Values, Composites, or Resequencer (if an Oracle Mediator resequencer is included in the composite) tabs of the selected flow trace. The bottom section shows the business flow trace.
The Faults tab of the Flow Trace page displays the following details:
-
A Faults table that displays the error message, component that handled the fault, time of the fault, and recovery status (for example, unrecoverable, recovery required, and so on). To display additional columns in the table, select View > Columns. If you change the columns in the Flow Instances page, they are also changed in the Faults table of the Flow Trace page.
-
A Trace table that displays the sequence of the message flow through the services, service components, and references that comprise SOA composite applications. Regardless of the tab that you select on the Flow Trace page (Faults, Composite Sensor Values, Composites or Resequencer (if an Oracle Mediator resequencer is included in the composite), the Trace section is always displayed. To display additional columns in the table, select View > Columns. To view the flow trace in XML format, select the Actions list.
If the Audit Level is set to Off, trace details are not captured and the trace table is not displayed. However, instance details for some components are captured. For those components, a flat list of instance details is displayed. This list only has instance details for some components and may not have all components that participated in the flow.
Midprocess receive activities that are triggered by events are displayed in the flow trace. Midprocess receive activities can co-relate multiple flow IDs. The flow trace on the correlating BPEL node can display all the flow IDs that are correlated by that node.
You can perform the following flow trace management tasks:
16.1.1 Recovering from Faults in the Flow Trace
You can perform fault recovery from the Faults tab of the Flow Trace page. The fault recovery tasks that you perform are the same as those performed from the Faults tab of the Flow Instances page of the SOA Infrastructure or individual partition.
The Faults section shows the faults occurring in the services, service components, and references of the SOA composite application displayed in the Trace section. Selecting a fault highlights one or more rows in the Trace section in which the fault occurred (because multiple rows can correspond to the same fault if they are in the same fault chain). For example, a recoverable fault on a BPEL component can cause failed instances of other components and endpoints downstream. Selecting that BPEL process fault in the Faults table highlights all impacted Trace section nodes.
To recover from faults in the flow trace:
16.1.2 Viewing Composite Sensor Values in the Flow Trace
You can view details about composite sensors included in the flow trace of the business flow instance. Composite sensors provide a method for implementing trackable fields on messages. Composite sensors can be added to service and reference binding components and service components that have subscribed to business events during design time in Oracle JDeveloper.
To view composite sensor values in the flow trace:
16.1.3 Viewing the SOA Composite Application in the Flow Trace
You can view the initiating and participating SOA composite applications included in the flow trace of the business flow instance.
To view the SOA composite application in the flow trace:
16.1.4 Viewing the Audit Trail and Process Flow in the Flow Trace
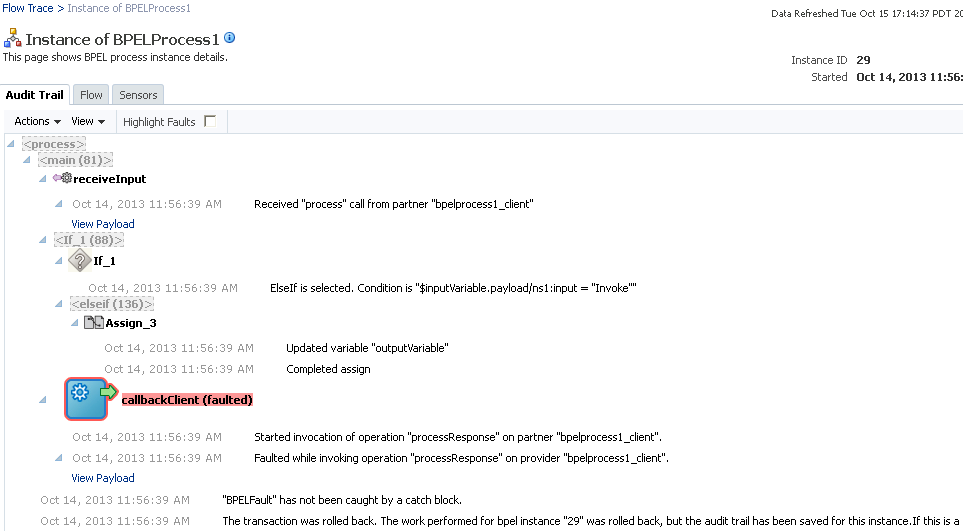
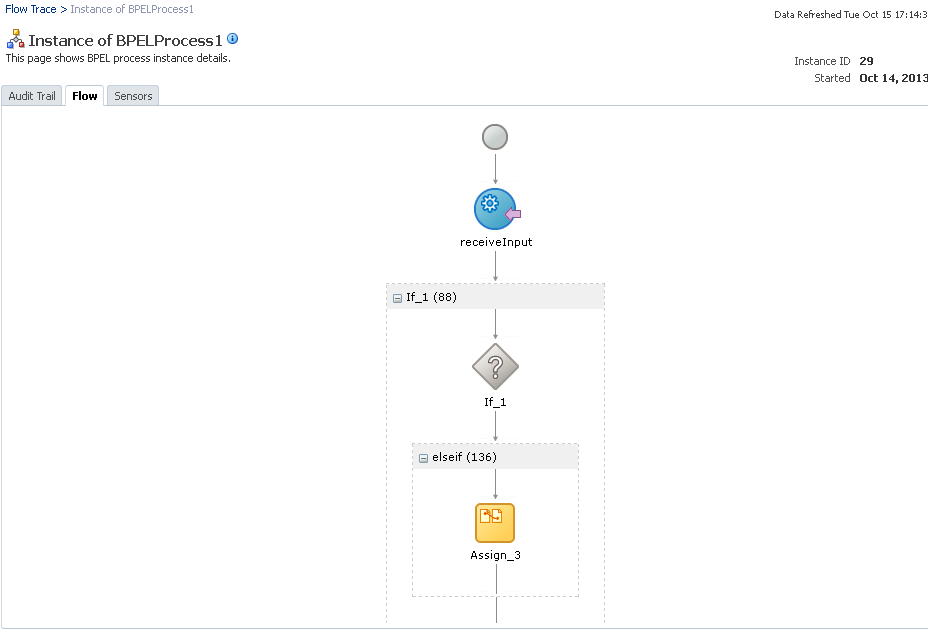
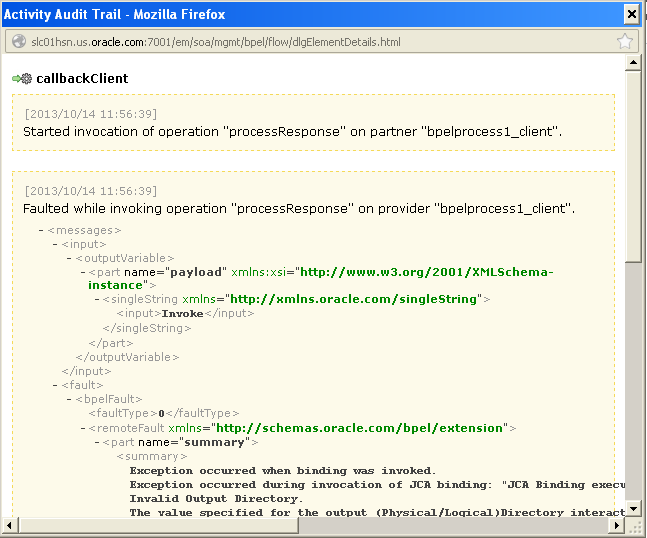
You can view the audit trail and process flow in the flow trace of the business flow instance. The audit trail and flow trace provide a graphical representation of the audit trail data. The audit trail displays execution details about the activities in the BPEL process. The process flow displays the flow of the payload through the process.
To view the audit trail and process flow in the flow trace:
16.1.5 Monitoring Fault, Activity, and Variable Sensors in the Flow Trace
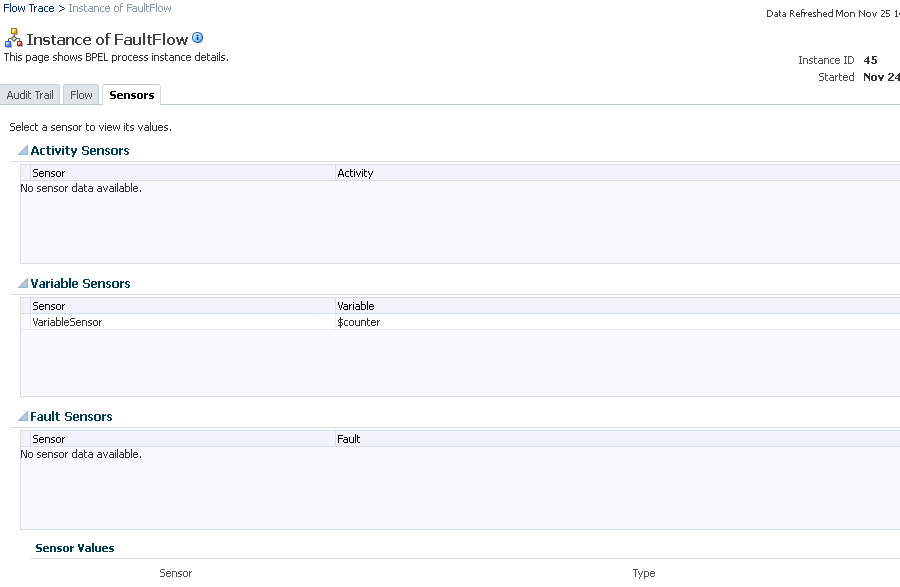
You can view the fault, activity, and variable sensor data in a BPEL process service component. You design sensors in BPEL processes in Oracle JDeveloper. Sensors enable you to monitor BPEL process activities, variables, and faults during runtime.
To monitor fault, activity, and variable sensor data in BPEL processes:
16.1.6 Understanding Additional Flow Trace Behavior Scenarios
This section describes additional flow trace behavior scenarios.
16.1.6.1 Behavior of Activity Sensors in Compensate and CompensateScope Activities in BPEL 2.0
Assume you have an activity sensor in a BPEL 2.0 compensateScope activity with the evaluation time set to completion and have also configured the activity's variable sensor to point to a variable. You may expect that when the sensor is triggered, the compensation activity completes and the variable shows the state that it is in at the completion of the compensation activities.
However, note that the compensateScope activity (and also a compensate activity) ends immediately after passing control to the compensation activities. As a result, the activity's variable sensor shows the state that it is in at the beginning of the compensation activities, rather than at the end.
This is the expected behavior.
As a workaround for obtaining the variable state upon completion of compensation, add an empty activity after the compensate or compensateScope activity and set the activity sensor on the empty activity with an evaluation time set to activation.
16.2 Monitoring the Time Distribution of BPEL Process Activities and Instance and Fault Throughput Metrics
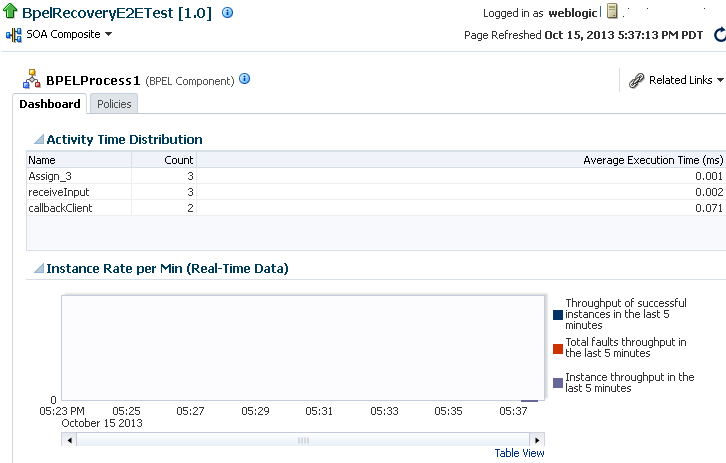
You can monitor the time distribution of BPEL process activities and a graphical view of instance and fault throughput metrics for the BPEL process service component.
To monitor the time distribution of BPEL process activities and instance and fault throughput metrics:
-
Access this page through one of the following options:
From the SOA Infrastructure Menu... From the SOA Folder in the Navigator... -
Select Home.
-
Select the Deployed Composites tab.
-
In the Composite section, select a specific SOA composite application.
-
Under soa-infra, expand the partition.
-
Select a specific SOA composite application.
The Dashboard page is displayed.
-
-
In the Components section, select the BPEL process service component.
The Dashboard page displays the following details:
-
Details about the time distribution for activities, including the activity name, the total number of activities for all instances, and the average execution time.
-
A graphical representation of the number of successful, faulted, and incoming (pending) instances of the BPEL process service component over a specific time range.
-
-
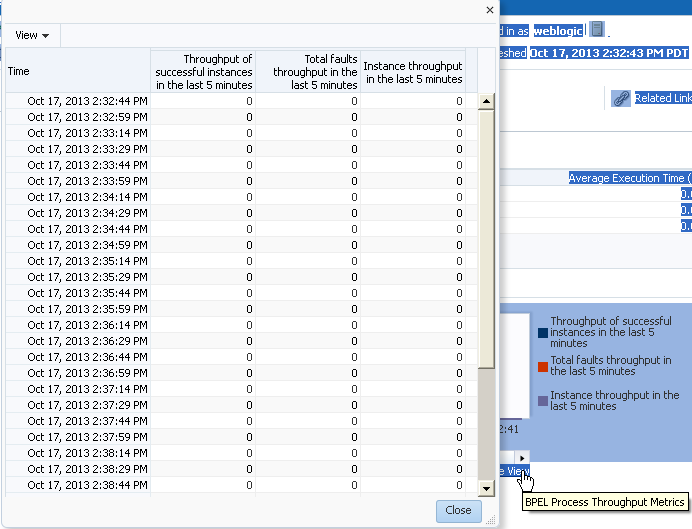
Click Table View to display throughput details for the last five minutes in tabular form, including the throughput for successful instances, the total faults throughput, and the instance throughput.
For more information, see Introduction to Business Flow Instances and Administering Oracle Fusion Middleware for details about viewing and searching log files.
16.3 Monitoring BPEL Process Service Engine Request and Thread Performance Statistics
You can monitor request and thread performance statistics for all BPEL process service components running in the service engine.
To monitor BPEL process service engine request and thread performance statistics:
-
Access this page through one of the following options:
From the SOA Infrastructure Menu... From the SOA Folder in the Navigator... -
Select Service Engines > BPEL.
-
Right-click soa-infra.
-
Select Service Engines > BPEL.
-
-
Click Statistics.
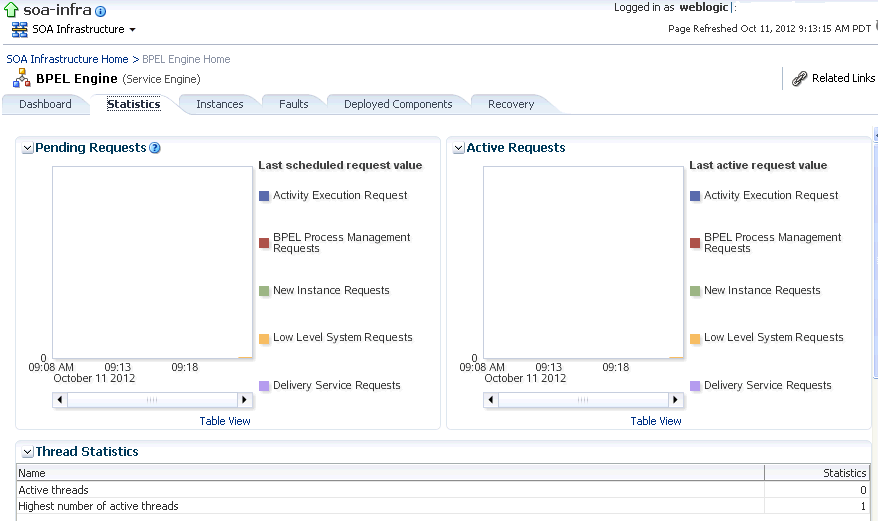
The Pending Requests and Active Requests sections of the Statistics page display the following details. Click the Help icon for additional information.
-
Pending requests in the service engine
-
Active requests in the service engine
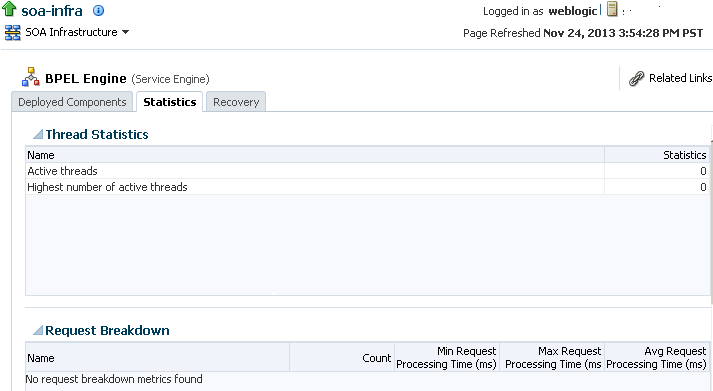
The Thread Statistics and Request Breakdown parts of the Statistics page display details about the number of active threads and the count and minimum, maximum, and average request processing times in the service engine.
For more information about BPEL process tuning and performance, see Tuning Performance.
-
16.3.1 Viewing Low Level Request Breakdown Table Details
You can configure the Request Breakdown part of the Statistics page to display lower level details about the time a request spends in various service engine layers during processing. You may need to scroll down the Statistics page to view this part.
Configure the StatsLastN property under the More BPEL Configuration Properties link on the BPEL Service Engine Properties page. By default, this property is set to -1. You can set this property to a more appropriate value (for example, 1000). This property provides information that helps you analyze and isolate areas that may become potential trouble spots.
For information about accessing and configuring this property, see Configuring BPEL Process Service Engine Properties.
The information that is displayed on the Request Breakdown part of the Statistics page after configuring the StatsLastN property is also displayed with the following System MBean Browser properties:
-
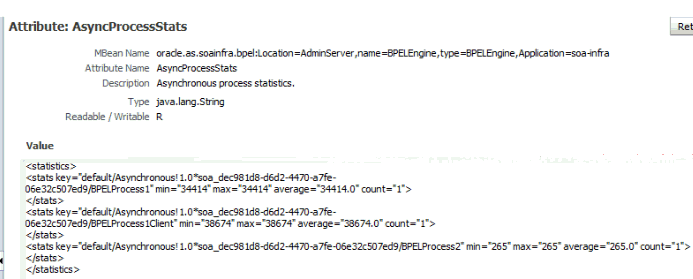
AsyncProcessStats: Provides low level asynchronous process statistics.
-
SyncProcessStats: Provides low level synchronous process statistics.
-
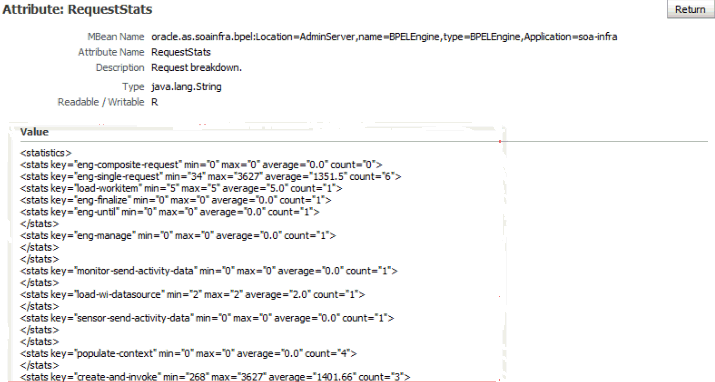
RequestStats: Provides a low level request breakdown.
For information about accessing these properties, see Viewing Statistics About the Time a Request Spends in the BPEL Process Service Engine.
16.4 Monitoring Deployed BPEL Process Service Components in the Service Engine
You can monitor all deployed SOA composite applications with BPEL process service components running in the service engine.
To monitor deployed BPEL processes in service engines:
-
Access this page through one of the following options:
From the SOA Infrastructure Menu... From the SOA Folder in the Navigator... -
Select Service Engines > BPEL.
-
Right-click soa-infra.
-
Select Service Engines > BPEL.
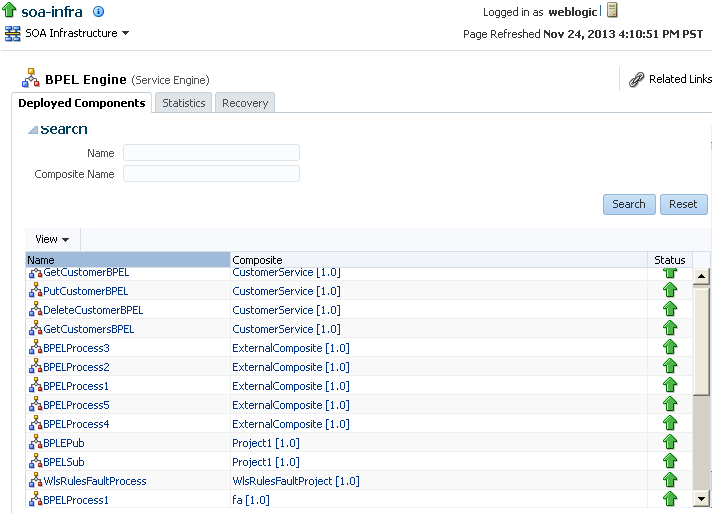
The Deployed Components page displays the following details:
-
A utility for searching for a specific deployed SOA composite application by specifying criteria and clicking Search. This search is case sensitive. You must enter the exact name of the component and the exact name of the composite, without the revision portion. To view an unfiltered list of all components after searching, click Reset.
-
Details about deployed SOA composite applications with BPEL process service components running in this service engine, including the service component name, the SOA composite application, and the current status (up or down).
-
-
In the Name column, click a specific service component to access its home page.
-
In the Composite column, click a specific SOA composite application to access its home page.
16.5 Viewing Statistics About the Time a Request Spends in the BPEL Process Service Engine
You can display lower level details about the time a request spends in various service engine layers during processing with several System MBean Browser properties.
For information on configuring this information with the StatsLastN property on the BPEL Service Engine Properties page, see Configuring BPEL Process Service Engine Properties.
