You can introduce your own external sources directly into a production reporting environment without changing the data model. Visual Analyzer automatically conforms the external data to the curated enterprise data.
You can add data to blend with an existing subject area or create a new project without a subject area that includes data from an external source. A project can contain one subject area with one or more external subject areas, or a project can contain one external subject area. Subject areas and external subject areas have separate, distinct icons in the Data Sources pane to help you identify them. For more information, see
About Characteristics for External Sources.
To add data from an external source:
- In Visual Analyzer, open or create a project.
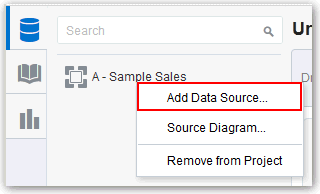
- Right-click the Data Sources pane, and select Add Data Source.

Description of the illustration GUID-6E962DAC-8EFE-4355-8F3D-B364F319B1D7-default.gif
You can also click the Add Data Source link at the bottom of the Data Sources pane or right-click anywhere in the pane to display the Add Data Source option.
- In the Add Source dialog, select either the Data Files tab (if the file is in saved storage) or click Upload File (if the file is stored locally).
Note:
When you select to add a saved file and already have a subject area for the project, you see a list of those saved files that are already connected by default. You can select and add a source that is not connected.
- Select the appropriate file and click Add to Project to display the Add Source dialog.
If you selected a saved file on the Data Files tab, then the external data source is added to the project and you can skip the remaining steps.
- In the Upload File dialog, click Select File to select a locally stored file.
- If the file contains multiple sheets, select the sheet with the data you want to load.
- When uploading a source for the first time, edit the source names and descriptions to be more meaningful to you.
- Preview a sample of the data. Visual Analyzer automatically matches columns in the external source with the appropriate items in the data model. Note how columns will be added as measures, as attributes, or matched with an existing column in the subject area.
- To exclude a column, hover over the column name and click the check mark.
Note:
A column that is unavailable and marked with a red information symbol is invalid and will be excluded. You can hover over the symbol to learn the reason why the column is invalid. Typically this happens because the column name contains illegal characters (leading, trailing spaces, special chars) or the column name is a duplicate.
- Click Add to Project to accept the data associations. See Blending Data that You Added for details on manually editing data associations.
The data model expands to include the data from the source that you added.
Note:
You can load a new data set independently of an existing subject area, which means that you can analyze almost any data in
Visual Analyzer. From the project toolbar, click
New Project. In the Add Source dialog, select an existing file from saved storage or upload the file from a local disk.

