2 Insight Home
Oracle Real-Time Integration Business Insight Home page varies based on the user’s privileges logged in to the application.
A super user can see the following tabs or navigational shortcuts on the Home page:
-
Home — used to navigate to the Home page.
-
Designer — used to create models, milestones, and indicators that represent critical components of key business processes. This tab is visible only to users with the roles InsightBusinessUser/InsightIntegrationArchitect/InsightAdmin/InsightModelCreator.
-
Console — allows business performance tracking, trend identification, and the discovery of outliers using both custom and pre-defined dashboards. This tab is visible only to users with the roles InsightExecutive/InsightAdmin/InsightModelCreator.
-
Reports — creates and analyzes detailed data captured by models. This tab is visible only to users with the roles InsightExecutive/InsightAdmin/InsightModelCreator.
-
Administration — configures connections to application implementations to facilitate milestone and indicator mappings. This tab is visible only to users with the roles InsightAdmin/InsightConnectionCreator.
-
Guided Tour — walks you through the product using a set of videos. This tab is visible to all user roles.
-
Help Drawer — helps you to quickly access the documentation, videos, and tutorials of the product. This tab is visible to all user roles.
The Home page also displays Model Summary Cards, Reports, and Recent Models.
For more information about the role privileges of the users, see User Personas.
2.1 Welcome Panel
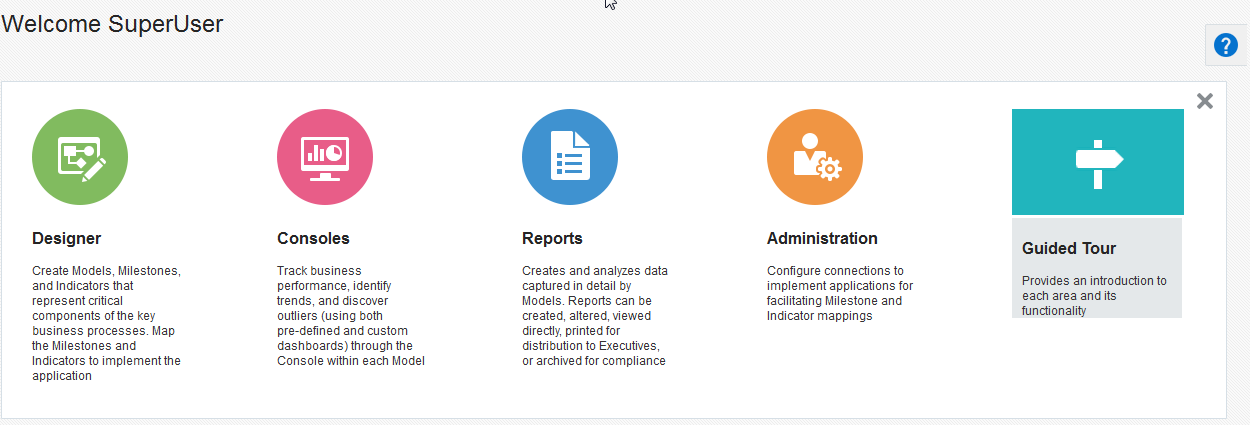
The Welcome Panel contains the navigational shortcuts, an alternative way to navigate to the Designer, Consoles, Reports, or Administration pages. You can configure whether to display the Welcome Panel on the Home page or not from the Preferences.
Apart from the navigational shortcuts, the Welcome Panel also has links to Guided Tour and Help Drawer.
Guided Tour
The Guided Tour is a set of introductory videos that provide a very high-level overview of the product. These videos help you to get familiarized with various areas of the product.
Help Drawer
The Help Drawer is a quick toolbar that allows you to get a high-level overview of the features in the product. This drawer also helps you to troubleshoot some commonly faced issues. You can also see links to the documentation sections from this drawer.
Figure 2-1 Welcome Panel

2.2 Model Summary Cards
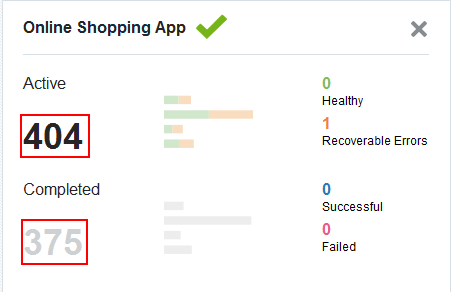
The Model Summary Cards provide high-level details about the available models in the application. The summary cards provide details about:
-
State of the model
-
Total number of active instances for the last five days
Note:
There is a difference between how the Last 5 days filter behaves on the Home page and in the dashboard filters. On the Home page, data for each of the last five days is shown separately. For example, if today is February 15, then data will be shown for February 15, 14, 13, 12, and 11. For each day the data will be from the start of the day to the end of the day as per the server time zone.However, in the dashboard filters last 5 days means all the data between current timestamp and 5 days before the current timestamp (current timestamp - 5 days). The behavior is similar for the other filter options last 1 day, last 30 days and last 90 days. The behavior on the Consoles home page is same as that of the Home page except that the Home page displays data for five days while the Consoles page displays data for one day.
-
Total number of successful instances for the last five days
-
Number of instances in each of the states: Healthy, Recoverable Errors, Successful, and Failed, for one day. By default they are for the last day but you can click any of the bars to see this information for that day.
Instance States
The instances can be in either Active or Successful state.
-
Active — either Healthy or Recoverable
-
A Healthy instance is the one that has last passed a milestone which is neither terminal nor error.
-
A Recoverable instance is the one that has last passed a milestone which is error but not terminal.
-
-
Completed — either Successful or Failed
-
A Successful instance is the one that has last passed a milestone which is terminal but not error.
-
A Failed instance is the one that has last passed a milestone which is both terminal and error.
-
Figure 2-2 Model Summary Card

When you click the model name or the number of instances (active or completed), you navigate to its Dashboards Page. Here you can see the five-day history chart of the model.
If you do not see any Model Summary Cards on the Home page, click Add Console at the bottom of the screen and select the model that you want to add. The consoles you add are specific to you are not propagated to other users who log in to the application.

Note:
You can add a maximum of six consoles using the Add Console button. When you reach the limit of six consoles, instead of the Add Console button you will see the View All link. When you click that link, you navigate to the Consoles page.2.3 Recent Models
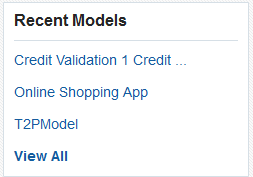
The Recent Models card in the bottom right of the screen displays the recent models defined in the application up to a maximum of five models. The models which have been recently updated or activated appear in this list. This pane also has a View All link that takes you to the Designer page. When you click any individual model, you navigate to the model details page. This reduces the number of clicks to reach the model details page.
Figure 2-3 Recent Models Card

2.4 Reports
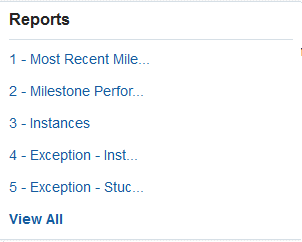
The Reports card in the bottom right of the screen displays the available reports in the application up to a maximum of 5 reports. The pane also has a View All link that takes you to the Reports page.
When you click each of the report link in the report card, you are navigated to the Reports page and that particular is displayed.
Figure 2-4 Reports Card
