77 Customizing Content Audit Reports
You can customize content audit reports by adding custom charts to these reports or changing the OOTB charts.
Topics:
77.1 About the Content Audit Reports
The Content Audit report is a collection of charts that show statistics on visitor traffic for a given asset. A chart is a visualization component that enables users to view and analyze data on website visitors. These Chart components query the WebCenter Sites database for data that will be displayed in the Content Audit report.
To view the Content Audit report, access an asset's Inspect view and then click the Report icon in the asset's toolbar. By default, the report shows the following charts:
-
Metrics Bar: Contains a set of tickers that display statistics on site visitor activity on the asset during the selected time interval.
-
Authoring Statistics Chart: This report plots the number of assets created and edited against the number of assets published during the selected time period, excluding technical assets such as Template assets.
-
Publish Details Report: This report provides details about publishing history and scheduled publishing jobs for the selected time period.
-
Author Productivity Report: This report displays information about the content contributors who created and edited assets in the selected time period, on the given content management site.
-
Content Tag Cloud: This report displays the most common tags that were applied to assets during the selected time range.
-
Asset Type List: This report displays a list of the top five asset types on which users performed create and edit operations during the selected time range, on the given content management site.
-
Top Internal Searches List: This report lists the top 10 search words and phrases that Contributor interface users entered into the Search field during the reported time range.
See Working with Content Audit Reports in Using Oracle WebCenter Sites.
You can customize the Content Audit report by creating and adding custom charts to the report, customizing the default charts shown on the report, and removing charts from the report. You can either customize the default Content Audit report, or create your own Content Audit report which will override the default report.
77.2 Customizing the Content Audit Report
You can customize the Content Audit report by creating a chart and its rendering elements that you will use to implement the chart, and then adding the chart to the report.
Topics:
77.2.1 Creating a Custom Chart for the Content Audit Report
To create a chart, you must first create a chart asset (using the WCS_Chart asset type) and then create its rendering elements under CustomElements in the ElementCatalog.
The following procedures use the example of a custom bar chart, that displays the number of page visits to a selected asset, to provide instructions for creating a custom chart:
-
Create Rendering Elements to Implement the Chart
Note:
For detailed information about rendering elements, see UI Controller. For information about storing custom elements, see Element Storage.
77.2.1.2 Create Rendering Elements to Implement the Chart
To implement a custom chart, you must create the chart's rendering elements under CustomElements. The UI Controller then tests for these custom elements in three phases: Configuration, Action, and Presentation.
For this example, create the <CustomChart>Action.jsp and <CustomChart>Html.jsp elements for the chart under CustomElements/avisports/UI/Layout/CenterPane/Insights/Charts. This location specifies the chart to be shown on the Content Audit report in the avisports sample site.
Note:
The chart in this example does not require a configuration element (<CustomChart>Config.jsp) because there are no configuration settings to be processed by the UI Controller. See UI Controller.
77.2.1.3 Add the Chart to a Report
To view this chart in the Contributor interface, add it to the Content Audit report. See Adding a Custom Chart to a Report.
77.2.2 Modifying the Chart's Rendering Elements
- In the ElementCatalog, copy the chart's rendering elements from
UI/Layout/CenterPane/Insights/Charts/<ChartName>toCustomElements, under the same path, in the ElementCatalog. For example:CustomElements/UI/Layout/CenterPane/Insights/Charts/<ChartName>. - Open the rendering elements in a text editor and make your changes to the JSP files. See Custom Elements.
77.2.3 Adding a Custom Chart to a Report
-
Add the custom chart to the Content Audit report:
-
To add the chart to a custom Content Audit report, insert the following lines into the custom
ReportHtml.jsp:<!-- Include the charts here --> <div class="block box event-box"> <div id="PageVisitRankContainer" class="siteinsightschart" data-chartname="Custom"></div> </div>
-
To add the chart to the default Content Audit report, insert the following line into
UI\Layout\CenterPane\Insights\Dashboard\ContentAuditHtml.jsp:Note:
Make a copy of this element to CustomElements before making the changes.<div class="siteinsightschart" data-chartname="<ChartName>"></div>
-
-
Verify the chart displays properly on the Content Audit report:
-
Log in to WebCenter Sites, select the avisports sample site, and then select the Contributor icon.
-
Open an Article or Page asset, and then click the Reports icon.
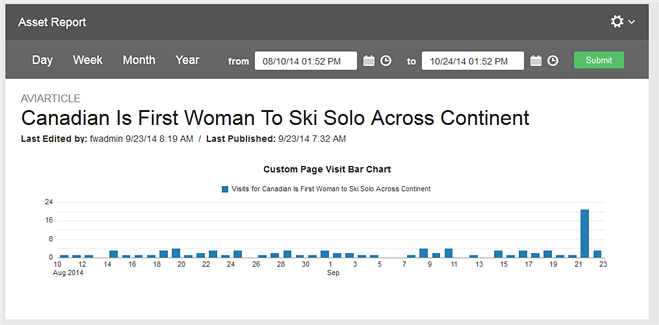
The custom report loads with the custom chart:
Figure 77-1 Custom Content Audit Report with Custom Chart

Description of "Figure 77-1 Custom Content Audit Report with Custom Chart"
-