Adding Data Elements to Visualization Drop Targets

You can use visualization drop targets to help you position data elements in the optimal locations for exploring content.

To add data elements to visualization drop targets:

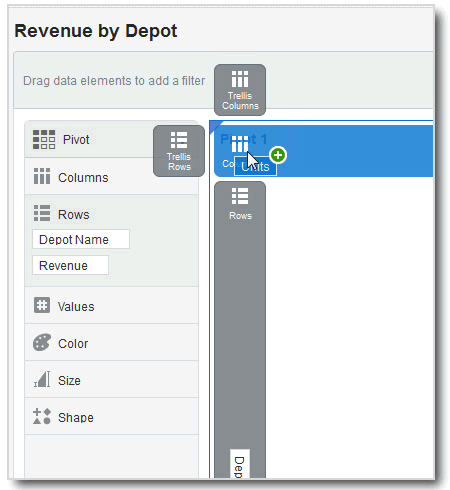
  • If you drag and drop a data element over to a visualization (but not on a specific drop target), a blue outline displays around the recommended drop targets in the visualization. If you drop the data element in the visualization, it is automatically shuttled to the best drop target.

    Also, you see a green plus icon next to the data element when it is over a valid drop target.

    Description of GUID-85F9FA40-4662-4C94-AB30-FEF44765839B-print.eps follows
    Description of the illustration GUID-85F9FA40-4662-4C94-AB30-FEF44765839B-print.eps

    Note:

    If you are not sure where to drag and drop any data element, simply drag and drop the data element anywhere over the visualization, and not to a specific drop target. The data element is automatically added to the best drop target on the canvas.

    After you drop data elements into visualization drop targets or when you move your cursor outside of the visualization, the drop targets disappear.

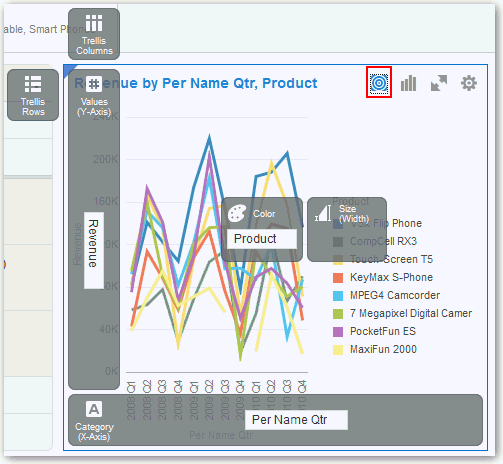
  • To display the drop targets again in the visualization, on the visualization toolbar, click Show Assignments. You can also do this to keep the visualization drop targets in place while you work.

For more information on adding, removing, or moving data elements, see Adding Data Elements to Drop Targets.