About Adding Your Own Data
It’s easy to add data from data sources. Adding your own data is sometimes referred to as “mash-up.”
You can add data in these ways:
-
Add data from a single source, such as a spreadsheet, to analyze on its own. Or combine a source with other sources to broaden the scope of your analysis.
-
Add your own data as an extension to an existing subject area.
You can load data to Visual Analyzer from a data source that is related to an existing Subject Area. You may need to identify the columns that have common values so that Visual Analyzer can match external and Subject Area rows appropriately. You can "Add Facts" where a table includes measures - columns that are typically summed or averaged, or you can "Extend Dimensions" where a table includes no measures.
-
Add data from Oracle application data sources. For more information, see Connecting to Oracle Applications Data Sources.
-
Add data from a database. For more information, see Connecting to Database Data Sources.
Note:
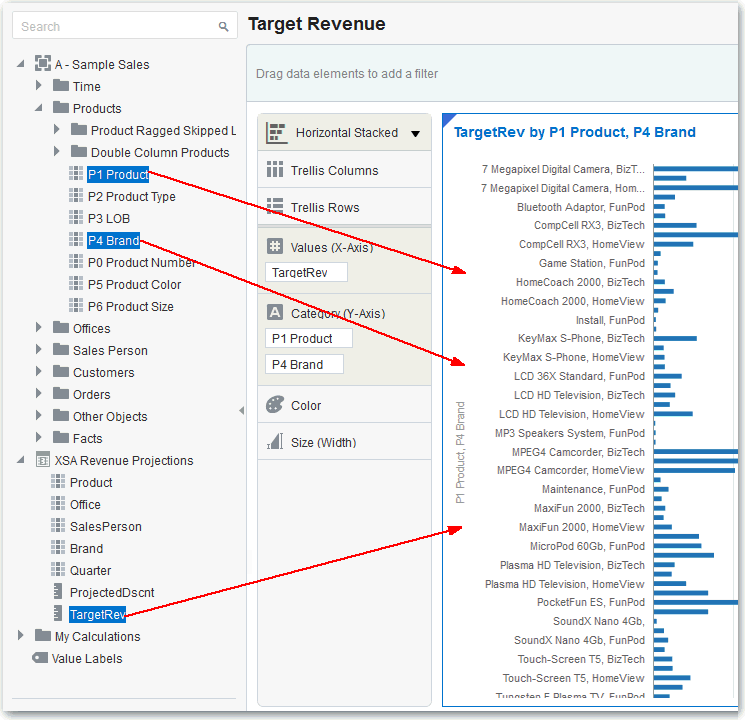
You can match multiple data sources to a subject area, but you can’t match a data source to another data source.Suppose that you have a subject area that contains data about sales, such as Products, Brands, and Salespeople. You have a spreadsheet file that contains Target Revenue sales figures, which do not exist in the subject area. You’d like to create a visualization that combines Product and Brand values from the subject area with the Target Revenue figures from your spreadsheet. When you add the data, you match the Product and Brand columns from the spreadsheet with those in the subject area and add Target Revenue as a measure. The matching connects the spreadsheet with the subject area. When you drag the three columns to the canvas, Visual Analyzer treats the data as if it is part of one integrated system.

Description of the illustration GUID-3DD96001-AFBE-45BF-87E6-5ED97AEA49F9-default.gif
When you add data to projects, it uses the names and data types of the columns being added to guess the best way to blend the data for you. You can make manual adjustments if that guess is not appropriate. A data model is created as part of your workflow, and you do not need to create one explicitly. The system does the work for you, but you can make manual adjustments if you want to. For more information, see Blending Data that You Added.
When you blend Microsoft Excel spreadsheet files, the columns that you introduce behave as though they are part of the data model, even though you have not made any changes in Oracle Business Intelligence. The data that you add is saved by name in Oracle Business Intelligence. You can add the data to projects and share it with other users. You can delete the data when you need to preserve space. For more information, see Deleting Data that You Added.