18 Server Logs

This chapter describes how you can use Oracle Stream Analytics Visualizer to view and configure the Oracle Stream Analytics server logging service and component loggers.

This chapter includes the following sections:

For more information, see Log Management.

18.1 Configure the Server Logging Service

Using the Oracle Stream Analytics Visualizer, you can configure the logging system of a selected Oracle Stream Analytics server. By default, this logging configuration applies to all components.

To configure component-specific logging options, see Configure a Component Logger.

Configure the Server Logging Service

  1. In the left pane, click the Domain > Server node, where Domain refers to the name of your Oracle Stream Analytics domain and Server refers to the name of the server instance.
  2. In the right pane, click the Logging tab.
  3. Click the Logging Services tab.

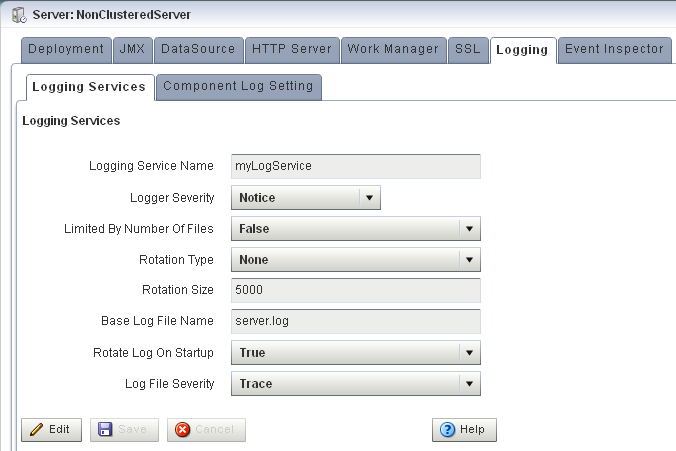
    The Logging Services tab appears as Figure 18-1 shows.

    Figure 18-1 Logging Services Tab

    Description of Figure 18-1 follows
    Description of "Figure 18-1 Logging Services Tab"
  4. Click Edit.
  5. Edit the dialog as Table 18-1 describes.

    Table 18-1 Logging Services Options

    Attribute Description

    Logging Service Name

    Specify the name of the logging service as the Oracle Stream Analytics server config.xml file specifies.

    Logger Severity

    Specify the default log severity at which Oracle Stream Analytics server logs messages.

    Limited By Number Of Files

    Specify whether or not to keep old log files indefinitely:

    • true: keep only the last 7 log files.

    • false: keep all log files.

    Rotation Type

    Specify when Oracle Stream Analytics server should close the existing log file and open a new one:

    • Size: Oracle Stream Analytics server closes the existing log file when it reaches the size (in KB) you enter in the Rotation Size field.

    • Time: Oracle Stream Analytics server closes the existing log file at the time you enter in the numeric entry field below the Rotation Type pull-down menu in k:mm format, where k is the hour specified in 24 hour notation and mm is the minutes. Default-Value: 00:00.

    • None: Oracle Stream Analytics server never closes the existing log file and allows it to grow to an unlimited size.

    Rotation Size

    When you specify Rotation Type as Size, enter the maximum log file size in KB.

    Base Log File Name

    The name of the base log file.

    Default: server.log.

    Rotate Log On Startup

    Specify whether or not Oracle Stream Analytics server closes the existing log file and creates a new one each time the Oracle Stream Analytics server starts up:

    • true: Oracle Stream Analytics server closes the existing log file and creates a new one each time the Oracle Stream Analytics server starts up.

    • false: Oracle Stream Analytics server does not close the existing log file each time the Oracle Stream Analytics server starts up.

    Log File Severity

    Specify the default log file severity. Oracle Stream Analytics server (and, by default, all components), log messages at this severity:

    • Emergency

    • Alert

    • Critical

    • Error

    • Warning

    • Notice

    • Info

    • Debug

    • Trace

  6. Click the Save button to commit your changes.

18.2 Configure a Component Logger

Using the Oracle Stream Analytics Visualizer, you can configure the logging properties of a selected component. Table 18-2 lists the components that are configured to log at the Notice log level, by default.

This section describes how:

Add a Component Logger

  1. In the left pane, click the Domain > Server node, where Domain refers to the name of your Oracle Stream Analytics domain and Server refers to the name of the server instance.

  2. In the right pane, click the Logging tab.

  3. Click the Component Log Setting tab.

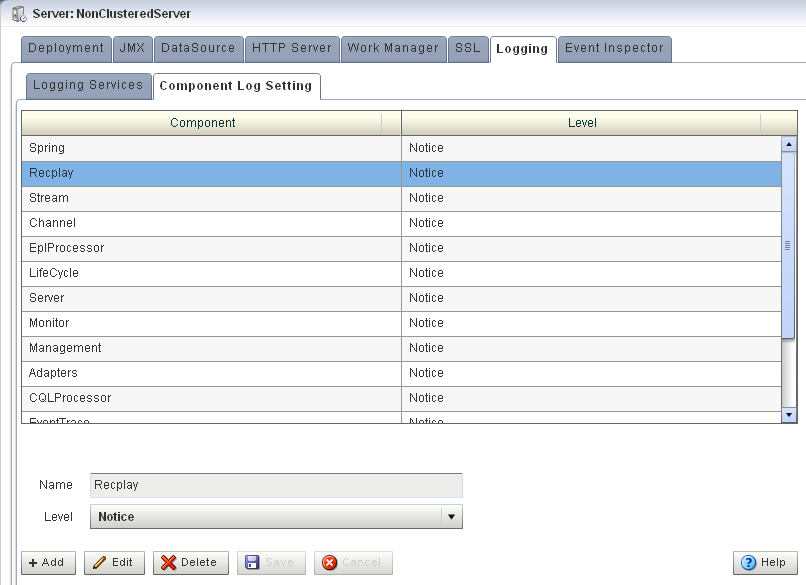
    The Component Log Setting tab appears as Figure 18-2 show.

    Figure 18-2 Component Log Setting Tab

    Description of Figure 18-2 follows
    Description of "Figure 18-2 Component Log Setting Tab"
  4. Click Add.

  5. Enter the name of the component in the Name field.

    You can choose any of the following:

    • Component name: a component name constant exactly as Table 18-2 lists.


      Table 18-2 Logging Component Name Constants

      Component Name Description

      Adapters

      Applies to log messages from adapter instances running on the Oracle Stream Analytics server.

      Cache

      Applies to log messages from caching systems and cache instances running on the Oracle Stream Analytics server.

      Channel

      Applies to log messages from channels running on the Oracle Stream Analytics server.

      CQLProcessor

      Applies to log messages from Oracle CQL processors running on the Oracle Stream Analytics server.

      CQLServer

      Applies to log messages from the CQL Engine, which is at the core of each CQLProcessor.

      CQLServerTrace

      Applies to log messages from the CQL Engine, which is at the core of each CQLProcessor

      Ede

      Applies to log messages from the Event-Driven Environment, the Oracle Stream Analytics server event-dispatching infrastructure.

      EventTrace

      When set to Info or Debug, allows you to trace events as they flow through the EPN for all applications. You can dynamically change the severity of this log key using Oracle Stream Analytics Visualizer.

      At the Info severity, you see log messages like this (although likely displayed on one line):

      <May 26, 2009 5:53:49 PM PDT> <Info> <EventTrace> <BEA-000000> 
          <Application [helloworld], Stage [helloworldOutputChannel] 
          received insert event>
      

      At the Debug severity, the log messages include details of the event:

      <May 26, 2009 6:02:34 PM PDT> <Debug> <EventTrace> <BEA-000000> 
          <Application [helloworld], Stage [helloworldOutputChannel] 
          received insert event [HelloWorldEvent: HelloWorld - the 
          current time is: 6:02:34 PM]>
      

      Lifecycle

      Applies to log messages from Oracle Stream Analytics server and application life cycle operations.

      Management

      Applies to log messages from Oracle Stream Analytics server general JMX-related management API operations.

      Monitor

      Applies to log messages from the Oracle Stream Analytics server monitoring service.

      Recplay

      Applies to log messages from Oracle Stream Analytics server event recording and playback operations.

      Spring

      Applies to log messages from Spring container operations.

      Stream

      Applies to log messages from stream instances running on the Oracle Stream Analytics server.


    • Application name: the module name of any Oracle Stream Analytics server or user-defined application. For example: sample.HelloWorld.

    • Package name: the name of any Oracle Stream Analytics server or user-supplied Java package. For example: com.bea.wlevs.ede.

    • Class name: the fully qualified name of any Oracle Stream Analytics server or user-defined class. For example: com.bea.wlevs.cep.core.EPRuntimeImpl.

  6. Select the severity level from the Level drop-down menu:

    • Emergency

    • Alert

    • Critical

    • Error

    • Warning

    • Notice

    • Info

    • Debug

    • Trace

  7. Click Save.

    The component and the severity level is displayed in the table.

Change the Logging Level of a Component

  1. In the left pane, click the Domain > Server node, where Domain refers to the name of your Oracle Stream Analytics domain and Server refers to the name of the server instance.

  2. In the right pane, click the Logging tab.

  3. Click the Component Log Setting tab.

    The Component Log Setting tab appears as Figure 18-3 show.

    Figure 18-3 Component Log Setting Tab

    Description of Figure 18-3 follows
    Description of "Figure 18-3 Component Log Setting Tab"
  4. Select the component entry in the table.

  5. Click Edit.

  6. Select the severity level from the Level drop-down menu:

    • Emergency

    • Alert

    • Critical

    • Error

    • Warning

    • Notice

    • Info

    • Debug

    • Trace

  7. Click Save.

    The new severity level is displayed in the table.

To delete a component logger:

  1. In the left pane, click the Domain > Server node, where Domain refers to the name of your Oracle Stream Analytics domain and Server refers to the name of the server instance.
  2. In the right pane, click the Logging tab.
  3. Click the Component Log Setting tab.

    The Component Log Setting tab appears as Figure 18-4 show.

    Figure 18-4 Component Log Setting Tab

    Description of Figure 18-4 follows
    Description of "Figure 18-4 Component Log Setting Tab"
  4. Select the component entry in the table.
  5. Click Delete.

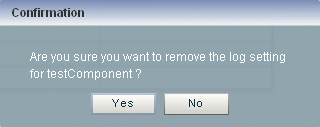
    A confirmation dialog appears as Figure 18-5 shows.

    Figure 18-5 Component Log Configuration Delete Confirmation

    Description of Figure 18-5 follows
    Description of "Figure 18-5 Component Log Configuration Delete Confirmation"
  6. Click Yes.

    The component logger is removed from the table.

18.3 Query the Logs

Using the Oracle Stream Analytics Visualizer, you can run queries on the logs of a selected Oracle Stream Analytics server. The Query Logs feature allows you to view the information in the selected log files.

Query the Logs
  1. In the left pane, click the Domain > Server node, where Domain refers to the name of your Oracle Stream Analytics domain and Server refers to the name of the server instance.
  2. Click Services and then click Log Query.

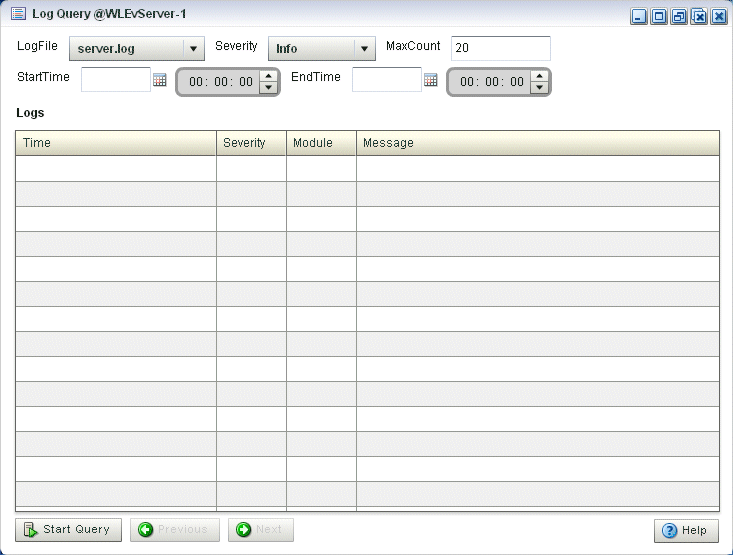
    The Log Query screen is displayed, as shown in Figure 18-6.

    Figure 18-6 Log Query Screen

    Description of Figure 18-6 follows
    Description of "Figure 18-6 Log Query Screen"
  3. Select the following options in the Log Query screen:
    • LogFile: Select the log file you want to query from the drop-down.

    • Severity: Select the severity of the log file that you selected in the LogFile drop-down.

    • MaxCount: Enter the maximum count of rows of log you wish to view for the selected log file.

    • StartTime: Select the time when the query should start running.

    • EndTime: Select the time when the query should stop.

  4. Click Start Query.

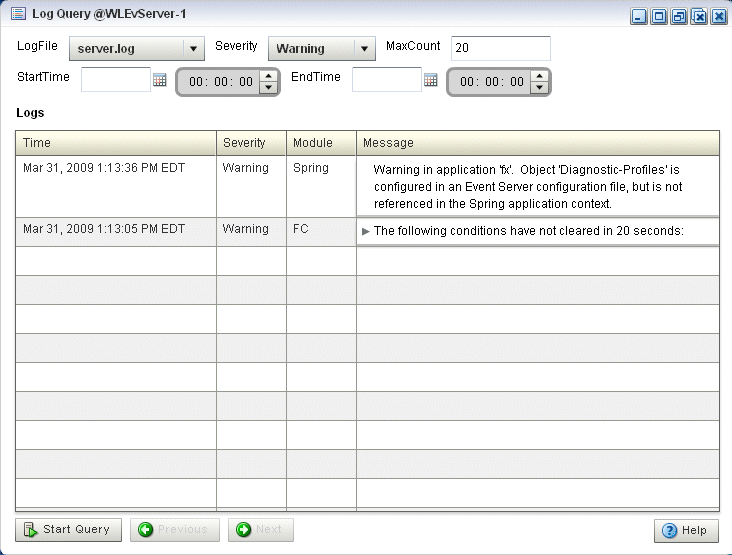
    All the log messages that match your query criteria for the selected log file of the selected Oracle Stream Analytics Server are displayed in the Logs pane, as shown in Figure 18-7.

    Figure 18-7 Log Query Screen - Logs Displayed

    Description of Figure 18-7 follows
    Description of "Figure 18-7 Log Query Screen - Logs Displayed"
  5. If more messages are returned than can be displayed in the Logs pane, the Previous and Next buttons activate. Click the Previous and Next buttons to page through the messages.

18.4 View Console Output

Using the Oracle Stream Analytics Visualizer, you can view the console output of a selected Oracle Stream Analytics server.

View Console Output

  1. In the left pane, click the Domain > Server node, where Domain refers to the name of your Oracle Stream Analytics domain and Server refers to the name of the server instance.
  2. Click Services and then click Console Output.

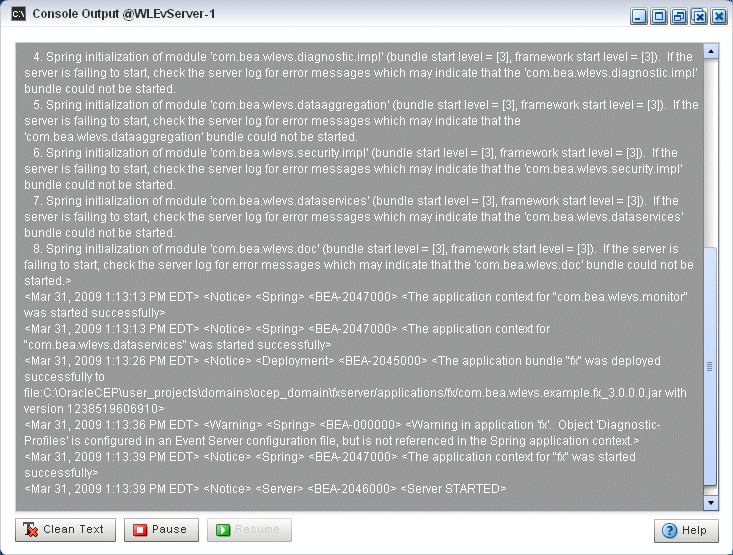
    The Console Output screen is displayed, as shown in Figure 18-8.

    Figure 18-8 Sample Console Output for HelloWorld Application

    Description of Figure 18-8 follows
    Description of "Figure 18-8 Sample Console Output for HelloWorld Application"
  3. Click the Clean Text button to clear the text in the Console Output window.
  4. Click the Pause button to pause the output of console messages.
  5. Click the Resume button to resume the output of console messages.