49 Debugging and Auditing SOA Composite Applications
This chapter includes the following sections:
49.1 Introduction to the SOA Debugger
You can test and debug SOA composite applications with the SOA debugger in Oracle JDeveloper. The SOA debugger reduces the development cycle for a SOA composite application by providing a troubleshooting environment within Oracle JDeveloper. This eliminates the lengthy process of building a SOA composite application in Oracle JDeveloper, deploying it to the SOA Infrastructure, starting Oracle Enterprise Manager Fusion Middleware Control to test or view audit trails and flow traces, and then returning to Oracle JDeveloper to repeat the exercise. Instead, you can set breakpoints in Oracle JDeveloper for troubleshooting on the following components:
-
Binding components and service components in SOA composite applications
-
Synchronous and asynchronous BPEL processes
-
Oracle BPM processes
-
Oracle Service Bus pipelines (See Section "Debugging Oracle Service Bus Applications" of Developing Services with Oracle Service Bus)
Note the following guidelines when using the SOA debugger:
-
The SOA composite application name and the Oracle JDeveloper project name must be the same.
-
Any SOA composite application encountered during a debugging session must reside in the currently active workspace in Oracle JDeveloper.
-
Debugging is limited to design view in Oracle JDeveloper. You cannot run the SOA debugger in Oracle Enterprise Manager Fusion Middleware Control.
-
Debugging is a localized user experience. If you want to switch to other tasks (for example, search for instances or initiate new instances of the same composite from Oracle Enterprise Manager Fusion Middleware Control), close the debugging session.
-
You cannot set breakpoints on REST services.
-
The breakpoints that you create for debugging in a SOA composite application in one installation of Oracle JDeveloper are not available to other Oracle JDeveloper installations. You must create the breakpoints again for debugging.
-
During a debugging session in which you are using the embedded Integrated WebLogic Server, you cannot use the version of Oracle Enterprise Manager Fusion Middleware Control included with the embedded server to generate new instances or query instances. For information about the Integrated WebLogic Server, see Installing SOA Suite and Business Process Management Suite Quick Start for Developers.
-
You cannot debug cross-language features, such as a Java
execactivity, XSLT and XQuery transformations, and so on. -
You can debug SOA composite applications on servers on which Oracle SOA Suite is installed. For example, if Oracle SOA Suite runs on managed servers, clients must connect using the managed server host and port.
-
Only one client at a time can connect to the SOA debugger.
-
You cannot debug multiple instances of the same SOA composite application at a given time even though Oracle JDeveloper does not restrict you from this action. This is not the correct approach. The SOA debugger is a development tool. It is your responsibility to ensure that only a single instance is debugged at any given time.
-
Adapter endpoint errors are not displayed in the SOA debugger in Oracle JDeveloper. Those errors are logged in the log file.
-
You can only debug if the server is in development mode. Debugging in production mode is not supported.
-
Oracle B2B and Oracle SOA for Healthcare service and reference binding components cannot be debugged with the SOA debugger even though you can set debugging points on both components.
-
SOA composite application-to-SOA composite application debugging is not supported.
49.2 Debugging a SOA Composite Application
This section describes how to create breakpoints and debug SOA composite applications in Oracle JDeveloper.
Note:
Do not attempt to debug SOA composite applications with very large payloads. Attempting to do so results in the SOA debugger breakpoints hanging in the outbound direction.
49.2.1 How to Start the SOA Debugger
To start the SOA debugger:
-
Start the Integrated WebLogic Server. For information about starting the Integrated WebLogic Server with the Start Server Instance option, see Section "Installing Oracle SOA Suite Quick Start for Developers" of Installing SOA Suite and Business Process Management Suite Quick Start for Developers.
-
Start the SOA debugger in either of the following ways. This is limited to single composite debugging.
-
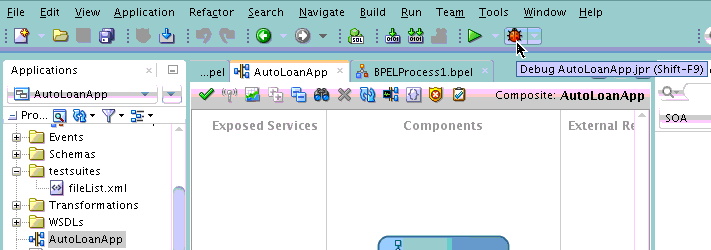
Click the debugger icon above the SOA Composite Editor, as shown in Figure 49-1.
Figure 49-1 Debugger Icon in SOA Composite Editor
Description of "Figure 49-1 Debugger Icon in SOA Composite Editor" -
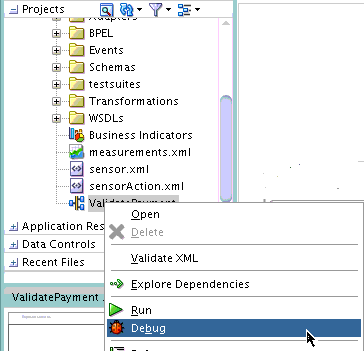
Right-click the SOA composite application in the Applications window, and select Debug. Figure 49-2 provides details.
Figure 49-2 Debug Menu Option for a SOA Composite Application in the Applications Window
Description of "Figure 49-2 Debug Menu Option for a SOA Composite Application in the Applications Window"
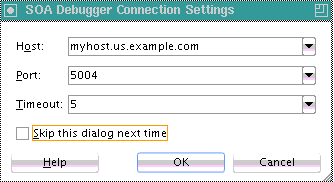
The SOA Debugger Connection Settings dialog is displayed, as shown in Figure 49-3. This dialog enables you to define the SOA debugging server to use.
Figure 49-3 SOA Debugger Connection Settings Dialog
Description of "Figure 49-3 SOA Debugger Connection Settings Dialog" -
-
Enter values appropriate to your environment, and click OK. Table 49-1 provides details.
Table 49-1 SOA Debugger Connection Setting Dialog
Field Description Host
Select the debugging server to which to connect. By default, the name of the local host is displayed. This is the embedded Integrated WebLogic Server in Oracle JDeveloper. You can also enter a remote server. When a project is imported from a different host, the host that was used there is displayed here.
Port
Enter the port on which the debugging agent listens. The default value is
5004. Debugging is automatically enabled in development environments when you install the Oracle SOA Suite Developer Quick Install. The debugger cannot be enabled in production mode or when the server is part of a cluster. For development environments, the debugger can be overridden by adding the following property settings in thesetDomainEnv.shfile.export SOA_DEBUG_FLAG="true" export SOA_DEBUG_PORT="5004"
Timeout
Specify in minutes how long the client should wait while attempting to establish a debugging session before stopping. The default value is
5minutes. For synchronous processes, you can increase the default value:-
Increase the SyncMaxWaitTime property in Oracle Enterprise Manager Fusion Middleware Control. For more information, see How To Specify Transaction Timeout Values.
-
Increase the Idle Timeout and Transaction Timeout values for the Enterprise JavaBeans property BPELDeliveryBean in Oracle WebLogic Server Administration Console. For information about accessing these properties, see the "Long Running, Synchronous Calls To Remote Web Services Error Out or Asynchronous Transactions Return with an Error after a Long Time" section of Administering Oracle SOA Suite and Oracle Business Process Management Suite.
-
Increase the Java Transaction API (JTA) timeout value located under the JTA link on the Oracle WebLogic Server Administration Console home page.
Skip this dialog next time
Select to skip this dialog the next time you begin a debugger session. The settings you previously defined are used.
You can display this dialog again by right-clicking the project in the Applications window. Select Project Properties > Run/Debug > Edit > Tool Settings > Debugger > Remote, and select the Show Dialog Box Before Connecting Debugger check box.
Note:
You can also edit these properties by right-clicking the project in the Applications window, and selecting Project Properties > Run/Debug > Edit > Tool Settings > Debugger > Remote.
A check is made to determine if the SOA composite application selected for debugging is deployed. Table 49-2 provides details.
Table 49-2 Check to Determine if the SOA Composite Application is Deployed
If the SOA Composite Application Is... Then... Deployed
The following message is displayed on the right handle of the service binding component:
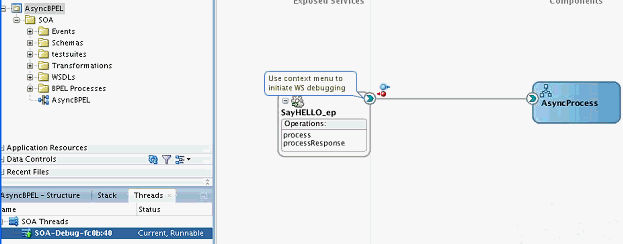
Use context menu to initiate WS debugging
See Figure 49-5 for an example of this message.
You are ready to begin debugging. Go to How to Set Breakpoints and Initiate Debugging.
-
Not deployed
-
Deployed, but there has been a design change in the composite since it was deployed.
Note: Composites deployed a second time with the Overwrite any existing composites with the same revision ID check box selected do not require an additional redeployment.
-
Deployed, but you removed the Oracle JDeveloper system folder. The system folder is identified by selecting Help > About > Properties, and searching for ide.system.dir.
-
Deployed in one Oracle JDeveloper, but the ZIP file of the SOA composite application was opened in a different installation of Oracle JDeveloper.
The Deployment Action page of the Deploy Project_Name wizard is displayed, and you must deploy the composite.
-
Select Deploy to Application Server.
-
Follow the pages of the wizard to deploy the SOA composite application to an application server.
For information about deploying SOA composite applications, see Deploying the Profile.
-
When deployment is complete, go to How to Set Breakpoints and Initiate Debugging.
You are ready to begin a debugging session when the following message is displayed in the Log window:
Debugger attempting to connect to remote process at host_name 5004
Debugger connected to remote process at host_name 5004
Debugger process virtual machine is SOA Debugger.
-
49.2.2 How to Set Breakpoints and Initiate Debugging
Breakpoints are the intentional pausing locations in a SOA composite application that you set for debugging purposes. You can set breakpoints on the following components:
-
Service binding components
-
Inbound and outbound parts of BPEL process activities and BPM process service components
-
Reference binding components such as web services and JCA adapters
-
Oracle Service Bus services (see "Debugging Oracle Service Bus Applications" of Developing Services with Oracle Service Bus)
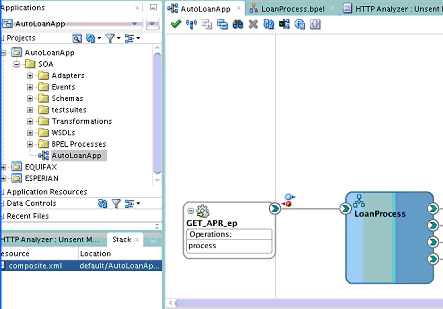
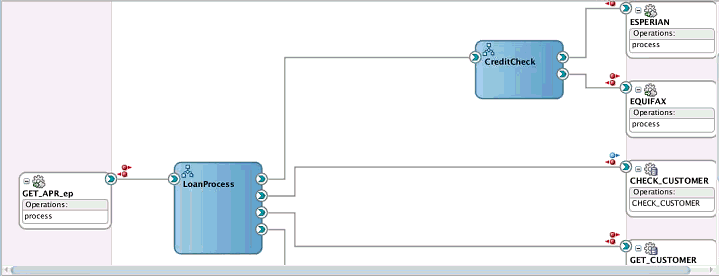
Components on which breakpoints are set are designated with red request (outbound) icons, reply (inbound) icons, or request-reply (outbound-inbound) icons. Figure 49-4 provides an example of a SOA composite application in which breakpoint icons have been set.
Figure 49-4 SOA Composite Application with Breakpoints Set

Description of "Figure 49-4 SOA Composite Application with Breakpoints Set"
To set breakpoints and initiate debugging:
-
Select the component on which to set the breakpoint, as shown in Table 49-3.
-
To set a breakpoint on a service binding component.
-
Right-click the right handle of the service on which the following message is displayed.
Use context menu to initiate WS debugging
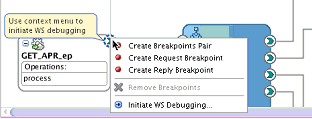
This action invokes the context menu shown in Figure 49-5.
Figure 49-5 SOA Debugger Breakpoint Menu Options
Description of "Figure 49-5 SOA Debugger Breakpoint Menu Options" -
Select the appropriate breakpoint interaction option shown in Table 49-4.
Table 49-4 Breakpoint Interaction Options
Option Description Create Breakpoints Pair
Set for a request-reply (outbound-inbound) interaction. This is useful for scenarios in which both the request and reply are important.
Create Request Breakpoint
Set for a request (outbound) interaction. This is useful for scenarios in which only the request is important.
Create Reply Breakpoint
Set for a reply (inbound) interaction. This is useful for scenarios in which only the reply is important.
Initiate WS Debugging
Initiate a debugging session. For example, the debugging session encompasses an initiating SOAP request from a web service to a BPEL process to an adapter reference binding component.
Red icons representing your interaction choice are added.
For example, if you select Create Breakpoints Pair, request and reply breakpoint icons are added. Figure 49-6 provides details.
Figure 49-6 Request and Reply Breakpoint Icons on a Service Binding Component
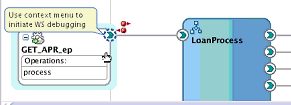
Description of "Figure 49-6 Request and Reply Breakpoint Icons on a Service Binding Component" -
Go to Step 5.
-
-
To set a breakpoint on a reference binding component.
-
Right-click the applicable reference binding component (for example, a web service or a database adapter), and select one of the breakpoint options described in Table 49-4.
For example, if you select Create Breakpoints Pair for several references, request and reply breakpoint icons are added. Figure 49-7 provides details.
Figure 49-7 Breakpoints Set on Reference Binding Components
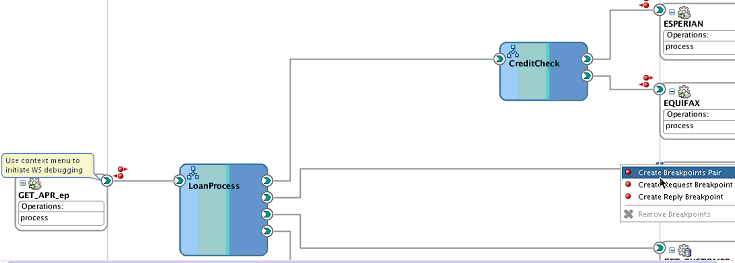
Description of "Figure 49-7 Breakpoints Set on Reference Binding Components" -
Go to Step 5.
-
-
To set a breakpoint on a service component (for this example, a BPEL process is selected).
-
Select Edit, as shown in Figure 49-8.
Figure 49-8 Request and Reply Breakpoint Icons on a BPEL Process
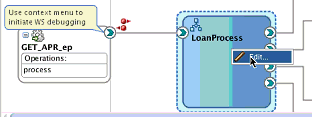
Description of "Figure 49-8 Request and Reply Breakpoint Icons on a BPEL Process"This opens the BPEL process in Oracle BPEL Designer.
-
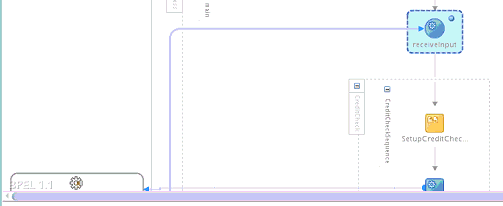
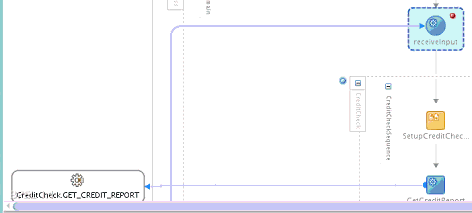
Right-click the BPEL activity on which to set a breakpoint, and select Toggle Breakpoint. Figure 49-9 provides details.
Figure 49-9 Breakpoint Setting for a BPEL Process
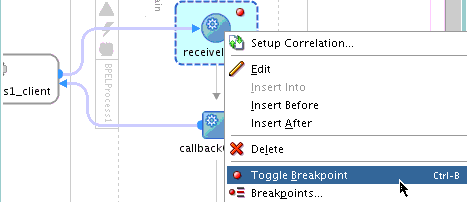
Description of "Figure 49-9 Breakpoint Setting for a BPEL Process"An icon is added to the activity. These breakpoint icons are only red dots because the flow is always in one direction. It is recommended that you always set a breakpoint on the first activity within an asynchronous BPEL process.
-
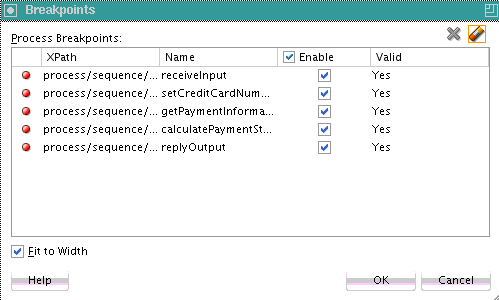
To disable the breakpoint, right-click and select Toggle Breakpoint again. The red dot is removed. To display a list of all breakpoints set in the BPEL process, right-click the activity and select Breakpoints. You can also enable and disable breakpoints from this dialog.
-
Go to Step 5.
-
-
To begin debugging of the SOA composite application, right-click the right handle of the service binding component shown in Figure 49-5, and select Initiate WS Debugging from the menu.
This invokes the HTTP Analyzer.
-
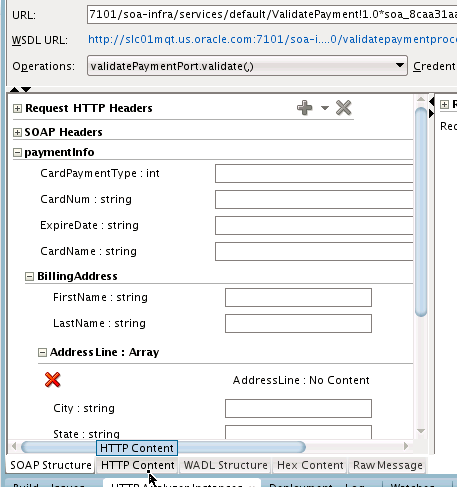
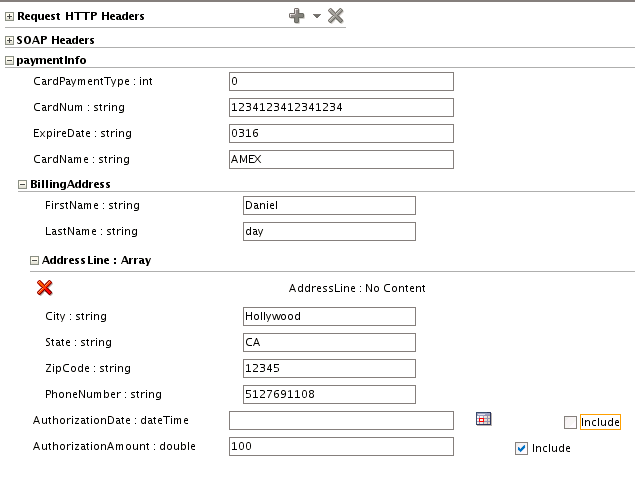
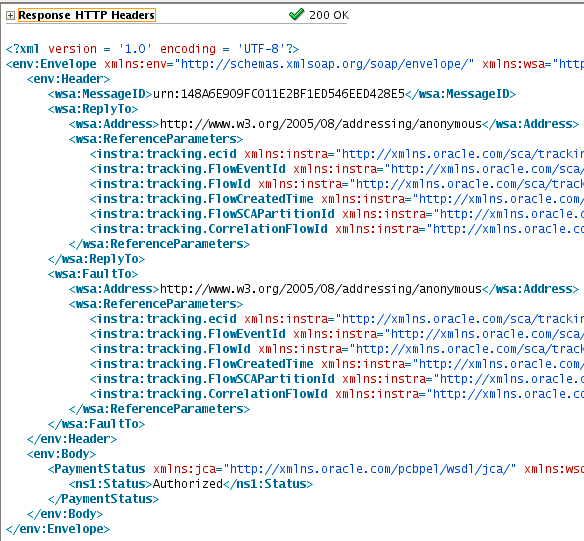
Enter the request message data to send, and click Send Request or click HTTP Content to copy and paste the contents from an XML file. You can either enter data field-by-field or copy and paste an XML document. Figure 49-10 provides details.
The debugger stops at the first breakpoint you set (for this example, on the service binding component).
-
In the Log window at the bottom of Oracle JDeveloper, click Data.
-
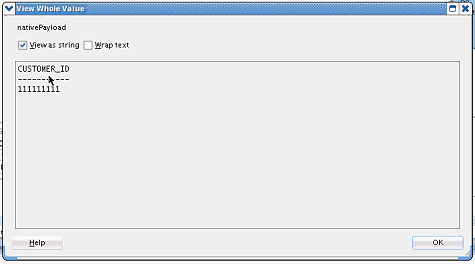
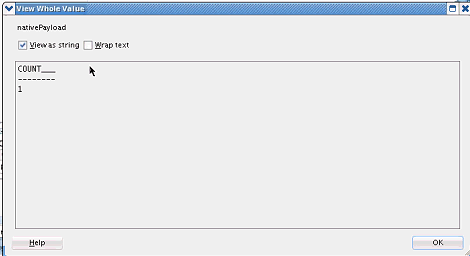
Expand the message contents. Figure 49-11 provides details. You can double-click a value to change it. For non-XML variables, right-click and choose View value (for example, the return message from a database adapter).
Figure 49-11 Message Contents After Debugger Invocation

Description of "Figure 49-11 Message Contents After Debugger Invocation"
49.2.3 How to Step Through a Debugging Session
When you create a breakpoint, a corresponding frame is created in the Structure window, as shown in Figure 49-12. This frame was created for the request-reply entry point on the service binding component.
A frame is a location. A stack of frames is a bread crumb trail of the locations that lead you to your current location. This is equivalent to a stack trace. It shows you where you are and how you got there. Frames are created independent of breakpoints. When you stop at a breakpoint, all frames that have been created in the Structure window are displayed. A stack frame also contains the data that existed at that point of time. Clicking a different stack frame in the Structure pane also updates the Data tab.
For example, if you have a web service connected to a BPEL process connected to a reference, if you set a breakpoint on the reference, you see a stack that generally looks as follows:
-
Reference
-
BPEL invoke
-
BPEL scope
-
Web service
If you click the web service frame, the SOAP payload in the Data tab is displayed. If you then click the BPEL invoke frame, the various BPEL variables and other details are displayed in the Data tab.
You can step over the frame and begin debugging at a different location, such as a different breakpoint (for this example, the LoanProcess BPEL process). As you proceed with debugging, the following frames are created. Frames are where variables are located.
-
Scope frame: Contains scope variables.
-
Process frame: Contains global variables.
Variables are visible to a process from the top frame through the bottom frame. Frames are displayed in the Structure window.
To step through a debugging session:
49.2.5 How to Remove Breakpoints
You can remove individual breakpoints or all breakpoints.
To remove breakpoints:
49.2.6 How to View Adapter Properties
You can view adapter properties under the Data tab in the Log window.
To view adapter properties:
49.2.7 How to View Threads
A process instance is always run by a single logical thread, whether it is a synchronous or asynchronous process (the process ID can be thought of as the thread). The SOA debugger sees and uses the logical thread. If a process has a flow or flowN activity, then several logical threads run the flow or flowN activity.
To view threads:
49.3 Testing SOA Composite Applications with the HTTP Analyzer
You can test HTTP requests and responses in a SOA composite application with the HTTP Analyzer in Oracle JDeveloper. The HTTP Analyzer enables you to examine the content of HTTP request/response package pairs. You can edit the content of a request package, resend it, and observe the response packet returned. For more information about the HTTP Analyzer, see the "Auditing and Monitoring Java Projects" chapter of Developing Applications with Oracle JDeveloper.
To test the SOA composite application with the HTTP Analyzer:
You can also use the Test Web Service page to perform testing. For more information, see Section "Initiating a Test Instance of a Business Flow" of Administering Oracle SOA Suite and Oracle Business Process Management Suite.
49.4 Auditing SOA Composite Applications at the BPEL Activity Level
Audit trail data often accounts for a large percentage of the state data persisted to the database. To reduce the amount of persisted state data, you can specify finer-grained levels of auditing at the BPEL process activity level. These settings take precedence over the audit trail settings configured at the service component, SOA composite application, BPEL process service engine, and SOA Infrastructure levels.
You perform the following procedures:
-
Create and configure an audit policy XML file that defines the level of auditing to perform on BPEL activities in the SOA composite application.
-
Create and configure an audit policy binding XML file that binds the audit policy to the BPEL process.
-
Place the files in the same directory location as the
composite.xmlfile or in a separate directory that you identify with properties in thecomposite.xmlfile. -
Deploy the SOA composite application to the SOA Infrastructure.
-
View the audit trail of the BPEL process activities in the flow trace of the SOA composite application in Oracle Enterprise Manager Fusion Middleware Control.
Note the following guidelines:
-
The audit policy supports the auditing of both standard BPEL 1.1 and 2.0 activities and scopes and BPEL extension activities, such as emails, notifications, and all others. Within a parent scope, you can configure specific child scopes to be audited, and other child scopes to not be audited.
-
The supported auditing levels are shown in Table 49-7.
Table 49-7 Auditing Levels
Level Description InheritLogging matches the SOA Infrastructure audit level that you set on the SOA Infrastructure Common Properties page in Oracle Enterprise Manager Fusion Middleware Control. This is the default setting.
ProductionMinimal information for business flow instances is collected. For example, the BPEL process service engine does not capture the payload. Therefore, the payload details are not available in the flow audit trails. This level is optimal for most standard operations and testing.
DevelopmentComplete information for BPEL process activities is collected. This option allows both composite instance tracking and payload tracking. This setting may have an impact on performance because the payload is stored at each step in the message flow. This setting is useful for debugging purposes.
OffNo logging is performed. Composite instance tracking information and payload tracking information are not collected.
-
Support is provided for wild-card matching of process names and revision numbers in the fault policy binding file. For example:
-
Entering
Order*applies to BPEL process service components included in the composite namedOrderProcess,OrderRejected, andOrderConfirmed:<process auditPolicy="noLoops" name="Order*"/>
-
Entering
1*applies to composite revisions1.0,1.1, and1.2:<process auditPolicy="noAssign" name="*" revision="1.*"/>
-
The following example shows the audit policy schema to use:
<?xml version="1.0" encoding="UTF-8"?>
<xs:schema targetNamespace="http://schemas.oracle.com/bpel/auditpolicy"
   xmlns:xs="http://www.w3.org/2001/XMLSchema"
   xmlns:tns="http://schemas.oracle.com/bpel/auditpolicy"
   elementFormDefault="qualified">
   <!-- activity can have a type or a name as optional attribute.-->
   <!-- Audit rules apply to all activities if no specific type or name is -->
   <!-- provided -->
   <xs:complexType name="Activity">
        <xs:attribute name="type" type="xs:QName" use="optional"/>
        <xs:attribute name="name" type="tns:idType" use="optional"/>
        <xs:attribute name="auditLevel" type="tns:auditLevelType" use="required"/>
   </xs:complexType>
   <xs:simpleType name="idType">
        <xs:restriction base="xs:string">
             <xs:minLength value="1"/>
         </xs:restriction>
   </xs:simpleType>
   <xs:simpleType name="auditLevelType">
         <xs:restriction base="xs:string">
              <xs:enumeration value="off"/>
              <xs:enumeration value="minimal"/>
              <xs:enumeration value="production"/>
              <xs:enumeration value="development"/>
         </xs:restriction>
   </xs:simpleType>
   <xs:element name="auditPolicy">
        <xs:complexType>
             <xs:sequence>
                  <xs:element name="activity" type="tns:Activity" minOccurs="0"
                   maxOccurs="unbounded"/>
             </xs:sequence>
             <xs:attribute name="id" type="tns:idType" use="required"/>
             <xs:attribute name="version" type="xs:string" default="1.0"/>
        </xs:complexType>
        <!-- we restrict users to provide mulitple rules for same activity -->
        <xs:key name="UniqueActivity">
             <xs:selector xpath="tns:activity"/>
             <xs:field xpath="@type"/>
             <xs:field xpath="@name"/>
        </xs:key>
     </xs:element>
</xs:schema>
The following example shows the audit policy binding schema to use.
<?xml version="1.0" encoding="UTF-8"?>
<xs:schema targetNamespace="http://schemas.oracle.com/bpel/auditpolicyBinding"
     xmlns:tns="http://schemas.oracle.com/bpel/auditpolicy"
      xmlns:xs="http://www.w3.org/2001/XMLSchema"
      elementFormDefault="qualified">
        <xs:complexType name="Process">
             <xs:attribute name="auditPolicyId" type="tns:idType" use="optional"/>
             <xs:attribute name="name" type="tns:idType" use="optional"/>
             <xs:attribute name="revision" type="tns:idType" use="optional"/>
        </xs:complexType>
        <xs:simpleType name="idType">
                <xs:restriction base="xs:string">
                       <xs:minLength value="1"/>
                </xs:restriction>
        </xs:simpleType>
        <xs:element name="auditPolicyBinding">
                <xs:complexType>
                       <xs:sequence>
                            <xs:element name="process" type="tns:Process"
                             minOccurs="0" maxOccurs="unbounded"/>
                        </xs:sequence>
                        <xs:attribute name="version" type="xs:string"
                         default="1.0"/>
                 </xs:complexType>
                 <xs:key name="UniqueActivity">
                       <xs:selector xpath="tns:process"/>
                       <xs:field xpath="@name"/>
                       <xs:field xpath="@revision"/>
                 </xs:key>
         </xs:element>
</xs:schema>