8 Configuring the Scheduler
Understanding the Scheduler
The updated architecture of the Scheduler uses the Java Messaging Service (JMS) queue technology.
This architecture enables you to add multiple publishing servers to a cluster and then dedicate each server to a particular function: report generation, document generation, or specific delivery channels.
Architecture
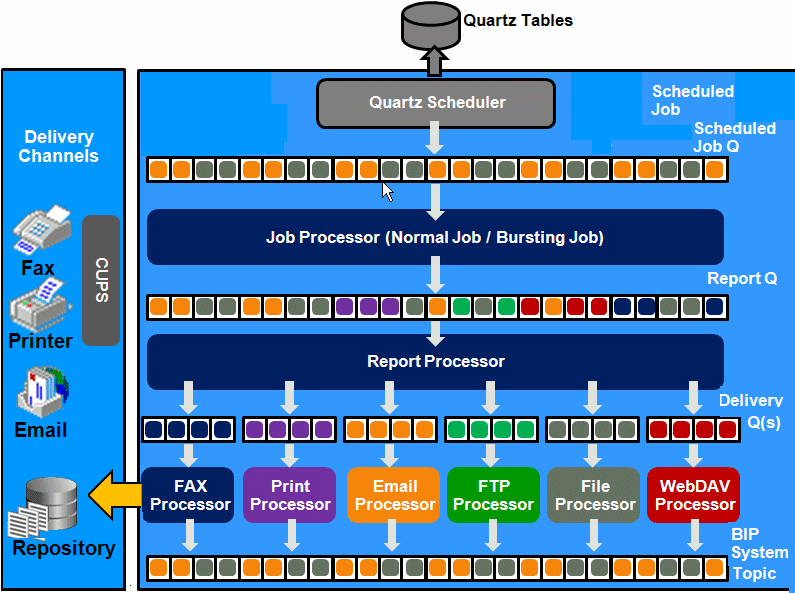
The architecture of the Scheduler uses JMS queues and topics to provide a highly scalable, highly performing and robust report scheduling and delivery system.
The figure below displays the scheduler architecture.
The following list describes the tasks performed by the scheduler when a job is submitted:
-
Submit Job
-
Stores job information and triggers in Quartz tables
-
-
Job Processor
-
When quartz trigger is fired, puts job information in Scheduler job queue
-
-
Bursting Engine / Batch Job Process
-
Bursting Engine Listener
-
Takes the scheduled job information from the queue
-
Extracts data from data source
-
Splits data according to bursting split by definition
-
Stores data temporarily in temp folder
-
Puts report metadata into Report Queue
-
-
Batch Job Process
-
Takes the scheduled job information from the queue
-
Extracts data from data source
-
Stores data temporarily in temp folder
-
Puts report metadata into Report Queue
-
-
-
FO Report Processor
-
Listens to Report Q
-
Generates report based on metadata
-
Stores report in shared TEMP directory
-
Puts report delivery information in Delivery Queue
-
-
Delivery Processors
-
Listen to Delivery queue
-
Call delivery API to deliver to different channels
-
-
BI Publisher (BIP) System Topic
The BIP System Topic publishes the runtime status and health of the scheduling engine. The topic publishes the status of all instances, the thread status of messages in the JMS queues, the status of all scheduler configurations such as database configuration, JNDI configuration of JMS queues and so on.
About Clustering
Clustering enables you to add server instances on demand to handle processing and delivery load.
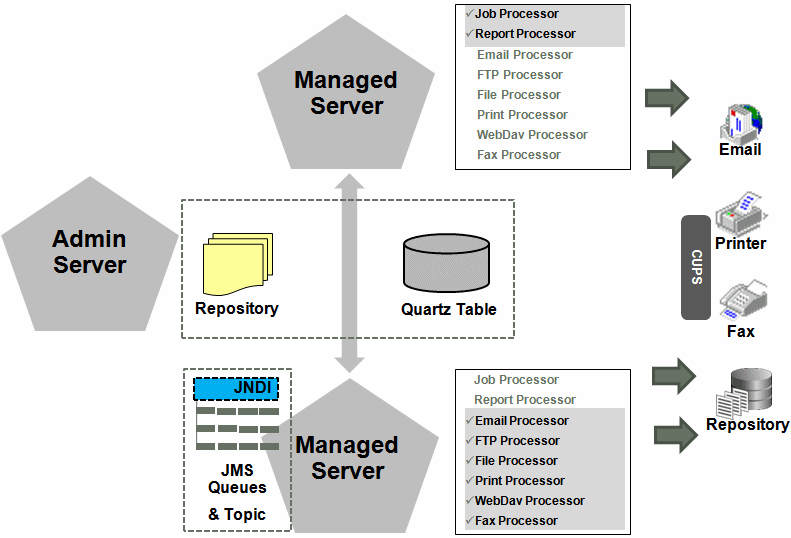
The figure below illustrates clustering in an Oracle WebLogic Server. Note that the report repository and the scheduler database are shared across the multiple instances; also, the JMS queues for scheduling and JMS topic for publishing diagnostic information are shared across the server by registering JMS queues and topics through JNDI services.
Each managed server instance points to the same report repository. In each managed server instance all the processes such as Job Processor, Report Processor, E-mail Processor, FTP Processor, Fax Processor, and Print Processor are configured. Therefore the moment a server instance pointing to the same repository is deployed, it is added to the cluster and all the processors in this instance are ready to run.
You can select the process to enable on any server instance, thereby using the resources optimally. Moreover, if there is a demand to process heavier jobs you can add more instances for report processing. Similarly, if e-mail delivery is the most preferred delivery channel, then more instances can be added to scale up e-mail delivery.
How Failover Works
The failover mechanism ensures that no report fails to deliver due to server unavailability.
Achieve this by balancing each process of the Scheduler using two or more nodes in a cluster thereby ensuring that a failure of any node must be backed up by the second node without any loss of data. For example, by enabling the Job Processor in two nodes, if one node fails, then the second node can process the jobs.
Note:
If a node goes down, the other nodes continue to service the queue. However, if a report job is in one of the following stages of execution: data retrieval, data formatting, or report delivery, the job is marked as failed, and must be manually resubmitted.
Set Up Considerations
There are certain topics you should consider before setting up the scheduler.
Table Space Requirements
The database containing the Oracle Business Intelligence Scheduler database tables requires minimum disk space.
Minimum disk space requirements include:
-
500MB on Oracle and Microsoft SQL Server databases for standalone and Business Intelligence applications and deployments.
-
500MB on IBM DB2 databases for standalone deployments.
For report storage, you must calculate the appropriate amount of space based on your company's usage. If you generate and archive multiple large reports, for example if your company generates an average of 2GB total file size of reports per month, and you also store the XML data for a period of one year, then the requirement will be (2 GB x 2 x 12 = 48 GB) on disk. Note that the size of the BLOB and CLOB may not be the same in the database as in the file system, but this calculation can provide approximate requirements.
Choosing JNDI or JDBC Connection
By default, the BI Platform installer configures the WebLogic JNDI connection URL.
JDBC is not recommended for production use. JDBC should only be used for low volume local testing.
Supported JMS Providers
When you install BI Publisher, the scheduler is automatically configured to use WebLogic JMS.
To configure BI Publisher to use ActiveMQ instead, see Configuring BI Publisher for ActiveMQ.
About Prioritizing Jobs
You can configure the processing order of jobs.
You can prioritize jobs and ensure that the high-priority report jobs run before the non-critical jobs when multiple jobs run simultaneously. In the General tab of the Report Properties page, you can set the job priority as Critical, Normal, or Low priority. When jobs are queued, the execution of a job depends on the priority specified for the job’s report. If you don’t prioritize jobs, the critical jobs, non-critical jobs, and on-demand queries can compete for resources and the critical jobs might get delayed. In the Report Job History page, you can identify the critical jobs and view the status of each job.
About Job Recovery
BI Publisher can recover interrupted jobs.
When Oracle BI Server or BI Publisher goes down, a long running job might get interrupted. BI Publisher resumes all the interrupted jobs whenOracle BI Server server restarts.
When a job is recovered, BI Publisher resumes the job from a logical point that was completed before interruption and uses the data that was fetched by the job before interruption.
BI Publisher can’t recover a job that failed before Oracle BI Server restarts. In this case, you might have to manually resubmit the failed job.
The Report Job History page displays the recovery details when you hover on the status icon of a job.
About the Scheduler Configuration
When the scheduler starts automatically, certain configurations occur.
-
The scheduler schema is installed to the database by the Repository Creation Utility.
-
JMS is configured in your server for publishing.
-
The WebLogic JNDI URL is configured.
-
Default threads per processor is set to 5.
You can see the configuration in the Scheduler Configuration page under System Maintenance.
Configuring the Shared Directory
The Shared Directory is used to temporarily store data and files used by the scheduler while jobs are executing.
After a job completes, the temporary data for the job is deleted. If the BI Publisher scheduler is configured to run on different nodes or machines, you must define this directory. The directory is used to exchange data and document information among all the BI Publisher nodes and therefore must be accessible by all BI Publisher nodes. The size of the directory depends on the total size of the job data, output documents, and the number of concurrent jobs. The directory should be big enough to hold all the XML data and documents for all the parallel running jobs. If BI Publisher runs on different machines while this directory is not configured, the scheduler may fail.
If BI Publisher runs on a single machine, defining a shared directory is optional. BI Publisher uses the application server's temporary directory to store this data.
Configuring Processors and Processor Threads
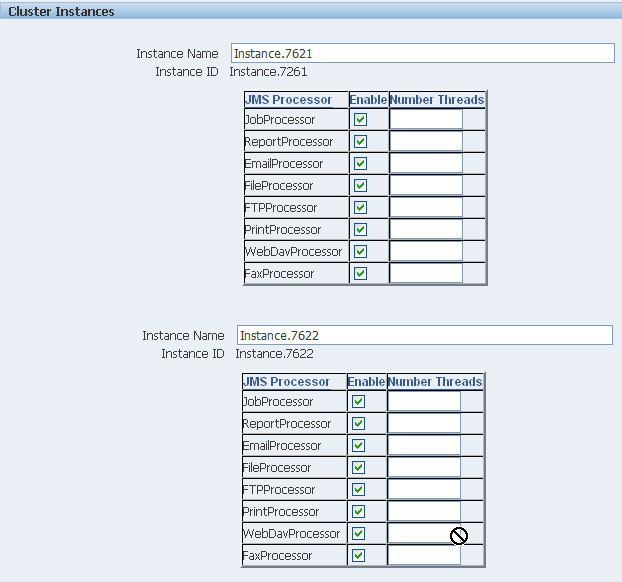
For each cluster instance that you have configured, a processor configuration table is displayed. Use the tables to enable and disable processors and specify threads for each processor.
The default number of threads for each processor is set by the Threads per JMS Processor property under JMS Configuration, as shown in the figure below. Edit the threads for a specific processor in the Cluster Instances region by updating the Number Threads setting. Note that processors that use the default setting show no entry in the table. Enter a Number Threads value only to set a thread count for a particular processor to differ from the default. The optimum number of threads per processor depends on the requirements of the system.
You can use the Scheduler Diagnostics page to help in assessing load in the system. See Scheduler Diagnostics.
Adding Managed Servers
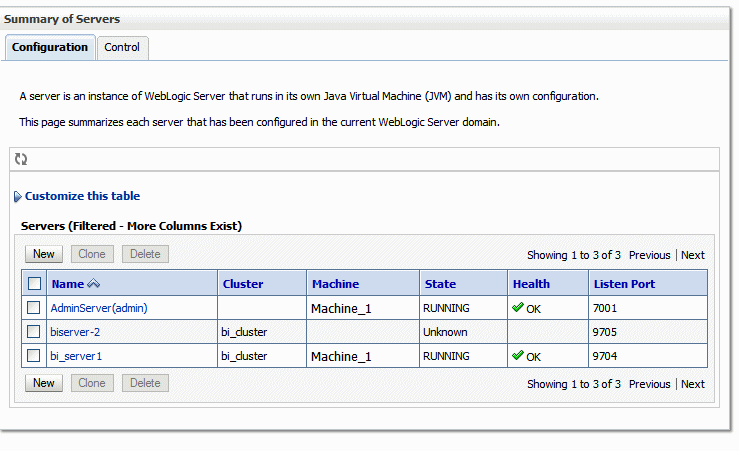
Add managed servers in the Oracle WebLogic Administration Console and then configure the cluster instances in the Administration page.
Adding a Managed Server
You manage servers in the Oracle WebLogic Administration Console.
See Oracle WebLogic Server Administration Console Online Help and Administering Oracle Fusion Middleware.
To add a managed server:
Scheduler Diagnostics
The Scheduler diagnostics page provides the runtime status of the scheduler. It provides status of its JMS configuration, JMS queues, Cluster instance status, Scheduler Database status, Toplink status, and Scheduler (Quartz) status.
The Diagnostics page displays how many scheduled report requests have been received by the JMS queues, how many of them have failed and how many are still running. The JMS status can be viewed at the cluster-instance level enabling you to decide whether to add more instances to scale up by one or more of these JMS processors.
For example, if there are too many requests queued up for the e-mail processor in one instance, you can consider adding another instance and enabling it to handle e-mail processing. Similarly, if there are very large reports being processed and showing in the Report Process queue in running status, then you can add another instance to scale up the Report Process capability.
Also, the Scheduler Diagnostics page reflects the status of each component to show if any component is down. You can see the connection string or JNDI name to the database, which cluster instance associates to which managed server instance, Toplink connection pool configuration, and so on.
If an instance shows a failed status, then you can recover the instance and with the failover mechanism of the JMS set up in the cluster, no jobs submitted are lost. When the server instance is brought back, it is immediately available in the cluster for service. The instance removal and addition reflects dynamically on the diagnostic page.
When an instance is added to the cluster, the Scheduler Diagnostics page immediately recognizes the new instance and displays the status of the new instances and all the threads running on that instance. This provides a powerful monitoring capability to the administrator to trace and resolve issues in any instance or any component of the scheduler.
The Scheduler Diagnostics page provides information on the following components:
-
JMS
-
Cluster
-
Database
-
Scheduler Engine
The JMS section provides information on the following:
-
JMS Cluster Config: This section provides configuration information for JMS setup:
-
Provider type (Weblogic / ActiveMQ)
-
WebLogic version
-
WebLogic JNDI Factory
-
JNDI URL for JMS
-
Queue names
-
Temporary directory
-
-
JMS Runtime: This provides runtime status of all JMS queues and topics, as shown in the table below.
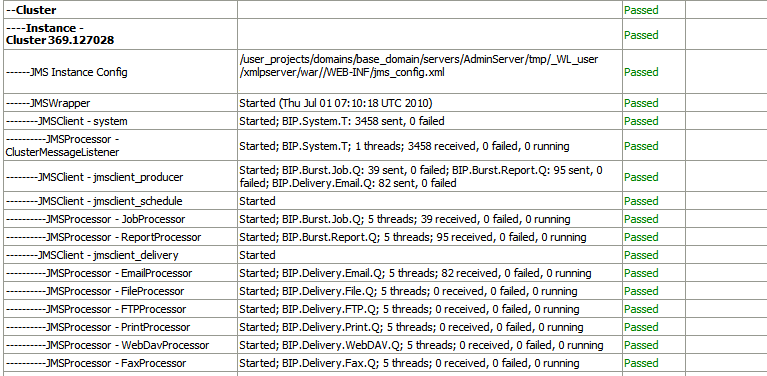
The Cluster section provides details on the cluster instance, as shown in the figure below. Use this information to understand the load on each processor.
-
JMS instance config
-
JMS Wrapper
-
JMS Client - System — Provides status of the BIP System topic. The scheduler diagnostic page is a subscriber to this topic.
-
JMS Client_producer — Not used in this release.
-
JMS Client_schedule — Provides status of the job processor and report processor, each processor showing number of active threads, number of messages received, number of messages failed, and number of messages running.
-
JMS Client_delivery — Provides status of different delivery processors as listeners, each delivery processor showing number of active threads, number of messages received, number of messages failed, and number of messages running.
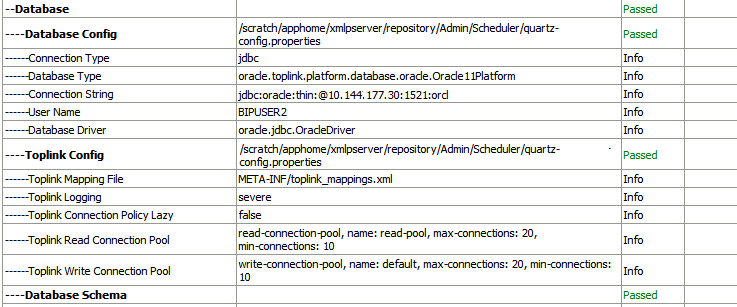
The Database section provides information on these components, as shown in the figure below.
-
Database Config — Connection type, JNDI Name, or connection string
-
Toplink Config — Connection pooling, logging level
-
Database Schema
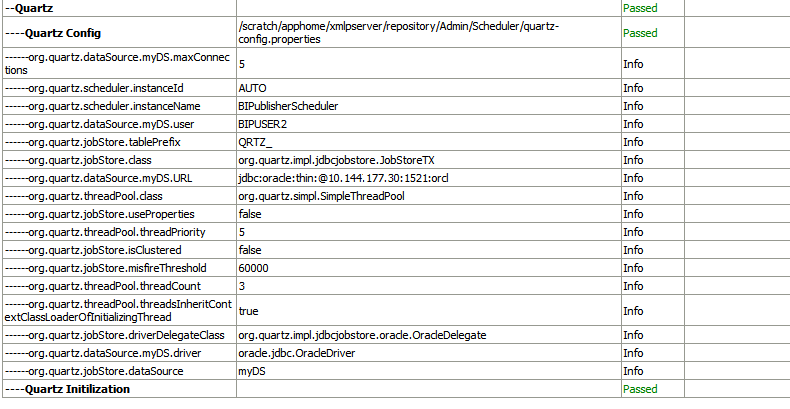
The Quartz section provides information on these components, as shown in the figure below.
-
Quartz Configuration
-
Quartz Initialization
Resolving Quartz Configuration Errors
The following is a common Quartz configuration error in the Scheduler Diagnostics page:
Error Description and Resolution
During the BI Publisher start up (when the WebLogic Managed server or Admin server are started) if the JNDI data source configured as jdbc/bip_datasource is unavailable, then the Quartz initialization will fail. The Scheduler Diagnostics page displays an error for Quartz Configuration.
If this occurs, perform the following:
- Verify that the data source configured as
jdbc/bip_datasourceis available. On the Scheduler Configuration page, click Test Connection to ensure the connection is working. - On the Scheduler Diagnostics page, locate the "Database Schema" diagnostics item and ensure it passed.
- Go back to the Scheduler Configuration page and change the Scheduler Selection from "Quartz" to "None" and click Apply. Now change it back to "Quartz" and click Apply again.
- On the Scheduler Diagnostics page, verify that the Quartz error has cleared.
