30 Testing and Debugging MAF Applications
This chapter provides information on testing and debugging MAF applications developed for both iOS and Android platforms.
This chapter includes the following sections:
30.1 Introduction to Testing and Debugging MAF Applications
Before you start any testing and debugging of your MAF application, you must deploy it to one of the following:
-
iOS-powered device
-
iOS-powered device simulator
-
Android-powered device
-
Android-powered device emulator
You cannot run the MAF application until it is deployed. For more information, see Chapter 27, "Deploying MAF Applications."
To test and debug a MAF application, you generally take the following steps:
-
Test the application's infrastructure, such as a splash screen, application feature navigation, authentication, and preferences, ensuring that all declared application features are available.
-
If the application includes MAF AMX content, test this application feature's logic, page flows, data controls, and UI components.
-
Make changes to the application as necessary.
-
Reconnect the mobile device or restart the simulator, and then deploy and run the application for further testing and debugging.
30.2 Testing MAF Applications
There are two approaches to testing a MAF application:
-
Testing on a mobile device: this method always provides the most accurate behavior, and is also necessary to gauge the performance of your application. However, you may not have access to all the devices on which you want to test, making device testing inconclusive.
-
Testing on a mobile device emulator or simulator: this method usually offers better performance and faster deployment, as well as convenience. However, even though a device emulator or simulator closely approximates the corresponding physical device, there might be differences in behavior and limitations on the capabilities that can be emulated.
Typically, a combination of both approaches yields the best results.
30.2.1 How to Perform Accessibility Testing on iOS-Powered Devices
You should use a combination of the following methods to test the accessibility of your MAF application developed for iOS-powered devices:
-
Testing with the Accessibility Inspector on an iOS-powered device simulator.
For detailed information, see the "Testing the Accessibility of Your iPhone Application" section in the Accessibility Programming Guide for iOS available through the iOS Developer Library.
-
Testing with the VoiceOver on an iOS-powered device.
For more information, see the "Using VoiceOver to Test Your Application" section in the Accessibility Programming Guide for iOS available through the iOS Developer Library.
30.3 Debugging MAF Applications
JDeveloper is equipped with debugging mechanisms that allow you to execute a Java program in debug mode and use standard breakpoints to monitor and control execution of an application. For more information, see the section on debugging applications in Oracle Fusion Middleware Developing Applications with Oracle JDeveloper.
Since a MAF application cannot be run inside JDeveloper, the debugging approach is different: you can use the JDeveloper debugger to connect to a Java Virtual Machine instance on a mobile device or simulator and control the Java portions of your deployed MAF application.
MAF automatically configures the project properties for debugging (see Section 30.3.1, "What You May Need to Know About the Debugging Configuration"). The following are the steps you need to take to use JDeveloper to debug the Java code in your MAF application:
To test or debug an application:
-
From JDeveloper's main menu, click Run > Choose Active Run Configuration to select an active run configuration.
-
In the Applications window, right-click on any file that you want to test and choose Run.
Alternatively, choose Debug if you want to run the application with debugging enabled.
Tip:
You can also open any file in the MAF application in Source view, right-click on it, and then select Run or Debug.Note:
If you are using an existing application that does not have the predefined set of run configurations, you can create new run configurations (see Section 30.3.1, "What You May Need to Know About the Debugging Configuration").
For additional information, see the following:
30.3.1 What You May Need to Know About the Debugging Configuration
When a new MAF application is created, the creation wizard automatically configures the application properties for debugging. This includes the creation of default run configurations that may be used to run or debug the MAF application on an iOS simulator or Android emulator or device. These run configurations allow you to build, deploy, run, or debug a MAF application by clicking the JDeveloper Run or Debug buttons. When you click the Run or Debug button in JDeveloper and select a MAF run configuration, the deployment profile associated with the run configuration is executed to build and deploy the application to the targeted device. Once the application has been deployed, it automatically starts. If the Debug button was selected, the application will start with the debugger.
For information on how to create and edit run configurations, see Section 30.3.1.1, "Creating and Configuring a Run Configuration."
30.3.1.1 Creating and Configuring a Run Configuration
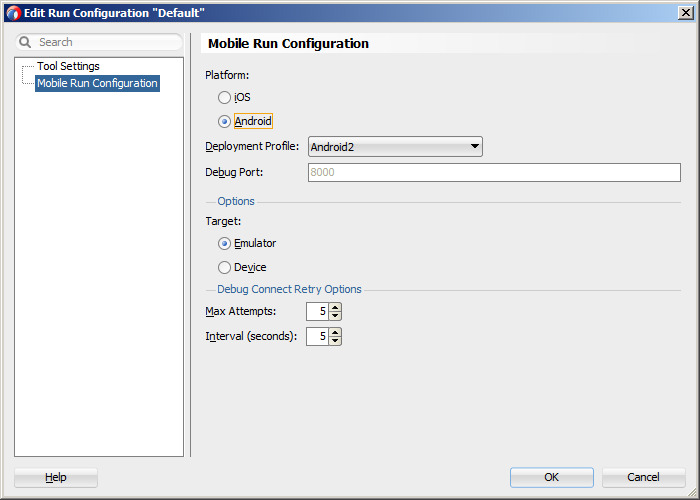
To create a new configuration or to modify an existing one, complete the Edit Run Configuration dialog (see Figure 30-1) as follows:
-
From JDeveloper's main menu, click Application > Project Properties to open the Project Properties dialog.
-
In the Project Properties dialog, select the Run/Debug node from the tree on the left.
Alternatively, choose Run > Choose Active Run Configuration > Manage Run Configurations.
-
Create a new configuration or modify an existing one.
If using Shared Settings, click Edit Shared Settings to open a dialog that allows you to create or edit new MAF run configurations. If using Project Settings, click New or Edit. With shared settings, the run configurations are shared across all projects. Use Shared Settings is the default option so you can use the MAF run configurations that exist at the time the project was added.
-
Complete the Edit Run Configuration dialog as follows:
-
Select Mobile Run Configuration from the tree on the left.
-
Select your target platform.
-
Select a deployment profile.
-
Enter the port number, up to five digits long. This number is initially seeded with the value of the
java.debug.port propertycontained in themaf.propertiesfile and appears as hint text. If a value is not specified for the port, the seeded value is used. -
For iOS, set the following options:
-
Application Arguments—Enter arguments that can be passed to the MAF application upon startup for customizing the runtime behavior of the application. For example,
-consoleRedirect=/<path>/<to>/log.txtdirects the log output to the file specified. The path must be an absolute path to receive the log file. The location must be writable for the current user. -
Simulator—Choose which simulator you are deploying the application to. The options depend on which versions of the iOS SDK have been installed.
-
iOS version—Choose which version of iOS the simulator should use. The the dropdown menu displays the iOS versions that the selected device supports.
-
-
For Android, set the following options:
-
Target—Select the deployment target (Emulator or Device).
-
Max Attempts—Choose the maximum number of connection attempts to allow.
-
Interval (seconds)— Choose the length of time in seconds between connection attempts.
Tip:
If the Android device or emulator is slow or times out, try increasing the Max Attempts or the Interval to allow sufficient time for Java to initialize and to force the Android starter to wait longer or try more attempts before quitting.
-
-
30.3.2 How to Debug on the iOS Platform
To debug a MAF application on the iOS platform using JDeveloper, follow the debugging procedure described in Section 30.3, "Debugging MAF Applications."
For information on how to configure an iOS-powered device or simulator and how to deploy a MAF application for debugging, see the following:
30.3.3 How to Debug on the Android Platform
To debug a MAF application on the Android platform using JDeveloper, follow the debugging procedure described in Section 30.3, "Debugging MAF Applications."
For information on how to configure an Android-powered device or emulator and how to deploy a MAF application for debugging, see Section 27.3.1, "How to Deploy an Android Application to an Android Emulator."
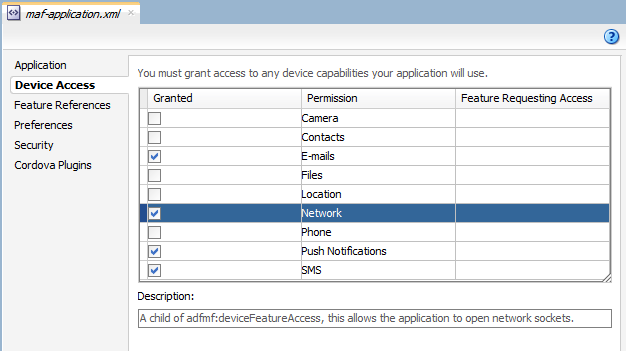
To allow debugging of a MAF application running on an Android-powered device or its emulator, you enable the Network device access option in the maf-application.xml file, as Figure 30-2 shows.
30.3.4 How to Debug the MAF AMX Content
If your MAF application includes the MAF AMX content, after you configure the device or emulator, you can set breakpoints, view the contents of variables, and inspect the method call stack just as you would when debugging other types of applications in JDeveloper.
Note:
You can only debug your Java code and JavaScript (see Section 30.3.5, "How to Enable Debugging of Java Code and JavaScript"). Debugging of EL expressions or other declarative elements is not supported.30.3.5 How to Enable Debugging of Java Code and JavaScript
A maf.properties file allows you to specify startup parameters for the JVM and web views of MAF to enable debugging of the Java code and JavaScript. The maf.properties file is automatically created and placed in the Descriptors/META-INF directory under the Application Resources (see Section 30.4, "Using and Configuring Logging"), which corresponds to the <application_name>/src/META-INF location in your application file system.
When you execute a MAF run configuration, the following debugging properties are automatically set in the maf.properties file:
-
java.debug.enabled: Set totrueif doing a debug session; set tofalseif doing a run session.Caution:
Whenjava.debug.enabledis set totrue, the JVM waits for a debugger to establish a connection to it. Failure of the debugger to connect will result in the failure of the MAF AMX application feature to load. -
java.debug.port: Set to the port number configured in the MAF run configuration being executed. -
javascript.debug.enabled: Set totrueif doing a debug session; set tofalseif doing a run session. Applies to Android only.Note:
Thejavascript.debug.enabledproperty is not required for enabling JavaScript debugging when the MAF application is running on an iOS-powered simulator or iOS-powered device.
The contents of the maf.properties file may be similar to the following:
java.debug.enabled=true
java.debug.port=8000

javascript.debug.enabled=true
For information on how to use JDeveloper to debug the Java code, see Section 30.3, "Debugging MAF Applications."
30.3.5.1 What You May Need to Know About Debugging of JavaScript Using an iOS-Powered Device Simulator on iOS 7 and iOS 8 Platforms
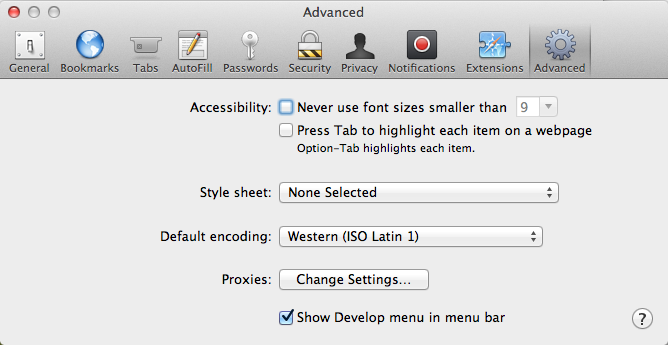
If you are working with the iOS 7 or 8 platform, you can use the Safari browser to debug JavaScript. To do so, open the Safari preferences, select Advanced, and then enable the Develop menu in the browser by selecting Show Develop menu in menu bar, as shown in Figure 30-3.
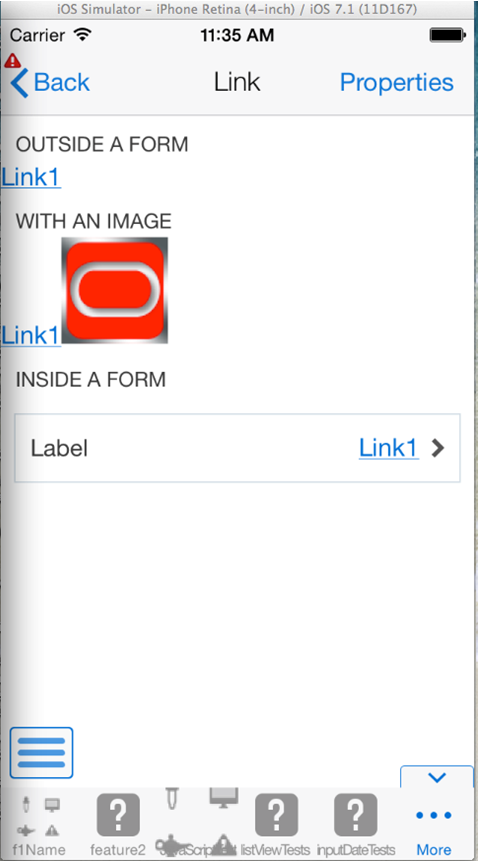
When the Develop menu is enabled, select either iPhone Simulator or iPad Simulator, as Figure 30-4 and Figure 30-5 show, and then select a UIWebView that you are planning to debug, as Figure 30-6 shows.
Note:
Whether the Develop menu displays an iPhone Simulator or iPad Simulator option depends on which device simulator is launched.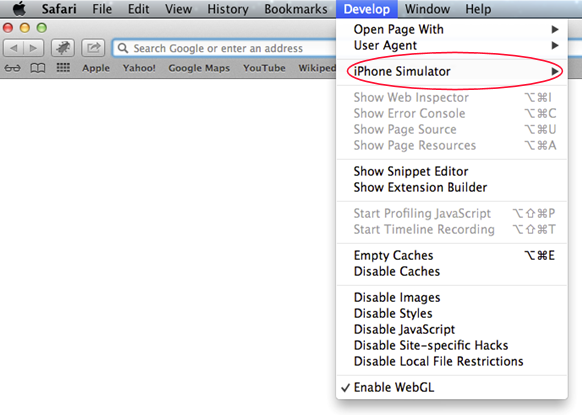
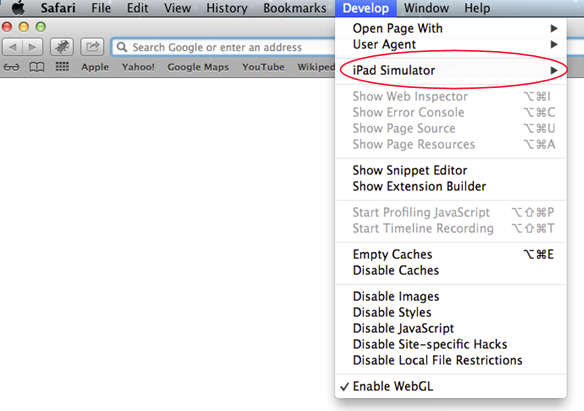
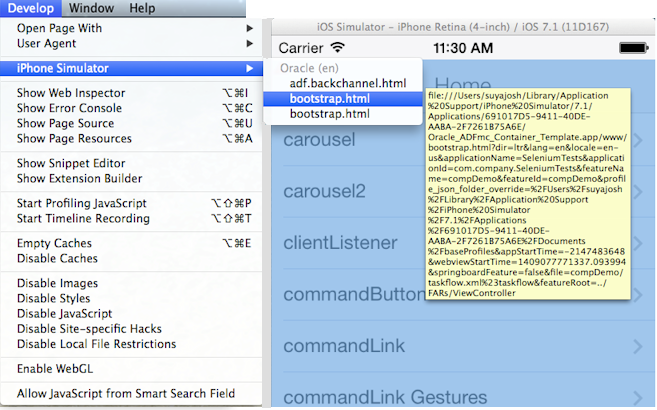
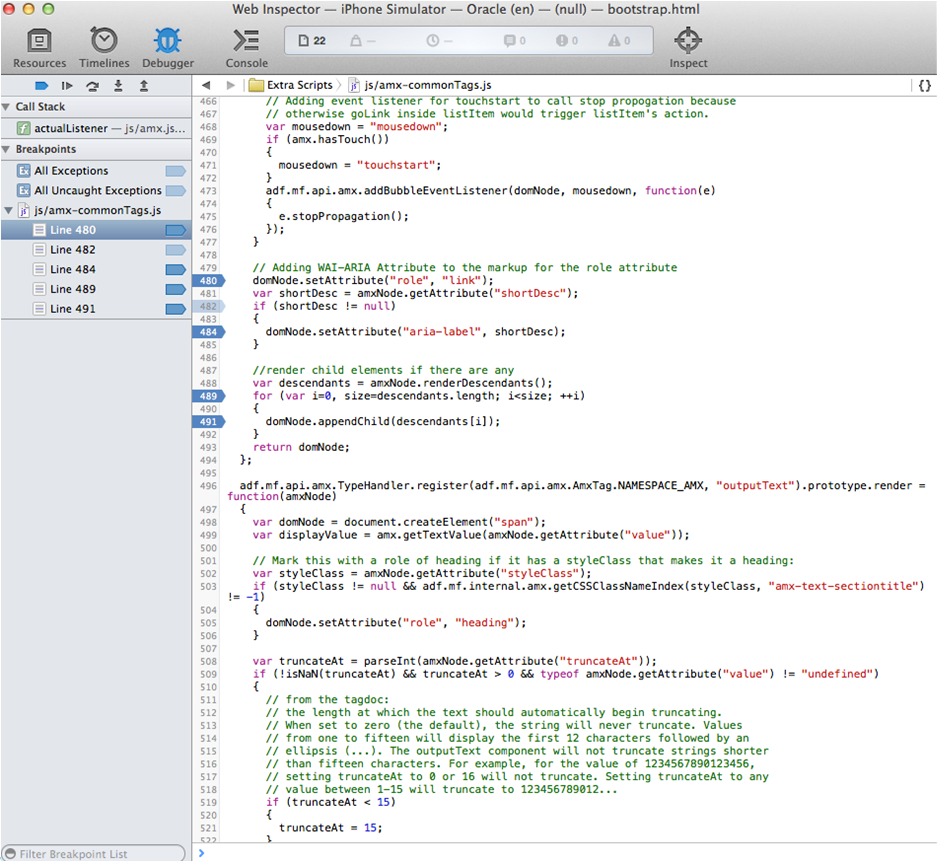
Figure 30-7 and Figure 30-8 show the CSS, DOM, and HTML Safari Remote Web Inspector in action.
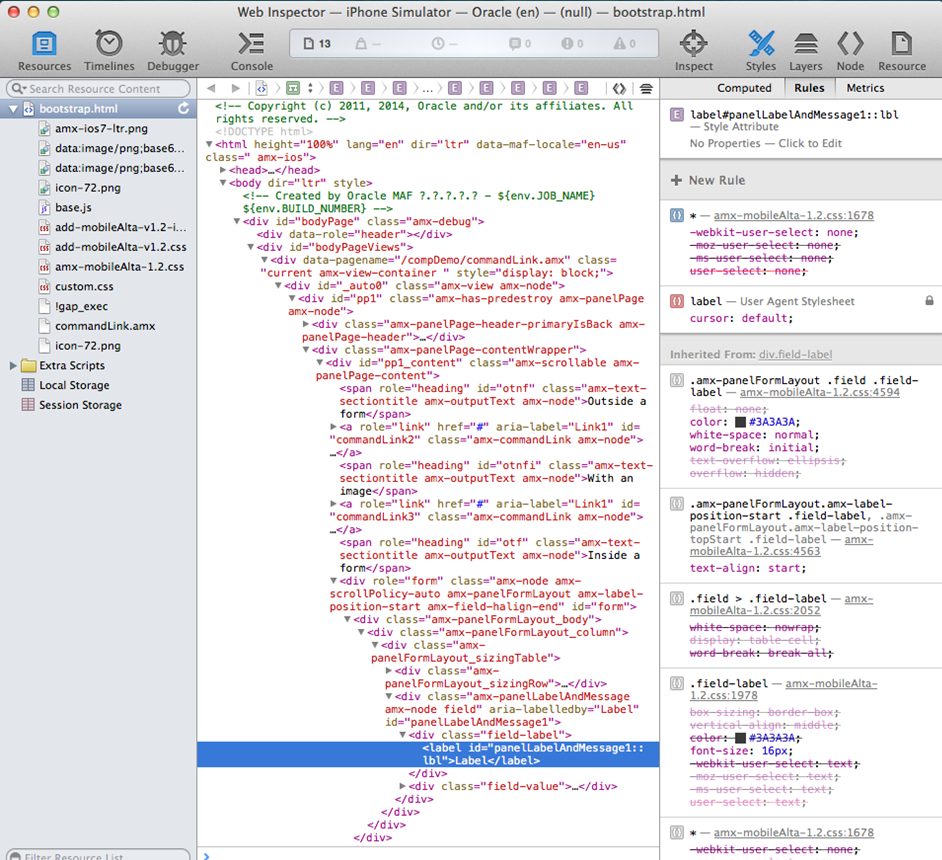
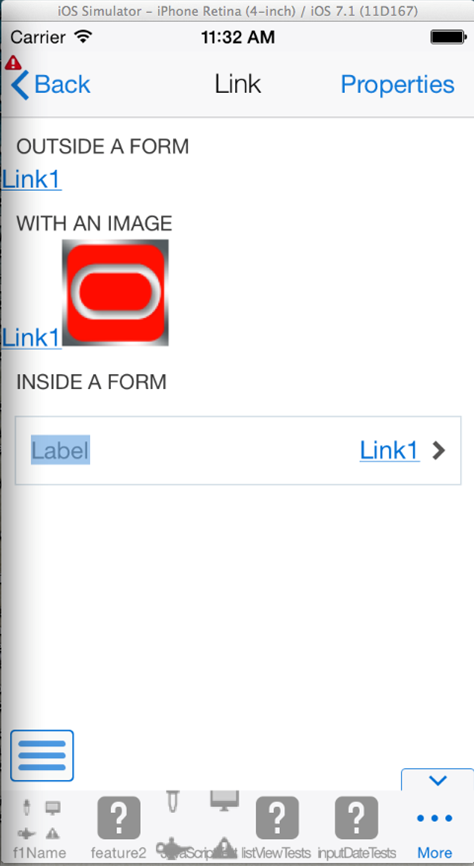
Figure 30-9 and Figure 30-10 show JavaScript debugging using breakpoints inside the Safari browser.
30.4 Using and Configuring Logging
For your MAF application, you can enable logging on all supported platforms through JavaScript (see Section 30.4.2, "How to Use JavaScript Logging") and embedded code (see Section 30.4.3, "How to Use Embedded Logging") using a single configuration with the log output directed to a single file. This log output includes the output produced by System.out.println and System.err.println statements.
The default MAF's logging process is as follows:
-
The logging begins at application startup.
-
The existing log file from the previous application run is deleted, so only the contents of the current run are available.
-
When you are running your application on an iOS-powered device simulator, you can only access the Java logging output through a file of whose name and location you are notified as soon as the output redirection occurs and the file is generated. One of the typical locations for this file is
/Users/<userid>/Library/Developer/CoreSimulator/Devices/<device_id>/data/Containers/Data/Application/<container_id>/application.log, where<device_id>and<container_id>references represent long UUID strings created by iOS during the installation of the application. The values of these references cannot be predicted and when multiple simulators or applications are installed, it is difficult to determine which folder corresponds with the simulator used during deployment. Therefore, it is recommended to use the-consoleRedirect=/<path>/<to>/log.txtto direct the log output to a known location.Note:
The path must be an absolute path to receive the log file and the location must be writable for the current user.When you are running your application on an iOS-powered device, the console output is redirected to an
application.logfile that is placed in theDocuments/logsdirectory of your application.On Android, the output is forwarded to a text file with the same name as the application. The output file location is
/sdcard. If this location is not present or is configured as read-only, the log output is rerouted to the application's writable data directory. -
The
logging.propertiesfile is automatically created and placed in theDescriptors/META-INFdirectory under the Application Resources (see Section 30.4, "Using and Configuring Logging"), which corresponds to the<application_name>/src/META-INFlocation in your application file system. In this file, it is defined that all loggers use thejava.util.logging.ConsoleHandlerandSimpleFormatter, and the log level is set toSEVERE. You can edit this file to specify different logging behavior (see Section 30.4.1, "How to Configure Logging Using the Properties File").Note:
In your MAF application, you cannot use loggers from thejava.util.loggingpackage.
MAF loggers are declared in the oracle.adfmf.util.Utility class as follows:
public static final String APP_LOGNAME = "oracle.adfmf.application";
public static final Logger ApplicationLogger = Logger.getLogger(APP_LOGNAME);

public static final String FRAMEWORK_LOGNAME = "oracle.adfmf.framework";
public static final Logger FrameworkLogger = Logger.getLogger(FRAMEWORK_LOGNAME);
The logger that you are to use in your MAF application is the ApplicationLogger.
You can also use methods of the oracle.adfmf.util.logging.Trace class.
For more information, see Oracle Fusion Middleware Java API Reference for Oracle Mobile Application Framework.
30.4.1 How to Configure Logging Using the Properties File
The following example shows the logging.properties file that you use to configure logging.
# default - all loggers to use the ConsoleHandler
.handlers=java.util.logging.ConsoleHandler
# default - all loggers to use the SimpleFormatter
.formatter=java.util.logging.SimpleFormatter

oracle.adfmf.util.logging.ConsoleHandler.formatter=
             oracle.adfmf.util.logging.PatternFormatter
oracle.adfmf.util.logging.PatternFormatter.pattern=
             [%LEVEL%-%LOGGER%-%CLASS%-%METHOD%]%MESSAGE%

#configure the framework logger to only use the adfmf ConsoleHandler
oracle.adfmf.framework.useParentHandlers=false
oracle.adfmf.framework.handlers=oracle.adfmf.util.logging.ConsoleHandler
oracle.adfmf.framework.level=SEVERE

#configure the application logger to only use the adfmf ConsoleHandler
oracle.adfmf.application.useParentHandlers=false
oracle.adfmf.application.handlers=oracle.adfmf.util.logging.ConsoleHandler
oracle.adfmf.application.level=SEVERE
The oracle.adfmf.util.logging.ConsoleHandler plays the role of the receiver of the custom formatter.
The oracle.adfmf.util.logging.PatternFormatter allows the following advanced formatting tokens that enable log messages to be printed:
-
%LEVEL%—the logging level. -
%LOGGER%—the name of the logger to which the output is being written. -
%CLASS%—the class that is being logged. -
%METHOD%—the method that is being logged. -
%TIME%—the time the logging message was sent. -
%MESSAGE%—the actual message.
The following logging levels are available:
-
SEVERE: this is a message level indicating a serious failure. -
WARNING: this is a message level indicating a potential problem. -
INFO: this is a message level for informational messages. -
FINE: this is a message level providing tracing information. -
FINER: this level indicates a fairly detailed tracing message. -
FINEST: this level indicates a highly detailed tracing message.
Caution:
When selecting the amount of verbosity for a logging level, keep in mind that by increasing the verbosity of the output at theSEVERE, WARNING, and INFO level negatively affects performance of your application.The logger defined in the logging.properties file matches the logger obtained from the oracle.adfmf.util.Utility class (see Section 30.4, "Using and Configuring Logging"). The logging levels also match. If you decide to use the logging level that is more fine-grained than INFO, you must change the ConsoleHandler's logging level to the same level, as the following example shows.
oracle.adfmf.util.logging.ConsoleHandler.formatter=
             oracle.adfmf.util.logging.PatternFormatter
oracle.adfmf.util.logging.ConsoleHandler.level=FINEST
oracle.adfmf.util.logging.PatternFormatter.pattern=
             [%LEVEL%-%LOGGER%-%CLASS%-%METHOD%]%MESSAGE%
30.4.2 How to Use JavaScript Logging
JavaScript writes the output to the console.log or.error/.warn/.info. This output is redirected into the file through the System.out utility.
You customize the log output by supplying a message. The following JavaScript code produces "Message from JavaScript" output:
<script type="text/javascript" charset="utf-8">
   function test_function() { console.log("Message from JavaScript"); }
</script>
To make use of the properties defined in the logging file, you need to use the adf.mf.log package and the Application logger that it provides.
The following logging levels are available:
-
adf.mf.log.level.SEVERE -
adf.mf.log.level.WARNING -
adf.mf.log.level.INFO -
adf.mf.log.level.CONFIG -
adf.mf.log.level.FINE -
adf.mf.log.level.FINER -
adf.mf.log.level.FINEST
To trigger logging, use the adf.mf.log.Application logger's logp method and specify the following through the method's parameters:
-
the logging level
-
the current class name as a String
-
the current method as a String
-
the message string as a String
The following example shows how to use the logp method in a MAF application.
adf.mf.log.Application.logp(adf.mf.log.level.WARNING,
                            "myClass",
                            "myMethod",
                            "My Message");
Upon execution of the logp method, the following output is produced:
[WARNING - oracle.adfmf.application - myClass - myMethod] My Message
For more information, see Oracle Fusion Middleware JSDoc Reference for Oracle Mobile Application Framework.
30.4.3 How to Use Embedded Logging
Embedded logging uses the java.util.logging.Logger, as illustrated in the following example. The EmbeddedClass represents a Java class defined in the project.
import java.util.logging.Level;
import java.util.logging.Logger;
import oracle.adfmf.util.logging.*;
...
   Utility.ApplicationLogger.logp(Level.WARNING,
                                  EmbeddedClass.class.getName(),
                                  "onTestMessage",
                                  "embedded warning message 1");
   Logger.getLogger(Utility.APP_LOGNAME).logp(Level.WARNING,
                    this.getClass().getName(),
                    "onTestMessage",
                    "embedded warning message 2");
   Logger.getLogger("oracle.adfmf.application").logp(Level.WARNING,
                                                this.getClass().getName(),
                                                "onTestMessage",
                                                "embedded warning message 3");
The preceding code produces the following output:
[WARNING - oracle.adfmf.application - EmbeddedClass - onTestMessage] embedded warning message 1
[WARNING - oracle.adfmf.application - EmbeddedClass - onTestMessage] embedded warning message 2
[WARNING - oracle.adfmf.application - EmbeddedClass - onTestMessage] embedded warning message 3
30.4.4 How to Use Xcode for Debugging and Logging on the iOS Platform
Even though it is not recommended to manipulate your MAF projects with Xcode because you can lose some or all of your changes during the next deployment with JDeveloper, you may choose to do so in exceptional circumstances.
Before you begin:
Deploy the application to the iOS simulator from JDeveloper.
To open the generated project directly in Xcode:
-
Navigate to the
workspace_directory\deploy\deployment profile name\temporary_xcode_project\. -
Open the Xcode project called
Oracle_ADFmc_Container_Template.xcodeproj.
If your development computer is running on Mac OS 10.8.n and you are debugging your MAF application using Xcode, you cannot see the Java output in the IDE (on either JDeveloper console or Xcode console). Instead, the output is redirected to a file (see Section 30.4, "Using and Configuring Logging"). By adding the following argument to your application's schema, you can disable this behavior and enable access to the Java, JavaScript, and Objective-C log output in Xcode in real time when debugging on either an iOS-powered device or its simulator:
-consoleRedirect=FALSE
30.4.5 How to Access the Application Log
Using the following APIs, you can access the application log information:
-
oracle.adfmf.framework.api.PerfMon -
oracle.adfmf.framework.api.LogEntry -
oracle.adfmf.util.HOTS
For more information, see Oracle Fusion Middleware Java API Reference for Oracle Mobile Application Framework.
30.4.6 How to Disable Logging
You can prevent the logging output from being directed to the application log file, in which case the log file either remains blank or is not created in the first place. When logging is disabled, trace statements are absent from the application log and any output directed to stderr and stdout is redirected to either a null location or other location that is not accessible to the end user.
To disable all logging, set the disableLogging property to true in the application's adf-config.xml file, as follows:
<adf-property name="disableLogging" value="true"/>
By default, logging is enabled in MAF applications and the disableLogging property is set to false.
For information on the adf-config.xml file, see Appendix C, "Introduction to MAF Application and Project Files."