附註:
- 此教學課程需要存取 Oracle Cloud。若要註冊免費帳戶,請參閱 Oracle Cloud Infrastructure Free Tier 入門。
- 它使用 Oracle Cloud Infrastructure 證明資料、租用戶及區間的範例值。完成實驗室時,請將這些值取代為您雲端環境特定的值。
使用 Google Cloud Monitoring 監控 Oracle Database@Google Cloud
簡介
Google Cloud Monitoring 可讓您使用自訂儀表板監控 Oracle Database@Google Cloud 資源。您可以使用 Google Cloud Monitoring 和可用的 Oracle Database@Google Cloud 指標和日誌建立自訂儀表板。
本教學課程將逐步介紹使用 Google Cloud Monitoring 檢視及使用 Oracle Database@Google Cloud 資源可用的監督度量的工作。
您可以使用 Google Cloud Monitoring,使用自訂儀表板和度量圖表和警示來監控您的 Oracle Database@Google Cloud 資源。
目標
以資料庫管理員或使用者身分:
-
使用 Google Cloud Monitoring 監控 Oracle Database@Google。
-
建立 Oracle Database@Google Cloud 的自訂監控儀表板。
必要條件
- 存取 Oracle Database@Google Cloud 中預先佈建的 Oracle Autonomous Database 執行處理。
作業 1:檢視 Google Cloud 中的可用度量
您可以使用 Google Cloud 主控台中的 Google Cloud Monitoring,檢視可用的 Oracle Database@Google Cloud 度量。
-
登入 Google Cloud 主控台,在搜尋列中輸入測量結果總管,然後按一下測量結果總管。

-
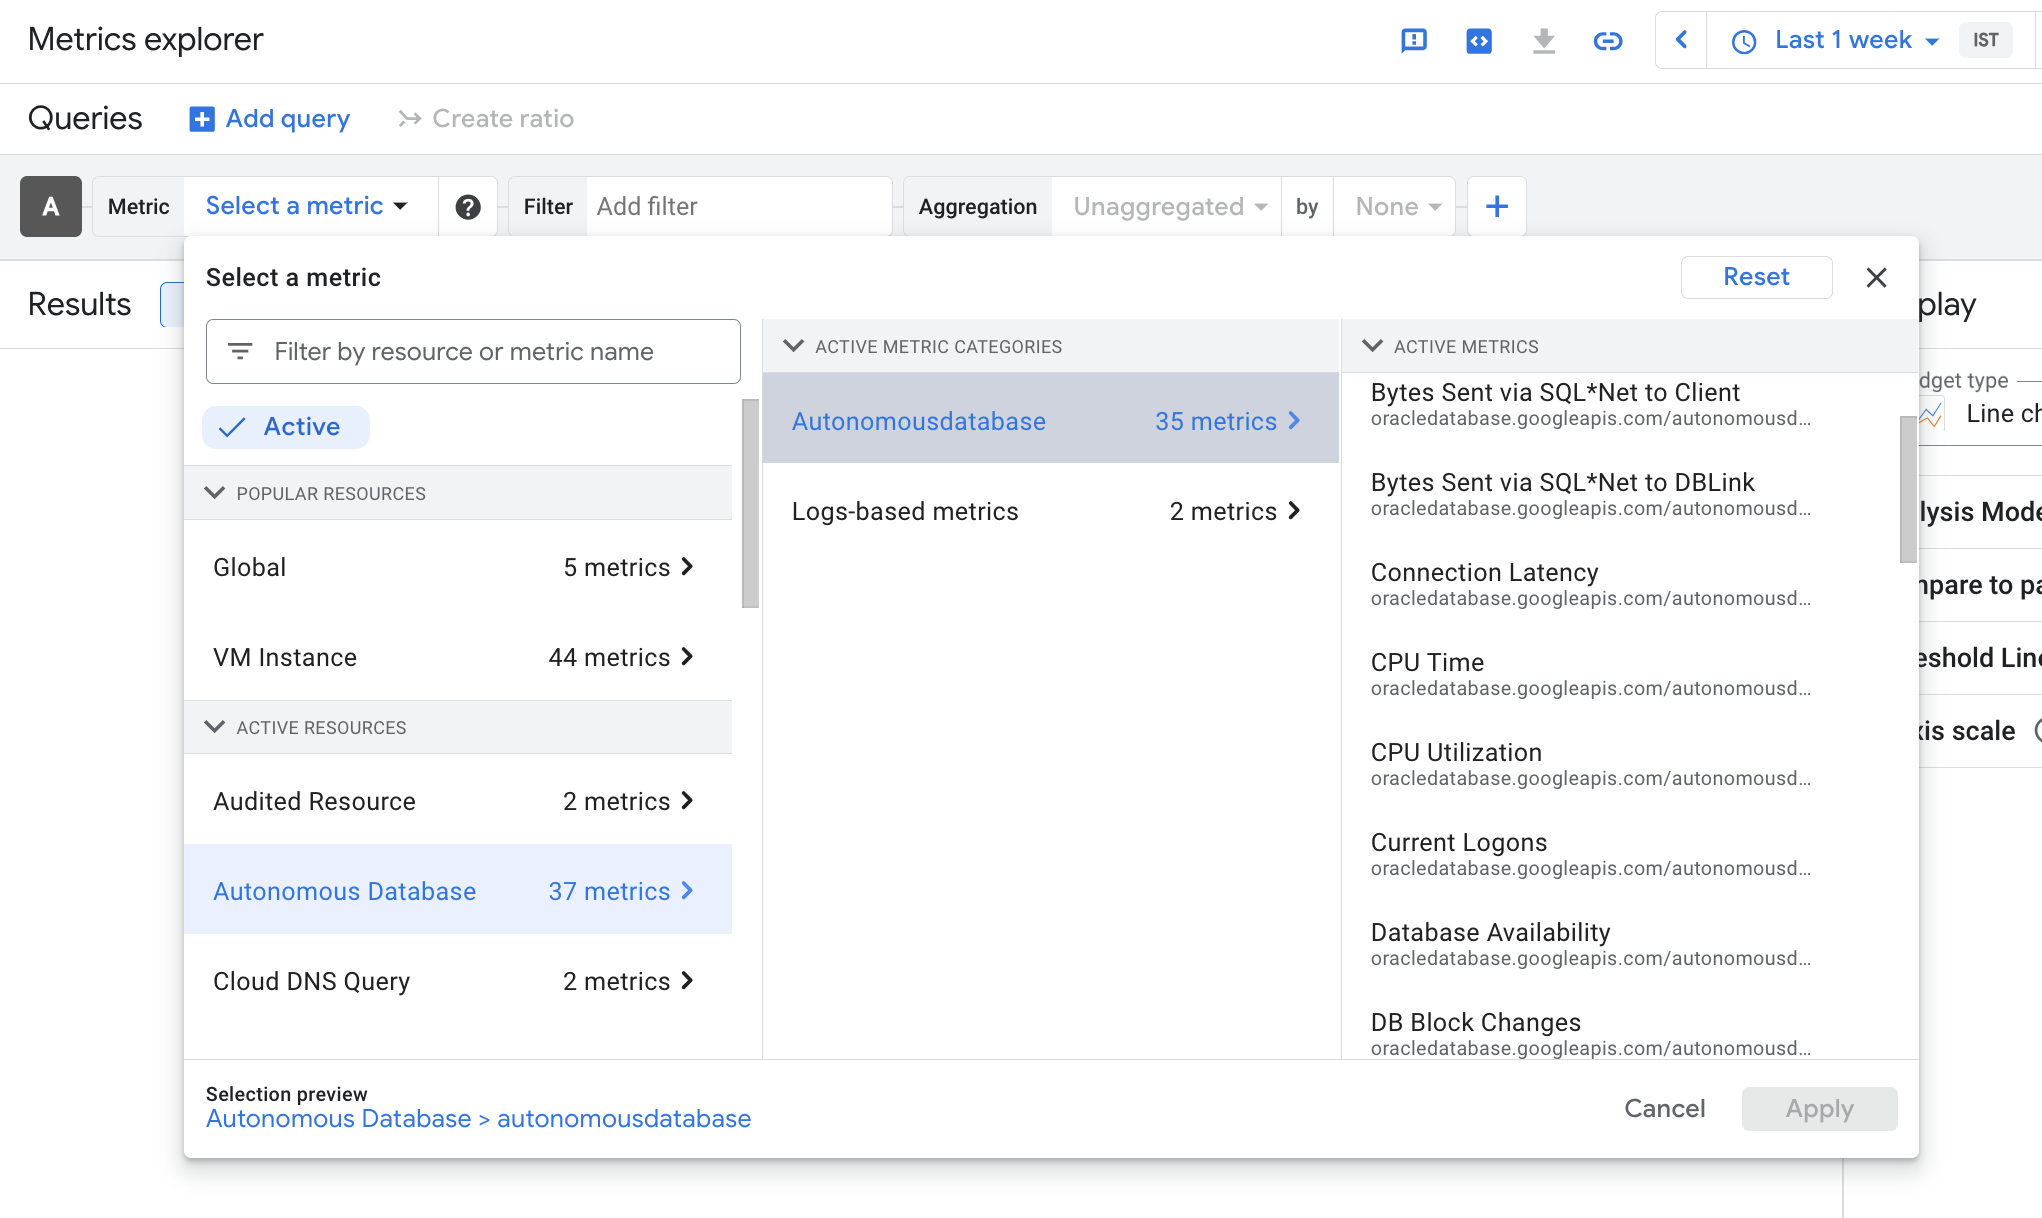
移至查詢段落,按一下選取測量結果下拉式功能表,然後選取 Autonomous Database 。按一下作用中方法類別下拉式功能表,然後選取自治式資料庫。按一下 ACTIVE METRICS 下拉式功能表,然後選取 CPU 使用量。
-
按一下套用。就會顯示測量結果。您可以選取結果窗格中的選項,以圖表、表格或兩者的方式檢視測量結果。

同樣地,自治式資料庫也可以檢視一些其他度量。
作業 2:使用 Google Cloud 監督儀表板建立自訂儀表板和監督器
-
前往 Google Cloud 主控台,瀏覽至可觀察性監控,然後按一下儀表板。
-
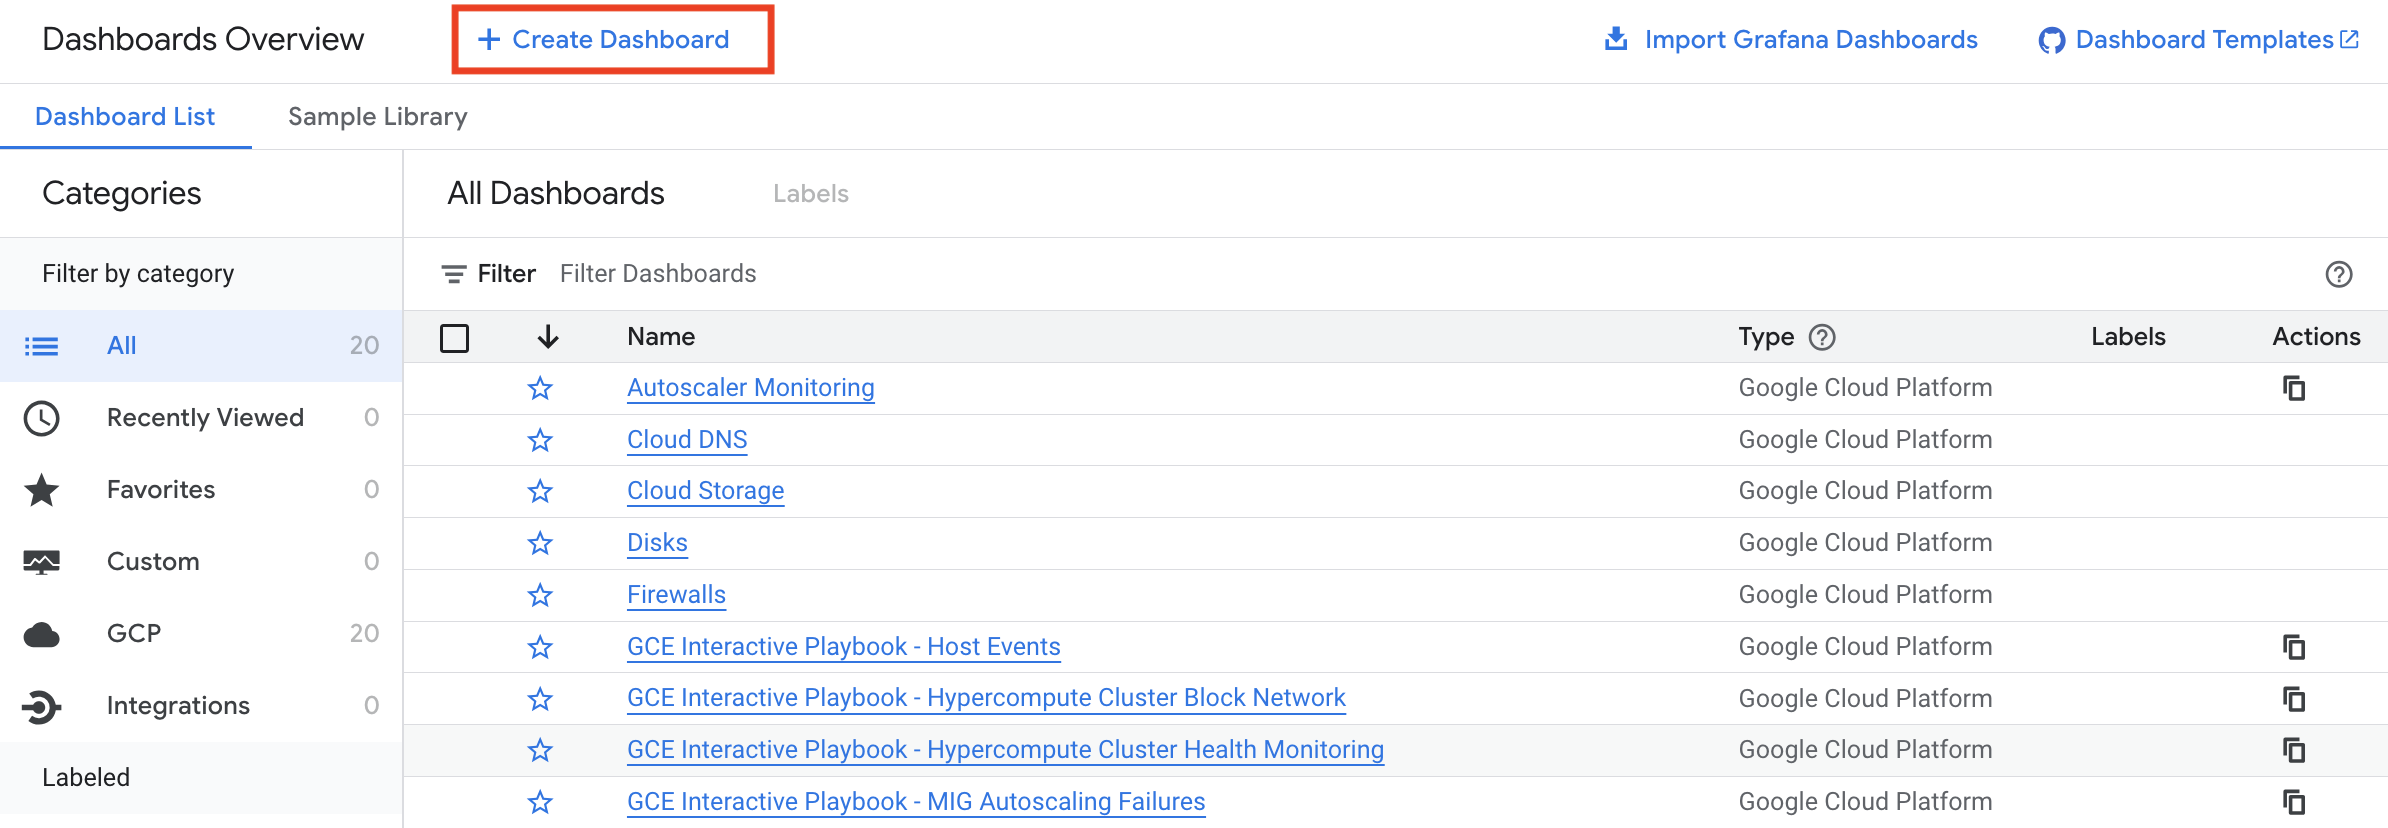
在儀表板總覽頁面中,按一下建立儀表板。
-
按一下新增小工具。
-
在新增小工具窗格中,選取要新增至儀表板的小工具。對於此範例,請選取測量結果。
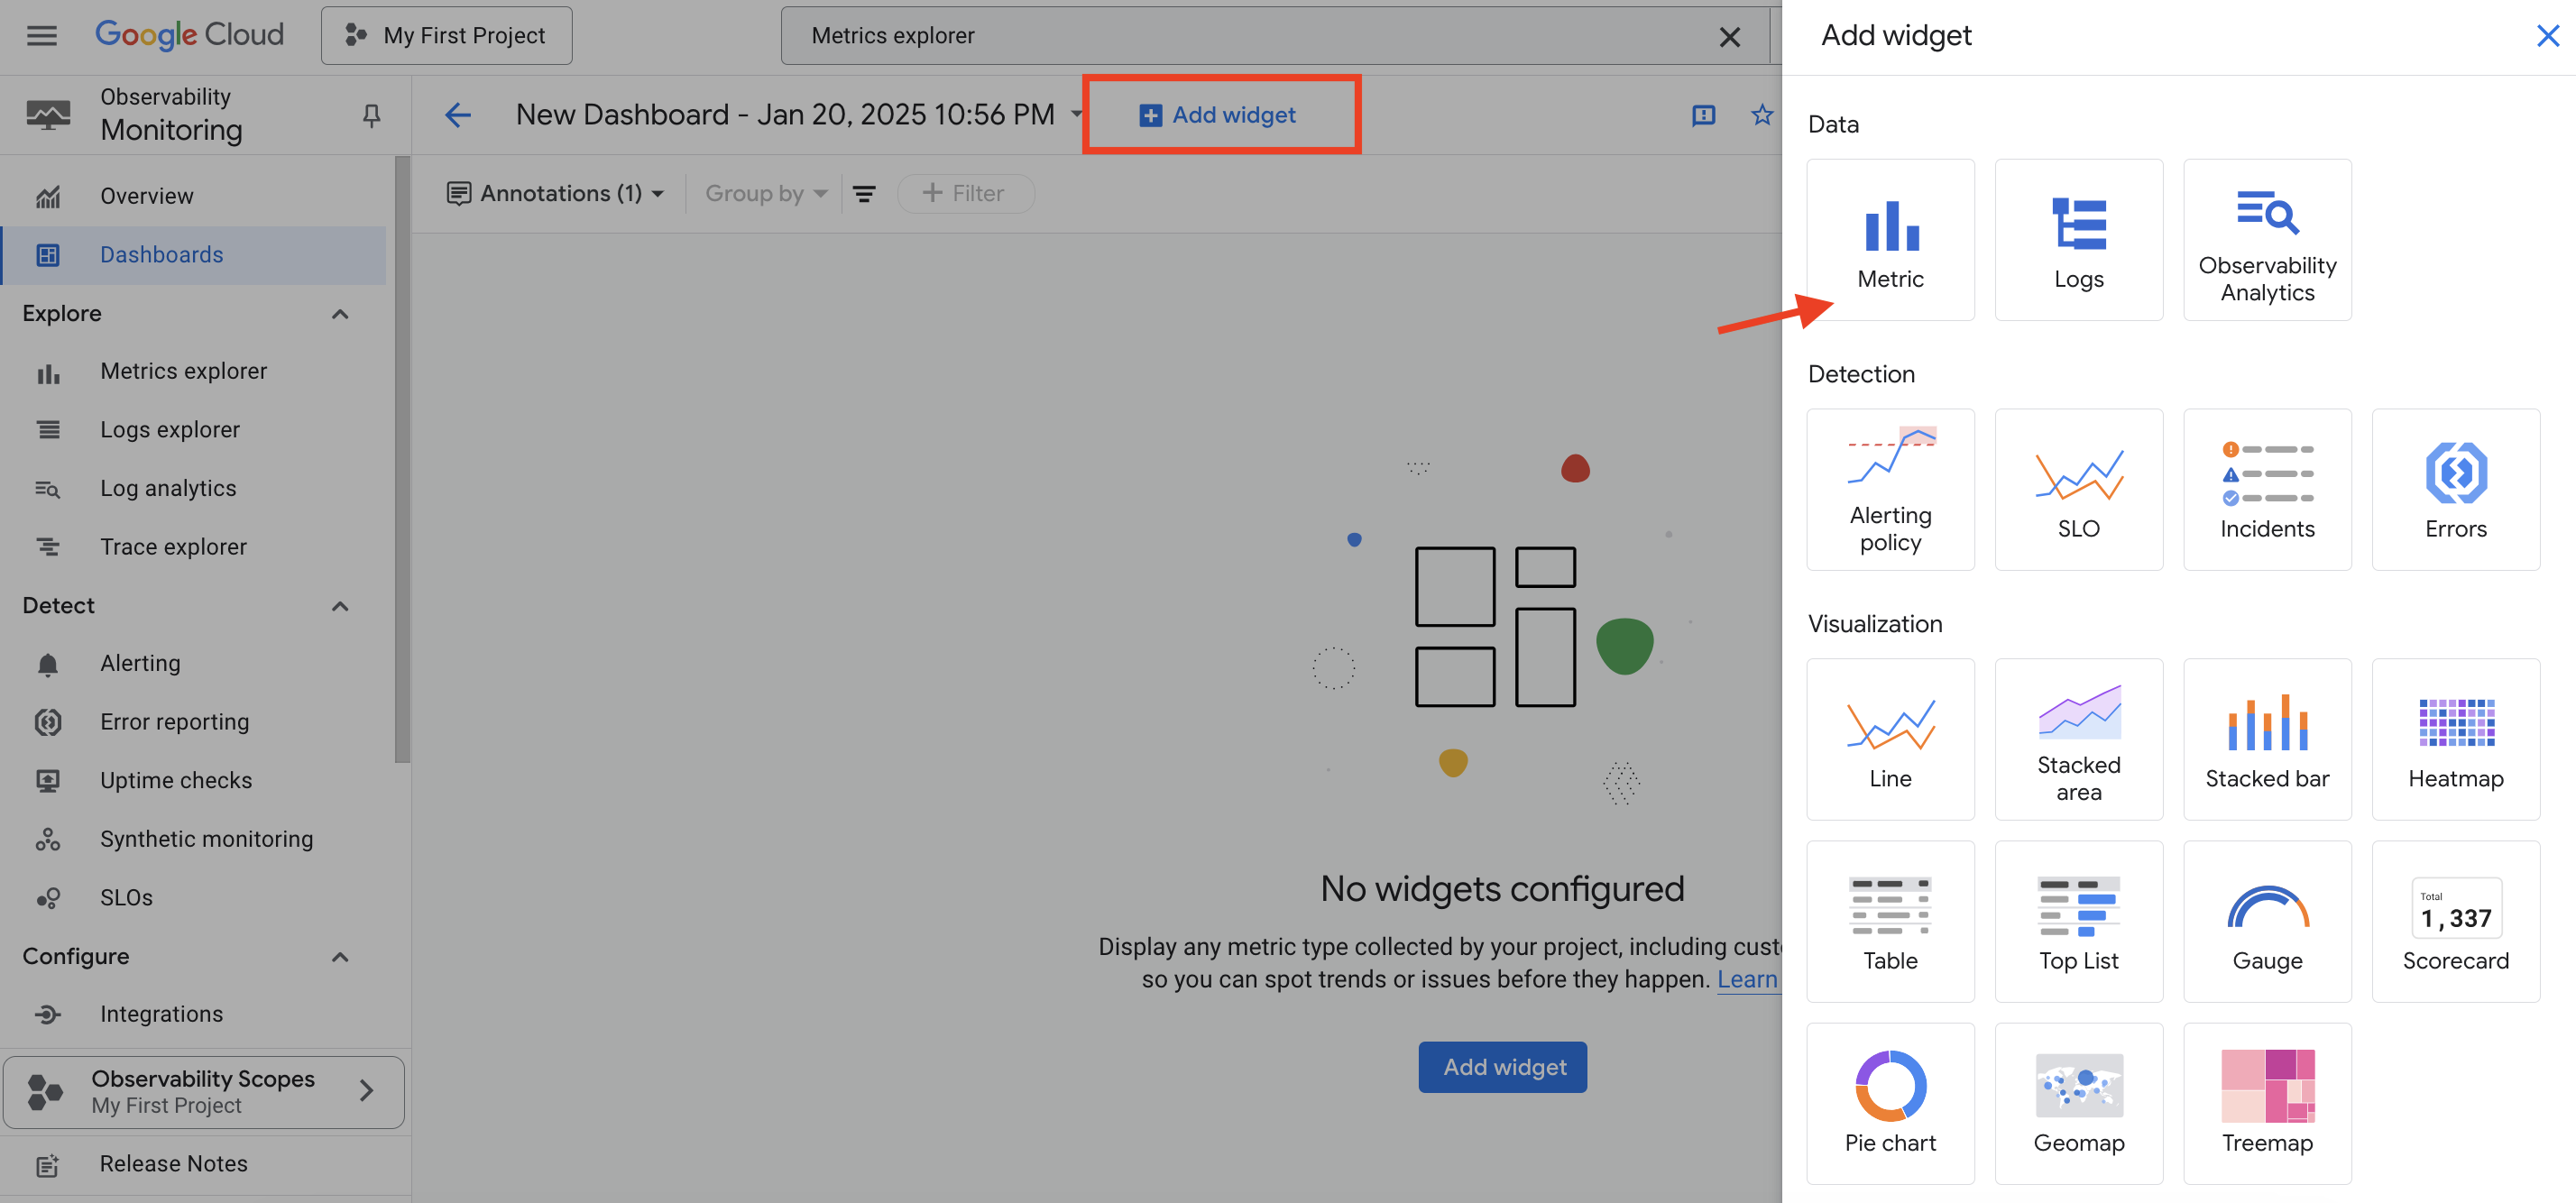
您可以根據要顯示的資料類型或要如何顯示資料來選取小工具。無論如何,都會開啟一個組態窗格。例如,您可以選取測量結果小工具,然後將視覺化設為堆疊區域。或者,您可以選取堆疊區域小工具,然後選取測量結果。
-
在設定小工具頁面中,按一下選取測量結果下拉式功能表,然後選取 Autonomous Database 。在作用中計量底下,選取 CPU 使用量,然後按一下套用。

-
按一下套用,將小工具新增至儀表板。
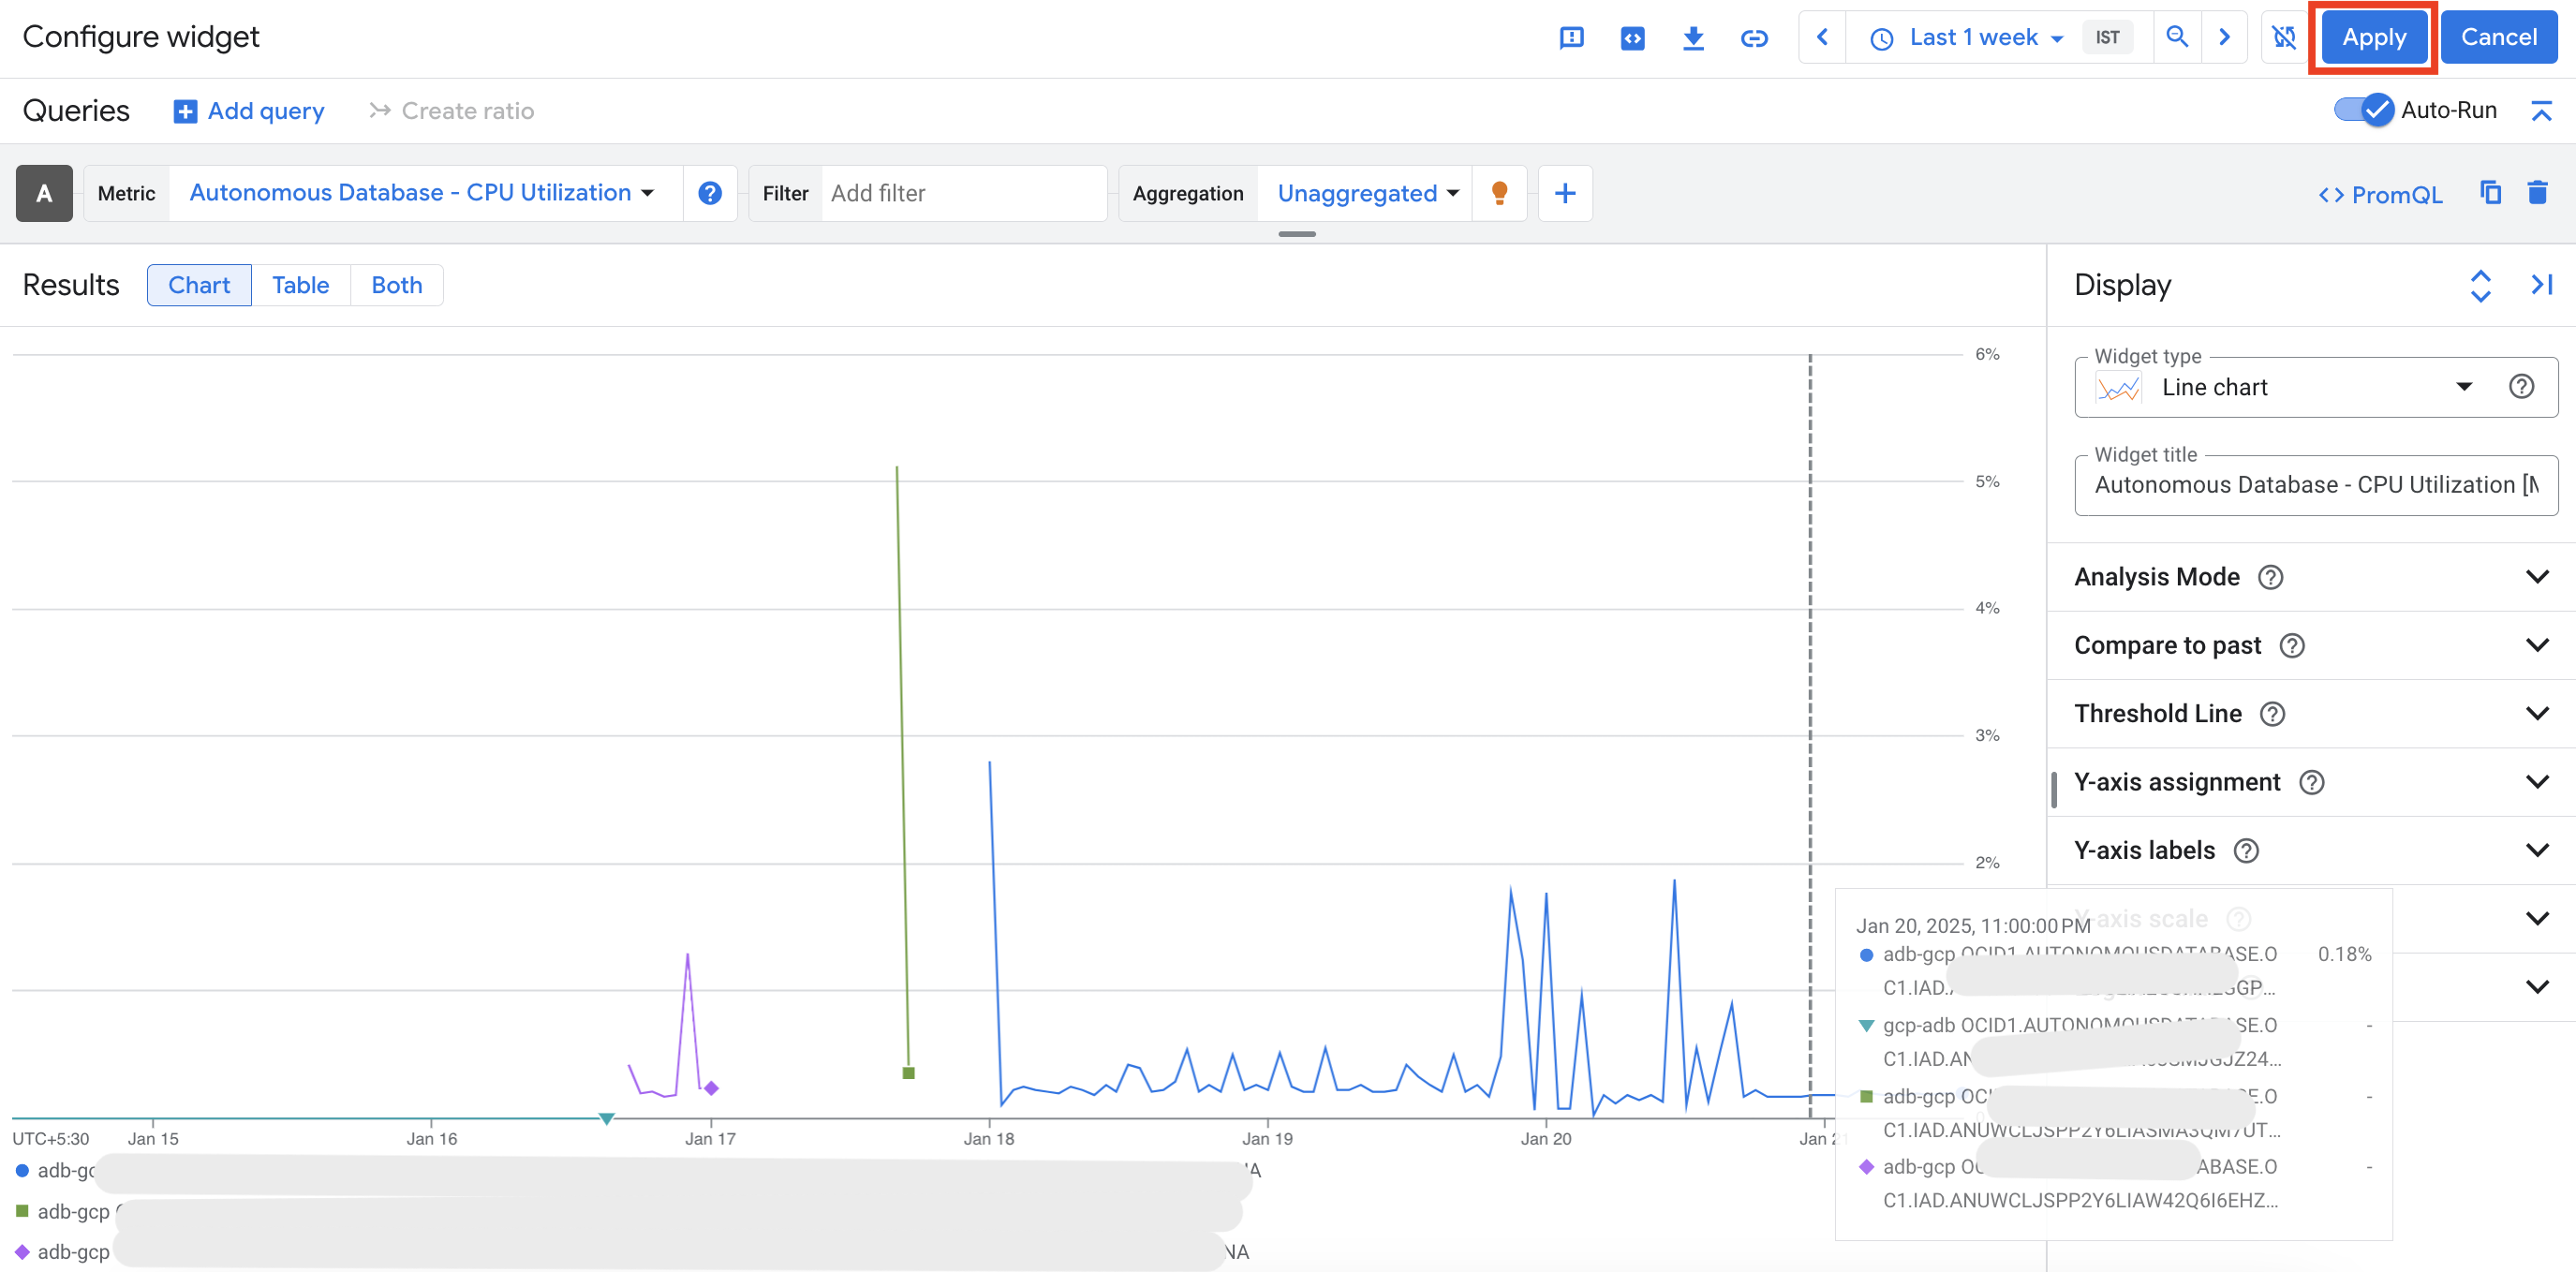
這會將小工具新增至儀表板。
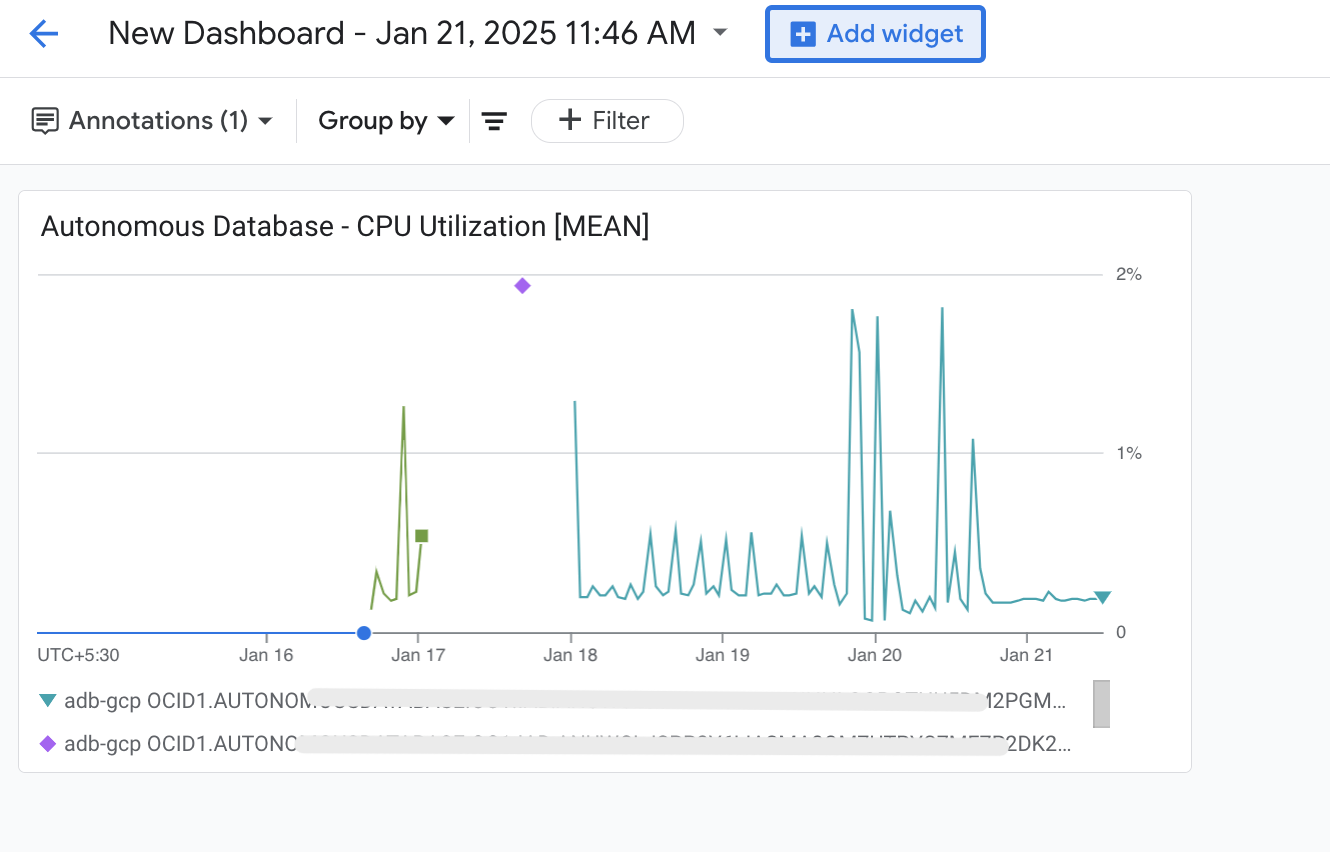
-
重複步驟 3 到 6,將更多小工具新增至儀表板。
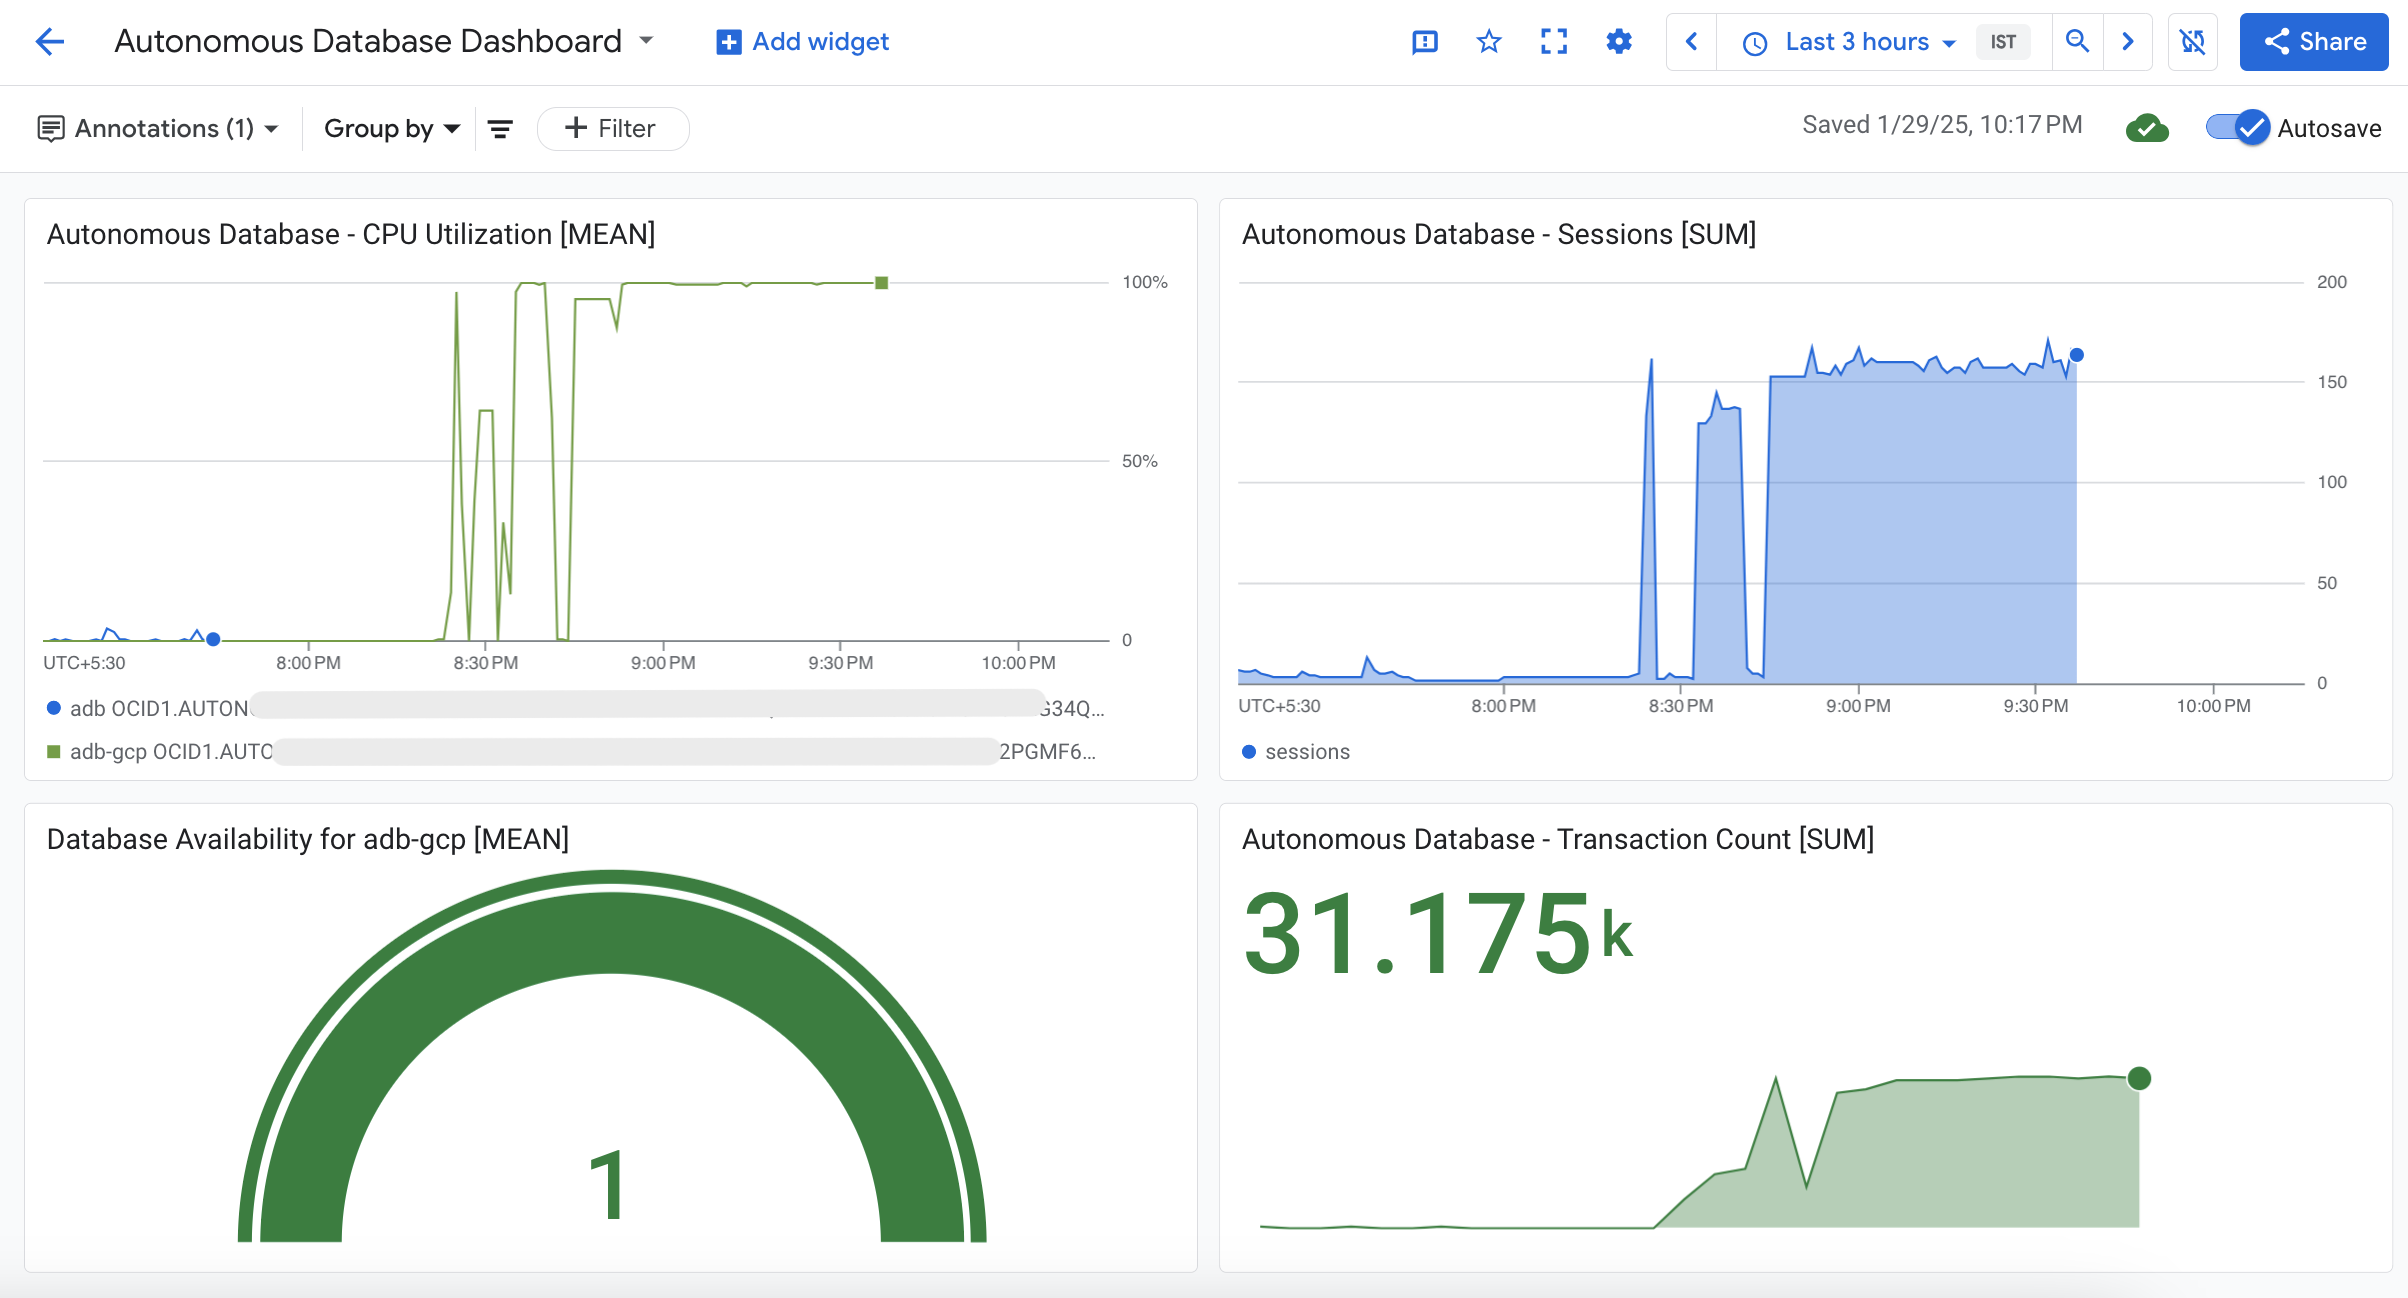
-
按一下儀表板名稱並將其重新命名為 Autonomous Database Dashboard 。
-
返回儀表板總覽以查看儀表板清單。

-
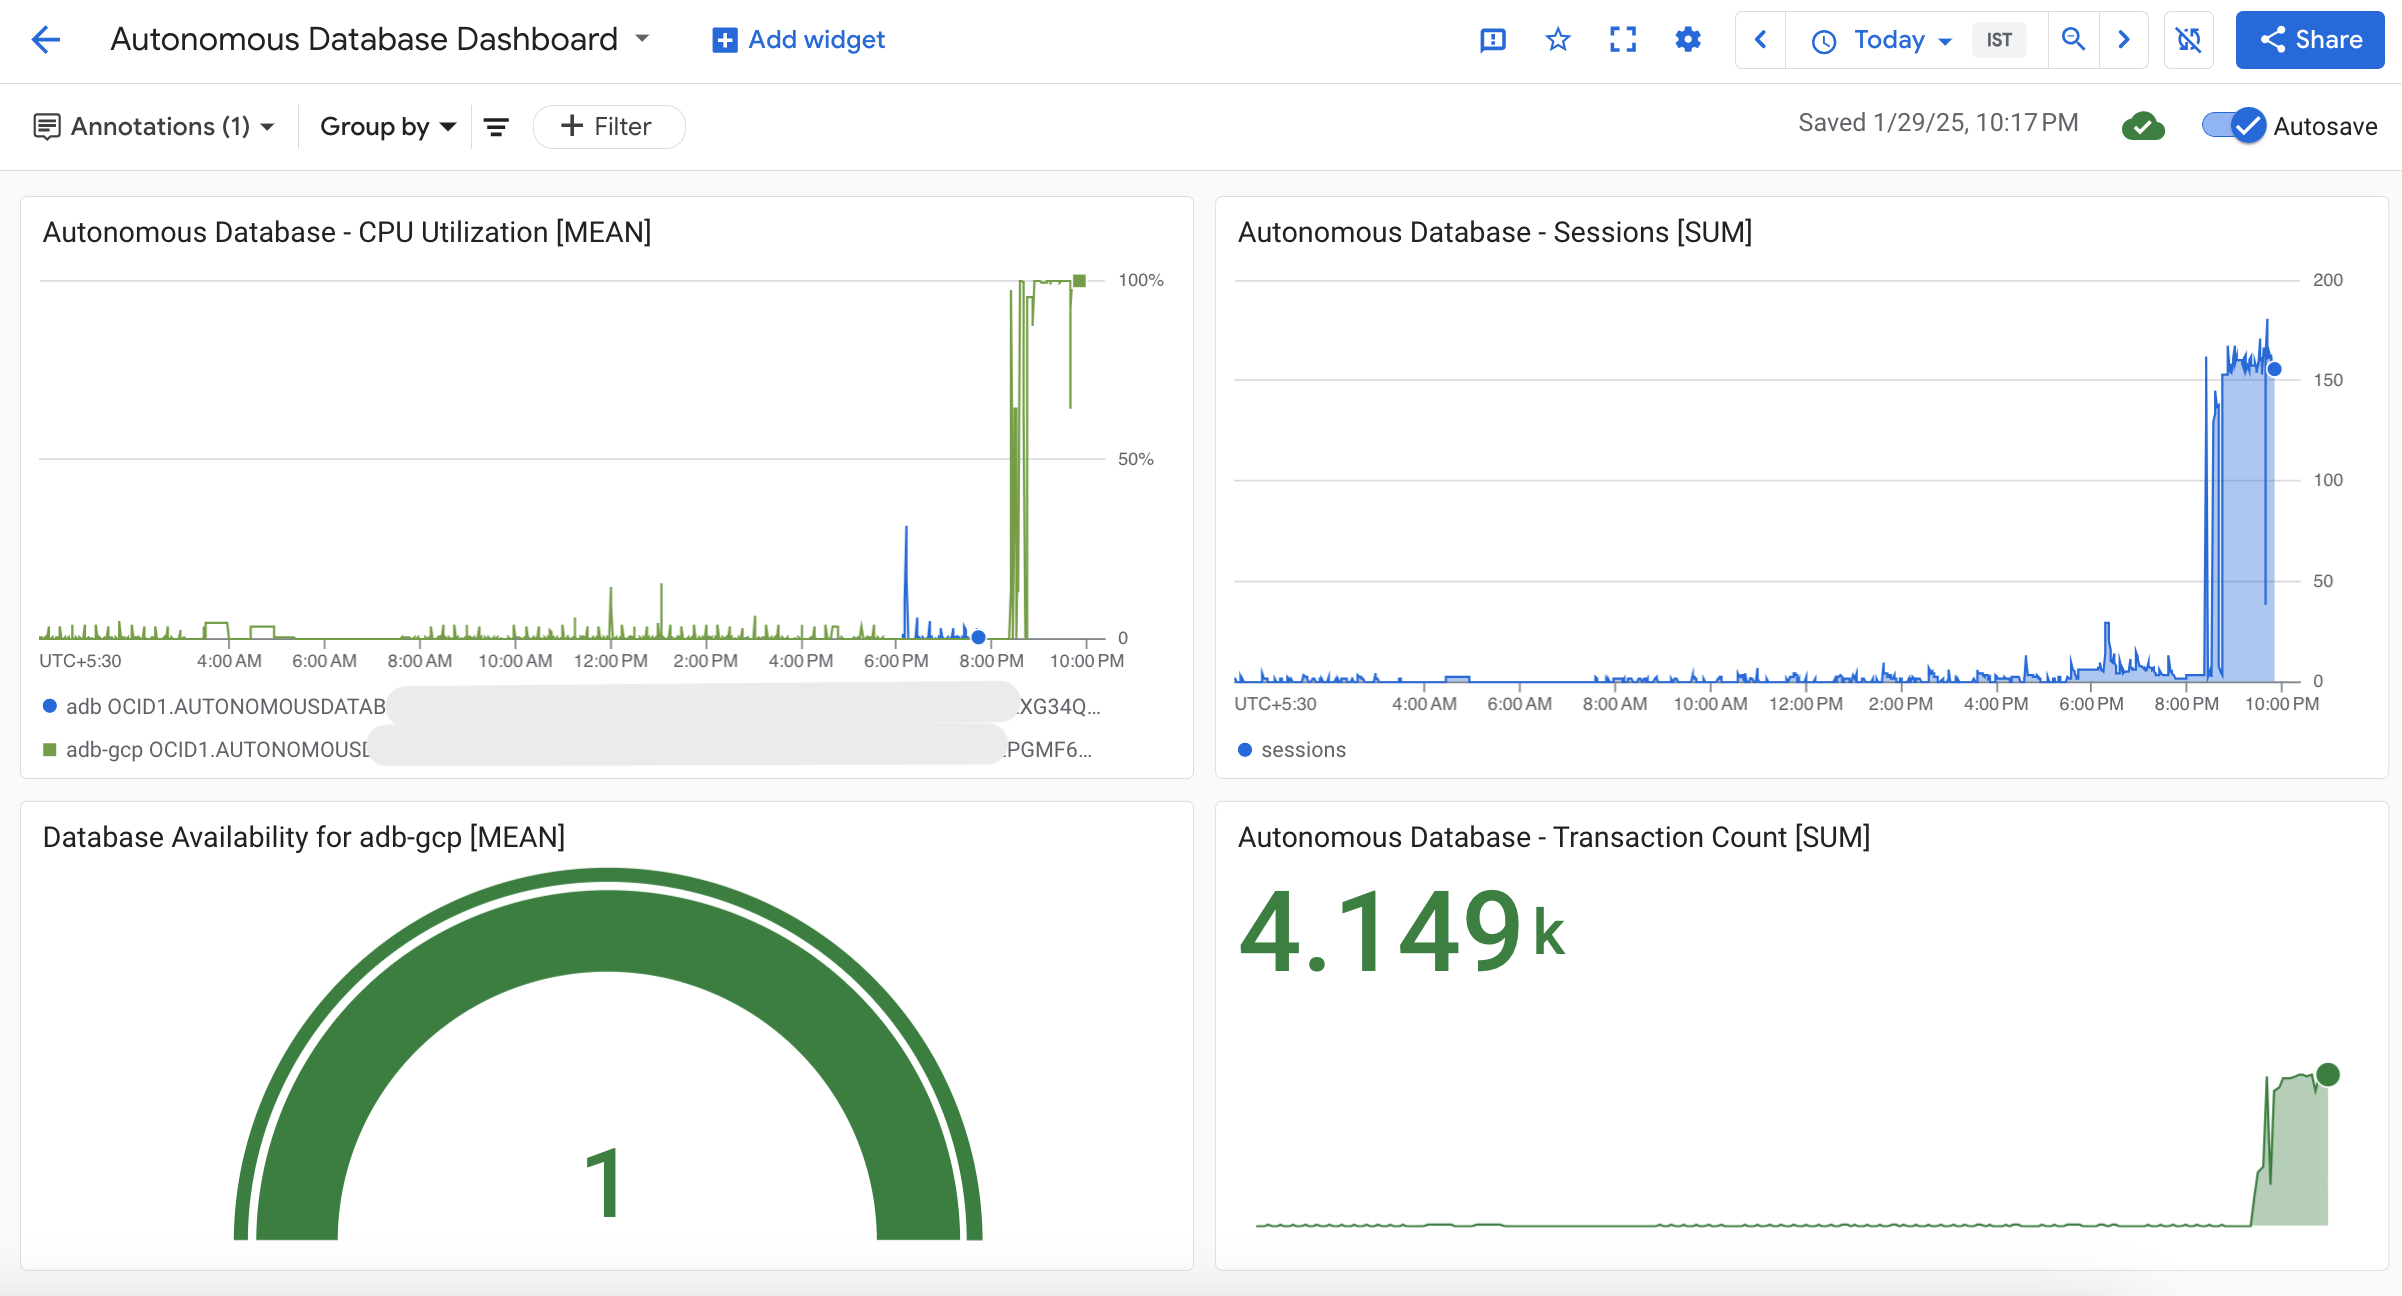
從儀表板清單中按一下新建立的儀表板,並將時間範圍變更為今天。請參閱下列重新整理的儀表板。
認可
- 作者 - Vivek Verma (北美雲端工程部門首席雲端架構師)
其他學習資源
探索 docs.oracle.com/learn 上的其他實驗室,或存取 Oracle Learning YouTube 頻道上的更多免費學習內容。此外,請造訪 education.oracle.com/learning-explorer 以成為 Oracle Learning Explorer。
如需產品文件,請造訪 Oracle Help Center 。
Monitor Oracle Database@Google Cloud using Google Cloud Monitoring
G28844-01
Copyright ©2025, Oracle and/or its affiliates.