Release 1 (9.0.1)
Part Number A87503-02
Home |
Book List |
Contents |
Index | Master Index | Feedback |
| Oracle9i Database Performance Guide and Reference Release 1 (9.0.1) Part Number A87503-02 |
|
![]()
![]()
This chapter explains how to allocate memory to Oracle memory caches, and how to use those caches. Proper sizing and effective use of the Oracle memory caches greatly improves database performance.
This chapter contains the following sections:
Oracle stores information in memory caches and on disk. Memory access is much faster than disk access. Physical I/O takes a significant amount of time when compared with memory access, typically in the order of ten milliseconds. Physical I/O also increases the CPU resources required, because of the path length in device drivers and operating system event schedulers. For this reason, it is more efficient for data requests for frequently accessed objects to be satisfied solely by memory, rather than also requiring disk access.
The performance goal is to reduce the physical I/O overhead as much as possible by making it more likely that the required data is in memory, or by making the process of retrieving the required data more efficient.
The main Oracle memory caches that affect performance are the following:
The size of these memory caches is configurable using initialization configuration parameters. The values for these parameters are also dynamically configurable using the ALTER SYSTEM statement (except for the log buffer, which is static after startup).
It is possible to reconfigure the sizes of the shared pool and the buffer cache dynamically, in addition to dynamically reconfiguring process-private memory. Memory for the shared pool and buffer cache is allocated in units of granules. A granule can be 4 MB or 16 MB, depending on the total size of your SGA at the time of instance startup. If the size of your SGA is less than 128 MB, then the granules are 4 MB in size; otherwise, they are 16 MB. It is possible to decrease the size of one cache and reallocate that memory to another cache, if needed. The total SGA size can be expanded to a value equal to the SGA_MAX_SIZE parameter.
The maximum amount of memory usable by the instance is determined at instance startup by the initialization parameter SGA_MAX_SIZE. You can specify SGA_MAX_SIZE to be larger than the sum of all of the memory components (such as buffer cache and shared pool); otherwise, SGA_MAX_SIZE defaults to the actual size used by those components. Setting SGA_MAX_SIZE larger than the sum memory used by all of the components lets you dynamically increase a cache size without needing to decrease the size of another cache.
|
See Also:
Oracle9i Database Concepts or Oracle9i SQL Reference for more information on the dynamic SGA |
With memory configuration, it is important to size the cache appropriately for the application's needs. Conversely, tuning the application's use of the caches can greatly reduce the resource requirements. Efficient use of the Oracle memory caches also reduces the load on other related resources, such as the latches that protect those caches, the CPU, and the I/O system.
For best performance, consider the following:
Making changes or additions to an existing application might require resizing Oracle memory structures to meet the needs of your modified application.
For most operating systems, it is important to consider the following:
Paging is when an OS transfers memory-resident pages disk solely to allow new pages to be loaded into memory. Many operating systems page to accommodate large amounts of information that do not fit into real memory. On most operating systems, paging reduces performance.
Examine the operating system using OS utilities to identify whether there is a lot of paging. If so, then the total memory on the system might not be large enough to hold everything for which you have allocated memory. Either increase the total memory on your system, or decrease the amount of memory allocated.
Because the purpose of the System Global Area (SGA) is to store data in memory for fast access, the SGA should be within main memory. If pages of the SGA are swapped to disk, then its data is no longer quickly accessible. On most operating systems, the disadvantage of paging significantly outweighs the advantage of a large SGA.
To see how much memory is allocated to the SGA and each of its internal structures, enter the following SQL*Plus statement:
SHOW SGA
The output of this statement will look similar to the following:
Total System Global Area  840205000 bytes
Fixed Size                   279240 bytes
Variable Size             520093696 bytes
Database Buffers          318767104 bytes
Redo Buffers                1064960 bytes
When sizing the SGA, ensure that you allow enough memory for the individual server processes and any other programs running on your system.
Configuring memory allocation involves distributing available memory to Oracle memory structures, depending on the needs of your application. The distribution of memory to Oracle structures can affect the amount of physical I/O necessary for Oracle to operate. Having a good first initial memory configuration also provides an indication of whether the I/O system is effectively configured.
It might be necessary to repeat the steps of memory allocation after the initial pass through the process. Subsequent passes let you make adjustments in earlier steps based on changes in later steps. For example, decreasing the size of the buffer cache allows you to increase the size of another memory structure, such as the shared pool.
For many types of operations, Oracle uses the buffer cache to cache blocks read from disk. Oracle bypasses the buffer cache for particular operations, such as sorting and parallel reads. For operations that use the buffer cache, this section explains the following:
To use the buffer cache effectively, the application's SQL statements should be tuned to avoid unnecessary resource consumption. To ensure this, verify that frequently executed SQL statements and SQL statements that perform many buffer gets have been tuned.
When configuring a brand new instance, it is impossible to know the correct size for the buffer cache. Typically, a DBA makes a first estimate for the cache size, then runs a representative workload on the instance and examines the relevant statistics to see whether the cache is under- or over-configured.
There are a number of different statistics that can be used to examine buffer cache activity. These include the following:
This view is populated when the DB_CACHE_ADVICE parameter is set to ON. This view shows the estimated miss rates for twenty potential buffer cache sizes, ranging from 10% of the current size to 200% of the current size. Each of the twenty potential cache sizes has its own row in this view, with the predicted physical I/O activity that would take place for that cache size. The DB_CACHE_ADVICE parameter is dynamic, so the advisory can be enabled and disabled dynamically to allow you to collect advisory data for a specific workload.
There are two minor overheads associated with this advisory:
DB_CACHE_ADVICE is set to READY in anticipation of collecting advisory statistics, or if the parameter is set to ON. If the parameter is set to OFF (the default setting) on instance startup, then the memory is dynamically allocated from the shared pool at the time the parameter value is modified to a value other than OFF.
The parameter DB_CACHE_ADVICE should be set to ON, and a representative workload should be running on the instance. Allow the workload to stabilize before querying V$DB_CACHE_ADVICE view.
The following SQL statement returns the predicted I/O requirement for the default buffer pool for various cache sizes:
column size_for_estimate         format 999,999,999,999 heading 'Cache Size (m)'
column buffers_for_estimate      format 999,999,999 heading 'Buffers'
column estd_physical_read_factor format 999.90 heading 'Estd Phys|Read Factor'
column estd_physical_reads       format 999,999,999 heading 'Estd Phys| Reads'

SELECT size_for_estimate, buffers_for_estimate
     , estd_physical_read_factor, estd_physical_reads
  FROM V$DB_CACHE_ADVICE
 WHERE name          = 'DEFAULT'
   AND block_size    = (SELECT value FROM V$PARAMETER
                         WHERE name = 'db_block_size')
   AND advice_status = 'ON';
The following output shows that if the cache was 212MB, rather than the current size of 304MB, the estimated additional number of physical reads would be 17 million (17,850,847). Increasing the cache size beyond it's current size would not provide a significant benefit.
                                Estd Phys    Estd Phys
 Cache Size (MB)      Buffers Read Factor        Reads
---------------- ------------ ----------- ------------
              30        3,802       18.70  192,317,943      10% of Current Size
              60        7,604       12.83  131,949,536
              91       11,406        7.38   75,865,861
             121       15,208        4.97   51,111,658
             152       19,010        3.64   37,460,786
             182       22,812        2.50   25,668,196
             212       26,614        1.74   17,850,847
             243       30,416        1.33   13,720,149
             273       34,218        1.13   11,583,180
             304       38,020        1.00   10,282,475      Current Size
             334       41,822         .93    9,515,878
             364       45,624         .87    8,909,026
             395       49,426         .83    8,495,039
             424       53,228         .79    8,116,496
             456       57,030         .76    7,824,764
             486       60,832         .74    7,563,180
             517       64,634         .71    7,311,729
             547       68,436         .69    7,104,280
             577       72,238         .67    6,895,122
             608       76,040         .66    6,739,731      200% of Current Size
This view assists in cache sizing by providing information that predicts the number of physical reads for each potential cache size. The data also includes a physical read factor, which is a factor by which the current number of physical reads is estimated to change if the buffer cache is resized to a given value.
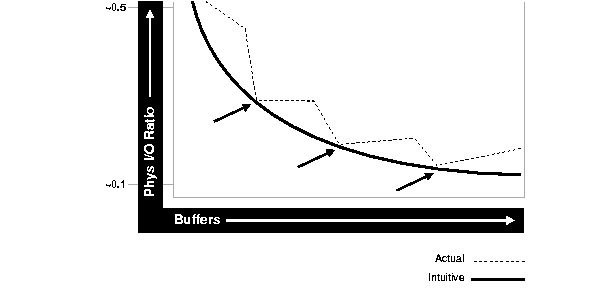
The relationship between successfully finding a block in the cache and the size of the cache is not always a smooth distribution. When sizing the buffer pool, avoid the use of additional buffers that contribute little or nothing to the cache hit ratio. In the example illustrated in Figure 14-1, only narrow bands of increments to the cache size may be worthy of consideration.
Examining Figure 14-1 leads to these observations:
The buffer cache hit ratio calculates how often a requested block has been found in the buffer cache, without requiring disk access. This ratio is computed using data selected from the dynamic performance view V$SYSSTAT. The buffer cache hit ratio can be used to verify the physical I/O as predicted by V$DB_CACHE_ADVICE.
These statistics are used to calculate the hit ratio:
The example below has been simplified by using values selected directly from the V$SYSSTAT table, without selecting these values over an interval. It is best to calculate the delta of these statistics over an interval while your application is running, then use them in the formula below.
|
See Also:
Chapter 20, "Oracle Tools to Gather Database Statistics" for more information on collecting statistics over an interval |
For example:
SELECT NAME, VALUE
  FROM V$SYSSTAT
WHERE NAME IN ('session logical reads','physical reads','physical reads
direct','physical reads direct (lob)')
The output of this query will look similar to the following:
NAME                                                                  VALUE
---------------------------------------------------------------- ----------
session logical reads                                             464905358
physical reads                                                     10380487
physical reads direct                                                 86850
physical reads direct (lob)                                               0
Calculate the hit ratio for the buffer cache with the following formula:
Hit Ratio = 1 - ((physical reads - physical reads direct - physical reads direct (lob)) / session logical reads)
Based on the sample statistics above, the buffer cache hit ratio is .978 (or 97.8%).
There are a many factors to examine before considering whether or not to increase or decrease the buffer cache size. For example, examine V$DB_CACHE_ADVICE data and the buffer cache hit ratio before deciding to increase or decrease the buffer cache size.
Additionally, a low cache hit ratio does not imply that increasing the size of the cache would be beneficial for performance. A good cache hit ratio could wrongly indicate that the cache is adequately sized for the workload.
Considerations when looking at the buffer cache hit ratio include the following:
As a general rule, investigate increasing the size of the cache if the cache hit ratio is low and your application has been tuned to avoid performing full table scans.
Set the DB_CACHE_ADVICE parameter to ON, and let the cache statistics stabilize. Examine the advisory data in the V$DB_CACHE_ADVICE view to determine the next increment required to significantly decrease the amount of physical I/O performed. If it is possible to allocate the required extra memory to the buffer cache, without causing the host OS to page, then allocate this memory. To increase the amount of memory allocated to the buffer cache, increase the value of the parameter DB_CACHE_SIZE.
If required, resize the buffer pools dynamically, rather than shutting down the instance to perform this change.
The DB_CACHE_SIZE parameter specifies the size of the default cache for the database's standard block size. To create and use tablespaces with block sizes different than the database's standard block sizes (such as to support transportable tablespaces), you must configure a separate cache for each block size used. The DB_nK_CACHE_SIZE parameter can be used to configure the size of the nonstandard block size needed (where n is 2, 4, 8, 16 or 32 and n is not the standard block size).
|
See Also:
Oracle9i Database Reference and Oracle9i Database Administrator's Guide for more information on using the |
If your hit ratio is high, then your cache is probably large enough to hold your most frequently accessed data. Check V$DB_CACHE_ADVICE data to see whether decreasing your cache size significantly causes the number of physical I/Os to increase. If not, and if you require memory for another memory structure, then you might be able to reduce the cache size and still maintain good performance. To make the buffer cache smaller, reduce the size of the cache by changing the value for the parameter DB_CACHE_SIZE.
A single default buffer pool is generally adequate for most systems. However, users with detailed knowledge of their application's buffer pool might benefit from configuring multiple buffer pools.
With segments that have atypical access patterns, cache blocks from those segments in two different buffer pools: the KEEP pool and the RECYCLE pool. A segment's access pattern may be atypical in that it is constantly accessed (that is, hot), or infrequently accessed (for example, a large segment accessed by a batch job only once per day).
Multiple buffer pools let you address these differences. You can use a KEEP buffer pool to maintain frequently-accessed segments in the buffer cache, and a RECYCLE buffer pool to prevent objects from consuming unnecessary space in the cache. When an object is associated with a cache, all blocks from that object are placed in that cache. Oracle maintains a DEFAULT buffer pool for objects that have not been assigned to a specific buffer pool. The default buffer pool is of size DB_CACHE_SIZE. Each buffer pool uses the same LRU replacement policy (for example, if the KEEP pool is not large enough to store all of the segments allocated to it, then the oldest blocks age out of the cache).
By allocating objects to appropriate buffer pools, you can do the following:
A problem can occur with an LRU aging method when a very large segment is accessed with a large or unbounded index range scan. Here, very large means large compared to the size of the cache. Any single segment that accounts for a substantial portion (more than 10%) of nonsequential physical reads is probably one of these segments. Random reads to such a large segment can cause buffers that contain data for other segments to be aged out of the cache. The large segment ends up consuming a large percentage of the cache, but it does not benefit from the cache.
Very frequently-accessed segments are not affected by large segment reads, because their buffers are warmed frequently enough that they do not age out of the cache. The issue exists for "warm" segments that are not accessed frequently enough to survive the buffer aging caused by the large segment reads. There are three options for solving this problem:
RECYCLE cache, so that it does not affect the other segments. The RECYCLE cache should be smaller than the DEFAULT buffer pool, and it should reuse buffers more quickly than the DEFAULT buffer pool.
KEEP cache that is not used at all for large segments. The KEEP cache can be sized to minimize misses in the cache. You can make the response times for specific queries more predictable by putting the segments accessed by the queries in the KEEP cache to ensure that they do not age out.
You can create multiple buffer pools for each database instance. The same set of buffer pools need not be defined for each instance of the database. Among instances, the buffer pools can be different sizes or not defined at all. Tune each instance according to the requirements placed by the application on that instance.
V$DB_CACHE_ADVICE can be used to size all pools configured on your instance. Make the initial cache size estimate, run the representative workload, then simply query the V$DB_CACHE_ADVICE view for the pool you are interested in.
For example, to query data from the KEEP pool:
SELECT size_for_estimate, buffers_for_estimate
     , estd_physical_read_factor, estd_physical_reads
  FROM V$DB_CACHE_ADVICE
 WHERE name          = 'KEEP'
   AND block_size    = (SELECT value FROM V$PARAMETER
                         WHERE name = 'db_block_size')
   AND advice_status = 'ON';
The data in V$SYSSTAT reflects the logical and physical reads for all buffer pools within one set of statistics. To determine the hit ratio for the buffer pools individually, you must query the V$BUFFER_POOL_STATISTICS view. This view maintains per-pool statistics on the number of logical reads and writes.
The buffer pool hit ratio can be determined using the following formula:
where the values of physical reads, block gets, and consistent gets can be obtained from the following query:
SELECT NAME, PHYSICAL_READS, DB_BLOCK_GETS, CONSISTENT_GETS, 1 - (PHYSICAL_READS / (DB_BLOCK_GETS + CONSISTENT_GETS)) "Hit Ratio"FROM V$BUFFER_POOL_STATISTICS;
The V$BH view shows the data object ID of all blocks that currently reside in the SGA. You can either look at the buffer cache usage pattern of all segments using Method 1, or examine the usage pattern of a specific segment, as shown in Method 2.
The query below counts the number of blocks for all segments that reside in the buffer cache at that point in time. Depending on your buffer cache size, this could require a lot of sort space:
column object_name format a40
column number_of_blocks format 999,999,999,999

SELECT o.object_name, COUNT(1) number_of_blocks
  FROM DBA_OBJECTS o, V$BH bh
 WHERE o.object_id  = bh.objd
   AND o.owner     != 'SYS'
 GROUP BY o.object_name
 ORDER BY count(1);

OBJECT_NAME                              NUMBER_OF_BLOCKS
---------------------------------------- ----------------
OA_PREF_UNIQ_KEY                                        1
SYS_C002651                                             1
..
DS_PERSON                                              78
OM_EXT_HEADER                                         701
OM_SHELL                                            1,765
OM_HEADER                                           5,826
OM_INSTANCE                                        12,644
Use the following steps to determine the percentage of the cache used by an individual object at a given point in time:
SELECT data_object_id, object_type
  FROM user_objects
 WHERE object_name = upper('<SEGMENT_NAME>');
Because two objects can have the same name (if they are different types of objects), use the OBJECT_TYPE column to identify the object of interest. If the object is owned by another user, then use the view DBA_OBJECTS or ALL_OBJECTS instead of USER_OBJECTS.
SEGMENT_NAME:
SELECT COUNT(*) BUFFERS
  FROM V$BH
 WHERE objd = <DATA_OBJECT_ID>;
where DATA_OBJECT_ID is from step 1.
SELECT name, block_size, sum(buffers)
  FROM V$BUFFER_POOL
 GROUP BY name, block_size
 HAVING SUM(buffers) > 0;
SEGMENT_NAME.
% cache used by segment_name = [buffers(Step2)/total buffers(Step3)]
If there are certain segments in your application that are referenced frequently, then cache blocks from those segments in a separate cache called the KEEP buffer pool. Memory is allocated to the KEEP buffer pool by setting the parameter DB_KEEP_POOL_SIZE to the required size. The memory for the KEEP pool is not a subset of the default pool. Typical segments that can be kept are small reference tables, which are used frequently. Application developers and DBAs can determine which tables are candidates.
You can check the number of blocks from candidate tables by querying V$BH, as described in "Determining Which Segments Have Many Buffers in the Pool".
The goal of the KEEP buffer pool is to retain objects in memory, thus avoiding I/O operations. The size of the KEEP buffer pool, therefore, depends on the objects that you want to keep in the buffer cache. You can compute an approximate size for the KEEP buffer pool by adding together the blocks used by all objects assigned to this pool. If you gather statistics on the segments, you can query DBA_TABLES.BLOCKS and DBA_TABLES.EMPTY_BLOCKS to determine the number of blocks used.
Calculate the hit ratio by taking two snapshots of system performance at different times using the previous query. Subtract the newest values from the older values for physical reads, block gets, and consistent gets, and use these values to compute the hit ratio.
A 100% buffer pool hit ratio might not be optimal. Often, you can decrease the size of your KEEP buffer pool and still maintain a sufficiently high hit ratio. Allocate blocks removed from use for the KEEP buffer pool to other buffer pools.
Each object kept in memory results in a trade-off. It is beneficial to keep frequently-accessed blocks in the cache, but retaining infrequently-used blocks results in less space for other, more active blocks.
It is possible to configure a RECYCLE buffer pool for blocks belonging to those segments that you do not want to remain in memory. The RECYCLE pool is good for segments that are scanned rarely or are not referenced frequently. If an application accesses the blocks of a very large object in a random fashion, then there is little chance of reusing a block stored in the buffer pool before it is aged out. This is true regardless of the size of the buffer pool (given the constraint of the amount of available physical memory). Because of this, the object's blocks need not be cached; those cache buffers can be allocated to other objects.
Memory is allocated to the RECYCLE buffer pool by setting the parameter DB_RECYCLE_POOL_SIZE to the required size. This memory for the RECYCLE buffer pool is not a subset of the default pool.
Do not discard blocks from memory too quickly. If the buffer pool is too small, then blocks can age out of the cache before the transaction or SQL statement has completed execution. For example, an application might select a value from a table, use the value to process some data, and then update the record. If the block is removed from the cache after the select statement, then it must be read from disk again to perform the update. The block should be retained for the duration of the user transaction.
To define a default buffer pool for an object, use the BUFFER_POOL keyword of the STORAGE clause. This clause is valid for CREATE and ALTER TABLE, CLUSTER, and INDEX SQL statements. After a BUFFER_POOL has been specified, all subsequent blocks read for the object are placed in that pool.
If a buffer pool is defined for a partitioned table or index, then each partition of the object inherits the buffer pool from the table or index definition, unless you override it with a specific buffer pool.
When the buffer pool of an object is changed using the ALTER statement, all buffers currently containing blocks of the altered segment remain in the buffer pool they were in before the ALTER statement. Newly loaded blocks and any blocks that have aged out and are reloaded go into the new buffer pool.
Oracle uses the shared pool to cache many different types of data. Cached data includes the textual and executable forms of PL/SQL blocks and SQL statements, dictionary cache data, and other data.
Proper use and sizing of the shared pool can reduce resource consumption in at least four ways:
This section covers the following:
The main components of the shared pool are the library cache and the dictionary cache. The library cache stores the executable (parsed or compiled) form of recently referenced SQL and PL/SQL code. The dictionary cache stores data referenced from the data dictionary. Many of the caches in the shared pool automatically increase or decrease in size, as needed, including the library cache and the dictionary cache. Old entries are aged out of these caches to accommodate new entries when the shared pool does not have free space for a new entry.
A cache miss on the data dictionary cache or library cache is more expensive than a miss on the buffer cache. For this reason, the shared pool should be sized to ensure that frequently used data is cached.
There are a number of features that make large memory allocations in the shared pool, such as the shared server, parallel query, or Recovery Manager. Oracle recommends segregating the SGA memory used by these features by configuring a distinct memory area, called the large pool.
Allocation of memory from the shared pool is performed in chunks. This allows large objects (over 5k) to be loaded into the cache without requiring a single contiguous area, hence reducing the possibility of running out of enough contiguous memory due to fragmentation.
Infrequently, Java, PL/SQL, or SQL cursors may make allocations out of the shared pool that are larger than 5k. To allow these allocations to happen most efficiently, Oracle segregates a small amount of the shared pool. This memory is used if the shared pool does not have enough space. The segregated area of the shared pool is called the reserved pool.
|
See Also:
"Consider Configuring the Reserved Pool" for more information on the reserved area of the shared pool |
Information stored in the data dictionary cache includes usernames, segment information, profile data, tablespace information, and sequence numbers. The dictionary cache also caches descriptive information, or metadata, about schema objects. Oracle uses this metadata when parsing SQL cursors or during the compilation of PL/SQL programs.
The library cache holds executable forms of SQL cursors, PL/SQL programs, and Java classes. This section focuses on tuning as it relates to cursors, PL/SQL programs, and Java classes. These are collectively referred to as application code.
When application code is run, Oracle attempts to reuse existing code if it has been executed previously and can be shared. If the parsed representation of the statement does exist in the library cache and it can be shared, then Oracle reuses the existing executable. This is known as a soft parse, or a library cache hit.
If Oracle is unable to use existing code, then a new executable version of the application code must be built. This is known as a hard parse, or a library cache miss.
Library cache misses can occur on either the parse step or the execute step when processing a SQL statement.
When an application makes a parse call for a SQL statement, if the parsed representation of the statement does not already exist in the library cache, then Oracle parses the statement and stores the parsed form in the shared pool. This is a hard parse. You might be able to reduce library cache misses on parse calls by ensuring that all shareable SQL statements are in the shared pool whenever possible.
If an application makes an execute call for a SQL statement, and if the executable portion of the previously built SQL statement has been aged out (that is, deallocated) from the library cache to make room for another statement, then Oracle implicitly reparses the statement, creating a new shared SQL area for it, and executes it. This also results in a hard parse. Usually, you can reduce library cache misses on execution calls by allocating more memory to the library cache.
In order to perform a hard parse, Oracle uses more resources than during a soft parse. Resources used for a soft parse include CPU and library cache latch gets. Resources required for a hard parse include additional CPU, library cache latch gets, and shared pool latch gets.
Oracle automatically determines whether a SQL statement or PL/SQL block being issued is identical to another statement currently in the shared pool.
Oracle's performs the following steps for the comparison:
The text of the statement is hashed. If there is no matching hash value, then the SQL statement does not currently exist in the shared pool, and a hard parse is performed.
If there is a matching hash value for an existing SQL statement in the shared pool, then Oracle compares the text of the matched statement to the text of the statement hashed to see if they are identical. The text of the SQL statements or PL/SQL blocks must be identical, character for character, including spaces, case, and comments. For example, the following statements cannot use the same shared SQL area:
SELECT * FROM employees;
SELECT * FROM Employees;
SELECT *  FROM employees;
Usually, SQL statements that differ only in literals cannot use the same shared SQL area. For example, the following SQL statements do not resolve to the same SQL area:
SELECT count(1) FROM employees where manager_id = 121;
SELECT count(1) FROM employees where manager_id = 247;
The only exception to this is when the parameter CURSOR_SHARING has been set to SIMILAR or FORCE. Similar statements also share SQL areas when the CURSOR_SHARING parameter is set to SIMILAR or FORCE. The costs and benefits involved in using CURSOR_SHARING are explained later in this section.
The objects referenced in the issued statement are compared to the referenced objects of all existing statements identified above to ensure that they are identical.
For example, if two users each issue the following SQL statement:
SELECT * FROM employees;
and they each have their own employees table, then the above statement is not considered identical, because the statement references different tables for each user.
For example, the following statements cannot use the same shared SQL area, because the bind variable names differ:
SELECT * FROM employees WHERE department_id = :department_id;
SELECT * FROM employees WHERE department_id = :dept_id;
Many Oracle products (such as Oracle Forms and the precompilers) convert the SQL before passing statements to the database. Characters are uniformly changed to uppercase, white space is compressed, and bind variables are renamed so that a consistent set of SQL statements is produced.
An important purpose of the shared pool is to cache the executable versions of SQL and PL/SQL statements. This allows multiple executions of the same SQL or PL/SQL code to be performed without the resources required to hard parse, which results in significant reductions in CPU, memory, and latch usage.
The shared pool is also able to support unshared SQL in data warehousing applications, which execute low-concurrency high-resource SQL statements. In this situation, using unshared SQL with literal values is recommended. Using literal values rather than bind variables allows the optimizer to make good column selectivity estimates, thus providing an optimal data access plan.
In an OLTP system, there are a number of ways to ensure efficient use of the shared pool and related resources. Discuss the following possibilities with application developers and agree on strategies to ensure that the shared pool is used effectively:
Efficient use of the shared pool in high-concurrency OLTP systems significantly reduces the probability of parse-related application scalability issues.
Reuse of shared SQL for multiple users running the same application, avoids hard parsing. Soft parses provide a significant reduction in resource usage, such as shared pool and library cache latches. To share cursors, do the following:
SELECT employee_id FROM employees WHERE department_id = 10;
SELECT employee_id FROM employees WHERE department_id = 20;
By replacing the literals with a bind variable, only one SQL statement would result, which could be executed twice:
SELECT employee_id FROM employees WHERE department_id = :dept_id;
|
Note:
For existing applications where rewriting the code to use bind variables is impractical, it is possible to use the |
Large OLTP applications with middle-tiers should maintain connections, rather than connecting and disconnecting for each database request. Maintaining connections saves CPU resources and database resources, such as latches.
Large OLTP systems where users log in to the database as their own userID can benefit from qualifying the segment owner explicitly, rather than by using public synonyms. This significantly reduces the number of entries in the dictionary cache. For example:
SELECT employee_id FROM hr.employees WHERE department_id = :dept_id;
An alternative to qualifying table names is to connect to the database via a single userID, rather than individual userIDs. User-level validation can take place locally on the middle-tier. Reducing the number of distinct userIDs also reduces the load on the dictionary cache.
Using stored PL/SQL packages can overcome much of the scalability issues for systems with thousands of users, each with individual user sign-on and public synonyms. This is because a package is executed as the owner, rather than the caller, which reduces dictionary cache load considerably.
Avoid performing DDL operations on high-usage segments during peak hours. Performing DDL on such segments often results in the dependent SQL being invalidated, and hence reparsed on a later execution.
Allocating sufficient cache for frequently updated sequence numbers significantly reduces the frequency of dictionary cache locks, which improves scalability. The CACHE keyword on the CREATE SEQUENCE or ALTER SEQUENCE statement lets you configure the number of cached entries for each sequence.
Depending on the Oracle application tool you are using, it is possible to control how frequently your application performs parse calls.
The frequency with which your application either closes cursors or reuses existing cursors for new SQL statements affects the amount of memory used by a session, and often the amount of parsing performed by that session.
An application that closes cursors or reuses cursors (for a different SQL statement, rather than the same SQL statement), does not need as much session memory as an application that keeps cursors open. Conversely, that same application may need to perform more parse calls, hence using extra CPU and Oracle resources.
Cursors associated with SQL statements that are not executed frequently can be closed or reused for other statements, because the likelihood of reexecuting (and reparsing) that statement is low.
Extra parse calls are required when a cursor containing a SQL statement that will be reexecuted is closed or reused for another statement. Had the cursor remained open, it could have been reused without the overhead of issuing a parse call.
The ways in which you control cursor management depends on your application development tool. The following section introduces the methods used for some Oracle tools.
|
See Also:
|
Do not close and reopen cursors that you will be reexecuting. Instead, leave the cursors open, and change the literal values in the bind variables before execution.
Avoid reusing statement handles for new SQL statements when the existing SQL statement will be reexecuted in the future.
When using the Oracle precompilers, you can control when cursors are closed by setting precompiler clauses. In Oracle mode, the clauses are as follows:
Oracle recommends that you not use ANSI mode, in which the values of HOLD_CURSOR and RELEASE_CURSOR are switched.
The precompiler clauses can be specified on the precompiler command line or within the precompiler program. With these clauses, you can employ different strategies for managing cursors during execution of the program.
Prepare the statement, then reexecute the statement with the new values for the bind variables. The cursor stays open for the duration of the session.
Avoid closing cursors if they will be reexecuted, because the new literal values can be bound to the cursor for reexecution. Alternatively, JDBC provides a SQL Statement Cache within the JDBC client using the setStmtCacheSize() method. Using this method, JDBC creates a SQL statement cache that is local to the JDBC program.
With Oracle Forms, it is possible to control some aspects of cursor management. You can exercise this control either at the trigger level, at the form level, or at run time.
When configuring a brand new instance, it is impossible to know the correct size to make the shared pool cache. Typically, a DBA makes a first estimate for the cache size, then runs a representative workload on the instance, and examines the relevant statistics to see whether the cache is under- or over-configured.
For most OLTP applications, shared pool size is an important factor to the application performance. Shared pool size is less important for applications that issue a very limited number of discrete SQL statements, such as DSS systems.
If the shared pool is too small, then extra resources are used to manage the limited amount of available space. This consumes CPU and latching resources, and causes contention.
Optimally, the shared pool should be just large enough to cache frequently accessed objects. Having a significant amount of free memory in the shared pool is a waste of memory.
The goal when sizing the library cache is to ensure that SQL statements that will be executed multiple times are cached, without allocating too much memory.
The statistic that shows the amount of reloading (that is, reparsing) of a previously cached SQL statement that was aged out of the cache is the RELOADS column in the V$LIBRARYCACHE view. In an application that reuses SQL effectively, on a system with an optimal shared pool size, the RELOADS statistic would have a value of zero.
The INVALIDATIONS column in this view shows the number of times library cache data was invalidated and had to be reparsed. INVALIDATIONS should be near zero. This means SQL statements that could have been shared were invalidated by some operation (for example, a DDL). This statistic should be near zero on OLTP systems during peak loads.
Another key statistic is the amount of free memory in the shared pool at peak times. The amount of free memory can be queried from V$SGASTAT, looking at the free memory for the shared pool. Optimally, free memory should be as low as possible, without causing any RELOADS on the system.
Lastly, a broad indicator of library cache health is the library cache hit ratio. This value should be considered along with the above statistics and other data, such as the rate of hard parsing and whether there is any shared pool or library cache latch contention.
These statistics are discussed below in more detail.
You can monitor statistics reflecting library cache activity by examining the dynamic performance view V$LIBRARYCACHE. These statistics reflect all library cache activity since the most recent instance startup.
Each row in this view contains statistics for one type of item kept in the library cache. The item described by each row is identified by the value of the NAMESPACE column. Rows of the view with the following NAMESPACE values reflect library cache activity for SQL statements and PL/SQL blocks:
Rows with other NAMESPACE values reflect library cache activity for object definitions that Oracle uses for dependency maintenance.
|
See Also:
Chapter 24, "Dynamic Performance Views for Tuning" for information on columns of the |
To examine each namespace individually, use the following query:
SELECT namespace
     , pins
     , pinhits
     , reloads
     , invalidations
  FROM V$LIBRARYCACHE
 ORDER BY namespace;
The output of this query could look like the following:
NAMESPACE             PINS    PINHITS    RELOADS INVALIDATIONS
--------------- ---------- ---------- ---------- -------------
BODY                  8870       8819          0             0
CLUSTER                393        380          0             0
INDEX                   29          0          0             0
OBJECT                   0          0          0             0
PIPE                 55265      55263          0             0
SQL AREA          21536413   21520516      11204             2
TABLE/PROCEDURE   10775684   10774401          0             0
TRIGGER               1852       1844          0             0
To calculate the library cache hit ratio, use the following formula:
Using the library cache hit ratio formula above, the cache hit ratio is the following:
SUM(PINHITS)/SUM(PINS)
----------------------
            .999466248
|
See Also:
Chapter 20, "Oracle Tools to Gather Database Statistics" for information on how gather information over an interval |
Examining the data returned leads to these observations:
EXECUTIONS.
RELOAD).
The amount of free memory in the shared pool is reported in V$SGASTAT. Report the current value from this view using the following query:
SELECT * FROM V$SGASTAT
 WHERE NAME = 'free memory'
   AND POOL = 'shared pool';

The output will be similar to the following:

POOL        NAME                            BYTES
----------- -------------------------- ----------
shared pool free memory                   4928280
If there is always free memory available in the shared pool, then increasing the size of the pool offers little or no benefit. However, just because the shared pool is full does not necessarily mean there is a problem. It may be indicative of a well-configured system.
The algorithm Oracle uses to manage data in the shared pool ages out library cache data in preference to aging out dictionary cache data. Therefore, configuring the library cache to an acceptable size usually ensures that the data dictionary cache is also adequately sized.
Misses on the data dictionary cache are to be expected in some cases. On instance startup, the data dictionary cache contains no data. Therefore, any SQL statement issued is likely to result in cache misses. As more data is read into the cache, the likelihood of cache misses decreases. Eventually, the database reaches a steady state, in which the most frequently used dictionary data is in the cache. At this point, very few cache misses occur.
Each row in the V$ROWCACHE view contains statistics for a single type of the data dictionary item. These statistics reflect all data dictionary activity since the most recent instance startup. These columns in the V$ROWCACHE view reflect the use and effectiveness of the data dictionary cache:
Use the following query to monitor the statistics in the V$ROWCACHE. view over a period of time while your application is running. The derived column PCT_SUCC_GETS can be considered the item-specific hit ratio:
column parameter format a21
column pct_succ_gets format 999.9
column updates format 999,999,999

SELECT parameter
     , sum(gets)
     , sum(getmisses)
     , 100*sum(gets - getmisses) / sum(gets)  pct_succ_gets
     , sum(modifications)                     updates
  FROM V$ROWCACHE
 WHERE gets > 0
 GROUP BY parameter;
The output of this select will be similar to the following:
PARAMETER              SUM(GETS) SUM(GETMISSES) PCT_SUCC_GETS      UPDATES
--------------------- ---------- -------------- ------------- ------------
dc_database_links             81              1          98.8            0
dc_free_extents            44876          20301          54.8       40,453
dc_global_oids                42              9          78.6            0
dc_histogram_defs           9419            651          93.1            0
dc_object_ids              29854            239          99.2           52
dc_objects                 33600            590          98.2           53
dc_profiles                19001              1         100.0            0
dc_rollback_segments       47244             16         100.0           19
dc_segments               100467          19042          81.0       40,272
dc_sequence_grants           119             16          86.6            0
dc_sequences               26973             16          99.9       26,811
dc_synonyms                 6617            168          97.5            0
dc_tablespace_quotas         120              7          94.2           51
dc_tablespaces            581248             10         100.0            0
dc_used_extents            51418          20249          60.6       42,811
dc_user_grants             76082             18         100.0            0
dc_usernames              216860             12         100.0            0
dc_users                  376895             22         100.0            0
Examining the data returned by the sample query leads to these observations:
It is also possible to calculate an overall dictionary cache hit ratio as shown below, although summing up the data over all the caches will lose the finer granularity of data:
SELECT (SUM(GETS - GETMISSES - FIXED)) / SUM(GETS) "ROW CACHE" FROM V$ROWCACHE;
Increasing the amount of memory for the shared pool increases the amount of memory usable by both the library cache and the dictionary cache.
To ensure that shared SQL areas remain in the cache after their SQL statements are parsed, increase the amount of memory available to the library cache until the V$LIBRARYCACHE.RELOADS value is near zero. To increase the amount of memory available to the library cache, increase the value of the initialization parameter SHARED_POOL_SIZE. The maximum value for this parameter depends on your operating system. This measure reduces implicit reparsing of SQL statements and PL/SQL blocks on execution.
To take advantage of additional memory available for shared SQL areas, you might also need to increase the number of cursors permitted for a session. You can do this by increasing the value of the initialization parameter OPEN_CURSORS.
Examine cache activity by monitoring the GETS and GETMISSES columns. For frequently accessed dictionary caches, the ratio of total GETMISSES to total GETS should be less than 10% or 15%, depending on the application.
Consider increasing the amount of memory available to the cache if all of the following are true:
Increase the amount of memory available to the data dictionary cache by increasing the value of the initialization parameter SHARED_POOL_SIZE.
If your RELOADS are near zero, and if you have a small amount of free memory in the shared pool, then the shared pool is probably large enough to hold the most frequently accessed data.
If you always have significant amounts of memory free in the shared pool, and if you would like to allocate this memory elsewhere, then you might be able to reduce the shared pool size and still maintain good performance.
To make the shared pool smaller, reduce the size of the cache by changing the value for the parameter SHARED_POOL_SIZE.
Unlike the shared pool, the large pool does not have an LRU list. Oracle does not attempt to age memory out of the large pool.
You should consider configuring a large pool if your instance uses any of the following:
Parallel query uses shared pool memory to cache parallel execution message buffers.
|
See Also:
Oracle9i Data Warehousing Guide for more information on sizing the large pool with parallel query |
Recovery Manager uses the shared pool to cache I/O buffers during backup and restore operations. For I/O server processes and backup and restore operations, Oracle allocates buffers that are a few hundred kilobytes in size.
|
See Also:
Oracle9i Recovery Manager User's Guide and Reference for more information on sizing the large pool when using Recovery Manager |
In a shared server architecture, the session memory for each client process is included in the shared pool.
As Oracle allocates shared pool memory for shared server session memory, the amount of shared pool memory available for the library cache and dictionary cache decreases. If you allocate this session memory from a different pool, then Oracle can use the shared pool primarily for caching shared SQL and not incur the performance overhead from shrinking the shared SQL cache.
Oracle recommends using the large pool to allocate shared server-related UGA (User Global Area), not the shared pool. This is because Oracle uses the shared pool to allocate SGA (Shared Global Area) memory for other purposes, such as shared SQL and PL/SQL procedures. Using the large pool instead of the shared pool decreases fragmentation of the shared pool.
To store shared server-related UGA in the large pool, specify a value for the initialization parameter LARGE_POOL_SIZE. To see which pool (shared pool or large pool) the memory for an object resides, check the column POOL in V$SGASTAT. The large pool is not configured by default; its minimum value is 300K. If you do not configure the large pool, then Oracle uses the shared pool for shared server user session memory.
Configure the size of the large pool based on the number of simultaneously active sessions. Each application requires a different amount of memory for session information, and your configuration of the large pool or SGA should reflect the memory requirement. For example, assuming that the shared server requires 200K - 300K to store session information for each active session. If you anticipate 100 active sessions simultaneously, then configure the large pool to be 30M, or increase the shared pool accordingly if the large pool is not configured.
|
See Also:
|
The exact amount of UGA Oracle uses depends on each application. To determine an effective setting for the large or shared pools, observe UGA use for a typical user and multiply this amount by the estimated number of user sessions.
Even though use of shared memory increases with shared servers, the total amount of memory use decreases. This is because there are fewer processes, and therefore Oracle uses less PGA memory with shared servers when compared to dedicated server environments.
Oracle collects statistics on total memory used by a session and stores them in the dynamic performance view V$SESSTAT:
To find the value, query V$STATNAME.
You can use the following query to decide how much larger to make the shared pool if you are using a shared server. Issue the following queries while your application is running:
SELECT SUM(VALUE) || ' BYTES' "TOTAL MEMORY FOR ALL SESSIONS"FROM V$SESSTAT, V$STATNAME WHERE NAME = 'session uga memory' AND V$SESSTAT.STATISTIC# = V$STATNAME.STATISTIC#;SELECT SUM(VALUE) || ' BYTES' "TOTAL MAX MEM FOR ALL SESSIONS"FROM V$SESSTAT, V$STATNAME WHERE NAME = 'session uga memory max' AND V$SESSTAT.STATISTIC# = V$STATNAME.STATISTIC#;
These queries also select from the dynamic performance view V$STATNAME to obtain internal identifiers for session memory and max session memory. The results of these queries could look like the following:
TOTAL MEMORY FOR ALL SESSIONS
-----------------------------
157125 BYTES

TOTAL MAX MEM FOR ALL SESSIONS
------------------------------
417381 BYTES
The result of the first query indicates that the memory currently allocated to all sessions is 157,125 bytes. This value is the total memory whose location depends on how the sessions are connected to Oracle. If the sessions are connected to dedicated server processes, then this memory is part of the memories of the user processes. If the sessions are connected to shared server processes, then this memory is part of the shared pool.
The result of the second query indicates that the sum of the maximum sizes of the memories for all sessions is 417,381 bytes. The second result is greater than the first, because some sessions have deallocated memory since allocating their maximum amounts.
You can use the result of either of these queries to determine how much larger to make the shared pool if you use a shared server architecture. The first value is likely to be a better estimate than the second unless nearly all sessions are likely to reach their maximum allocations at the same time.
You can set the PRIVATE_SGA resource limit to restrict the memory used by each client session from the SGA. PRIVATE_SGA defines the number of bytes of memory used from the SGA by a session. However, this parameter is used rarely, because most DBAs do not limit SGA consumption an a user-by-user basis.
|
See Also:
Oracle9i SQL Reference, |
If you have a high number of connected users, then you can reduce memory usage by implementing "three-tier connections". This by-product of using a TP monitor is feasible only with pure transactional models, because locks and uncommitted DMLs cannot be held between calls. A shared server environment is much less restrictive of the application design than a TP monitor. It dramatically reduces operating system process count and context switches by enabling users to share a pool of servers. A shared server environment also substantially reduces overall memory usage even though more SGA is used in shared server mode.
If you have no library cache misses, then you might be able to accelerate execution calls by setting the value of the initialization parameter CURSOR_SPACE_FOR_TIME to true. This parameter specifies whether a cursor can be deallocated from the library cache to make room for a new SQL statement. CURSOR_SPACE_FOR_TIME has the following values meanings:
false (the default), then a cursor can be deallocated from the library cache regardless of whether application cursors associated with its SQL statement are open. In this case, Oracle must verify that the cursor containing the SQL statement is in the library cache.
true, then a cursor can be deallocated only when all application cursors associated with its statement are closed. In this case, Oracle need not verify that a cursor is in the cache, because it cannot be deallocated while an application cursor associated with it is open.
Setting the value of the parameter to true saves Oracle a small amount of time and can slightly improve the performance of execution calls. This value also prevents the deallocation of cursors until associated application cursors are closed.
Do not set the value of CURSOR_SPACE_FOR_TIME to true if you have found library cache misses on execution calls. Such library cache misses indicate that the shared pool is not large enough to hold the shared SQL areas of all concurrently open cursors. If the value is true, and if the shared pool has no space for a new SQL statement, then the statement cannot be parsed, and Oracle returns an error saying that there is no more shared memory. If the value is false, and if there is no space for a new statement, then Oracle deallocates an existing cursor. Although deallocating a cursor could result in a library cache miss later (only if the cursor is reexecuted), it is preferable to an error halting your application because a SQL statement cannot be parsed.
Do not set the value of CURSOR_SPACE_FOR_TIME to true if the amount of memory available to each user for private SQL areas is scarce. This value also prevents the deallocation of private SQL areas associated with open cursors. If the private SQL areas for all concurrently open cursors fills your available memory so that there is no space for a new SQL statement, then the statement cannot be parsed. Oracle returns an error indicating that there is not enough memory.
If an application repeatedly issues parse calls on the same set of SQL statements, then the reopening of the session cursors can affect system performance. Session cursors can be stored in a session cursor cache. This feature can be particularly useful for applications designed using Oracle Forms, because switching from one form to another closes all session cursors associated with the first form.
Oracle checks the library cache to determine whether more than three parse requests have been issued on a given statement. If so, then Oracle assumes that the session cursor associated with the statement should be cached and moves the cursor into the session cursor cache. Subsequent requests to parse that SQL statement by the same session then find the cursor in the session cursor cache.
To enable caching of session cursors, you must set the initialization parameter SESSION_CACHED_CURSORS. The value of this parameter is a positive integer specifying the maximum number of session cursors kept in the cache. An LRU algorithm removes entries in the session cursor cache to make room for new entries when needed.
You can also enable the session cursor cache dynamically with the statement:
ALTERSESSIONSETSESSION_CACHED_CURSORS= <value>;
To determine whether the session cursor cache is sufficiently large for your instance, you can examine the session statistic "session cursor cache hits" in the V$SYSSTAT view. This statistic counts the number of times a parse call found a cursor in the session cursor cache. If this statistic is a relatively low percentage of the total parse call count for the session, then consider setting SESSION_CACHED_CURSORS to a larger value.
Although Oracle breaks down very large requests for memory into smaller chunks, on some systems there might still be a requirement to find a contiguous chunk (for example, over 5k) of memory. (The default minimum reserved pool allocation is 4400.)
If there is not enough free space in the shared pool, then Oracle must search for and free enough memory to satisfy this request. This operation could conceivably hold latch resource for detectable periods of time, causing minor disruption to other concurrent attempts at memory allocation.
The most efficient way of allocating large chunks is to have a small reserved memory area in the shared pool that can be used if the shared pool does not have enough space. This is called the reserved pool.
The reserved pool area of the shared pool provides an additional memory area that is used if there is not enough space in the shared pool. This memory area avoids the overheads required to find and create space for large allocations in the shared pool. Small objects cannot fragment the reserved list, because they cannot use the reserved pool, helping to ensure that the reserved pool has large contiguous chunks of memory.
By default, Oracle configures a small reserved pool. This memory can be used for operations such as temporary space while loading Java objects or PL/SQL and trigger compilation. After the memory allocated from the reserved pool is freed, it returns to the reserved pool.
It is unlikely that you need to change the default amount of space Oracle reserves. However, if necessary, the reserved pool size can be changed by setting the SHARED_POOL_RESERVED_SIZE initialization parameter. This parameter sets aside space in the shared pool for unusually large allocations.
For large allocations, the order in which Oracle attempts to allocate space in the shared pool is the following:
The default value for SHARED_POOL_RESERVED_SIZE is 5% of the SHARED_POOL_SIZE. This means that, by default, the reserved list is configured.
If you set SHARED_POOL_RESERVED_SIZE > 1/2 SHARED_POOL_SIZE, then Oracle signals an error. Oracle does not let you reserve too much memory for the reserved pool. The amount of operating system memory, however, might constrain the size of the shared pool. In general, set SHARED_POOL_RESERVED_SIZE to 10% of SHARED_POOL_SIZE. For most systems, this value is sufficient if you have already tuned the shared pool. If you increase this value, then the database takes memory from the shared pool. (This reduces the amount of unreserved shared pool memory available for smaller allocations.)
Statistics from the V$SHARED_POOL_RESERVED view help you tune these parameters. On a system with ample free memory to increase the size of the SGA, the goal is to have REQUEST_MISSES = 0. If the system is constrained for operating system memory, then the goal is to not have REQUEST_FAILURES or at least prevent this value from increasing.
If you cannot achieve this, then increase the value for SHARED_POOL_RESERVED_SIZE. Also, increase the value for SHARED_POOL_SIZE by the same amount, because the reserved list is taken from the shared pool.
The reserved pool is too small when the value for REQUEST_FAILURES is more than zero and increasing. To resolve this, increase the value for the SHARED_POOL_RESERVED_SIZE and SHARED_POOL_SIZE accordingly. The settings you select for these depend on your system's SGA size constraints.
Increasing the value of SHARED_POOL_RESERVED_SIZE increases the amount of memory available on the reserved list without having an effect on users who do not allocate memory from the reserved list.
Too much memory might have been allocated to the reserved list if:
If either of these is true, then decrease the value for SHARED_POOL_RESERVED_SIZE.
The V$SHARED_POOL_RESERVED fixed view can also indicate when the value for SHARED_POOL_SIZE is too small. This can be the case if REQUEST_FAILURES > 0 and increasing.
If you have enabled the reserved list, then decrease the value for SHARED_POOL_RESERVED_SIZE. If you have not enabled the reserved list, then you could increase SHARED_POOL_SIZE.
After an entry has been loaded into the shared pool, it cannot be moved. Sometimes, as entries are loaded and aged, the free memory can become fragmented.
Use the PL/SQL package DBMS_SHARED_POOL to manage the shared pool. Shared SQL and PL/SQL areas age out of the shared pool according to a "least recently used" (LRU) algorithm, similar to database buffers. To improve performance and prevent reparsing, you might want to prevent large SQL or PL/SQL areas from aging out of the shared pool.
The DBMS_SHARED_POOL package lets you keep objects in shared memory, so that they do not age out with the normal LRU mechanism. By using the DBMS_SHARED_POOL package and by loading the SQL and PL/SQL areas before memory fragmentation occurs, the objects can be kept in memory. This ensures that memory is available, and it prevents the sudden, inexplicable slowdowns in user response time that occur when SQL and PL/SQL areas are accessed after aging out.
The DBMS_SHARED_POOL package is useful for the following:
STANDARD and DIUTIL packages. When large PL/SQL objects are loaded, user response time may be affected if smaller objects that need to age out of the shared pool to make room. In some cases, there might be insufficient memory to load the large objects.
DBMS_SHARED_POOL supports sequences. Sequence numbers are lost when a sequence ages out of the shared pool. DBMS_SHARED_POOL keeps sequences in the shared pool, thus preventing the loss of sequence numbers.
To use the DBMS_SHARED_POOL package to pin a SQL or PL/SQL area, complete the following steps.
DBMS_SHARED_POOL.KEEP to pin your objects.
This procedure ensures that your system does not run out of shared memory before the kept objects are loaded. By pinning the objects early in the life of the instance, you prevent memory fragmentation that could result from pinning a large portion of memory in the middle of the shared pool.
|
See Also:
Oracle9i Supplied PL/SQL Packages Reference for specific information on using |
One of the first stages of parsing is to compare the text of the statement with existing statements in the shared pool to see if the statement can be shared. If the statement differs textually in any way, then Oracle does not share the statement.
Exceptions to this are possible when the parameter CURSOR_SHARING has been set to SIMILAR or FORCE. When this parameter is used, Oracle first checks the shared pool to see if there is an identical statement in the shared pool. If an identical statement is not found, then Oracle searches for a similar statement in the shared pool. If the similar statement is there, then the parse checks continue to verify the executable form of the cursor can be used. If the statement is not there, then a hard parse is necessary to generate the executable form of the statement.
Statements that are identical, except for the values of some literals, are called similar statements. Similar statements pass the textual check in the parse phase when the CURSOR_SHARING parameter is set to SIMILAR or FORCE. Textual similarity does not guarantee sharing. The new form of the SQL statement still needs to go through the remaining steps of the parse phase to ensure that the execution plan of the preexisting statement is equally applicable to the new statement.
Setting CURSOR_SHARING to EXACT allows SQL statements to share the SQL area only when their texts match exactly. This is the default behavior. Using this setting, similar statements cannot shared; only textually exact statements can be shared.
Setting CURSOR_SHARING to either SIMILAR or FORCE allows similar statements to share SQL. The difference between SIMILAR and FORCE is that SIMILAR forces similar statements to share the SQL area without deteriorating execution plans. Setting CURSOR_SHARING to FORCE forces similar statements to share the executable SQL area, potentially deteriorating execution plans. Hence, FORCE should be used as a last resort, when the risk of suboptimal plans is outweighed by the improvements in cursor sharing.
The CURSOR_SHARING initialization parameter can solve some performance problems. It has the following values: FORCE, SIMILAR, and EXACT (default). Using this parameter provides benefit to existing applications that have many similar SQL statements.
|
Note:
Oracle does not recommend setting |
The optimal solution is to write sharable SQL, rather than rely on the CURSOR_SHARING parameter. This is because although CURSOR_SHARING does significantly reduce the amount of resources used by eliminating hard parses, it requires some extra work as a part of the soft parse to find a similar statement in the shared pool.
Consider setting CURSOR_SHARING to SIMILAR or FORCE if you can answer 'yes' to both of the following questions:
Using CURSOR_SHARING = SIMILAR (or FORCE) can significantly improve cursor sharing on some applications that have many similar statements, resulting in reduced memory usage, faster parses, and reduced latch contention.
If your application uses Java, you should investigate whether you need to modify the default configuration for the Java pool.
Server processes making changes to data blocks in the buffer cache generate redo data into the log buffer. LGWR begins writing to copy entries from the redo log buffer to the online redo log if any of the following are true:
COMMIT or ROLLBACK.
When LGWR writes redo entries from the redo log buffer to a redo log file or disk, user processes can then copy new entries over the entries in memory that have been written to disk. LGWR usually writes fast enough to ensure that space is available in the buffer for new entries, even when access to the redo log is heavy.
A larger buffer makes it more likely that there is space for new entries, and also gives LGWR the opportunity to efficiently write out redo records (a too small log buffer on a system with large updates means that LGWR is continuously flushing redo to disk so that the log buffer remains 2/3 empty).
On machines with fast processors and relatively slow disks, the processors might be filling the rest of the buffer in the time it takes the redo log writer to move a portion of the buffer to disk. A larger log buffer may temporarily mask the effect of slower disks in this situation.
Good usage of the redo log buffer is a simple matter of:
NOLOGGING operations when you are loading large quantities of data
The size of the redo log buffer is determined by the initialization parameter LOG_BUFFER. The log buffer size cannot be modified after instance startup.

Applications that insert, modify, or delete large volumes of data usually need to change the default log buffer size. The log buffer is small compared with the total SGA size, and a modestly sized log buffer can significantly enhance throughput on systems that perform many updates.
A reasonable first estimate for such systems is to make the log buffer 1m. On most systems, sizing the log buffer larger than 1m does not provide any performance benefit. Increasing the log buffer size does not have any negative implications on performance or recoverability. It merely uses extra memory.
The statistic REDO BUFFER ALLOCATION RETRIES reflects the number of times a user process waits for space in the redo log buffer. This statistic can be queried via the dynamic performance view V$SYSSTAT.
Use the following query to monitor these statistics over a period of time while your application is running:
SELECT NAME, VALUE
  FROM V$SYSSTAT
 WHERE NAME = 'redo buffer allocation retries';
The value of redo buffer allocation retries should be near zero over an interval. If this value increments consistently, then processes have had to wait for space in the redo log buffer. The wait can be caused by the log buffer being too small or by checkpointing. Increase the size of the redo log buffer, if necessary, by changing the value of the initialization parameter LOG_BUFFER. The value of this parameter is expressed in bytes. Alternatively, improve the checkpointing or archiving process.
Another data source is to check whether the log buffer space wait event is not a significant factor in the wait time for the instance; if not, the log buffer size is most likely adequate.
The Program Global Area (PGA) is a private memory region containing data and control information for a server process. Access to it is exclusive to that server process and is read and written only by the Oracle code acting on behalf of it. An example of such information is the runtime area of a cursor. Each time a cursor is executed, a new runtime area is created for that cursor in the PGAFoot 1 memory region of the server process executing that cursor.
For complex queries (for example, decision support queries), a big portion of the runtime area is dedicated to work areas allocated by memory intensive operators, such as the following:
ORDER BY, GROUP BY, ROLLUP, window functions)
A sort operator uses a work area (the sort area) to perform the in-memory sort of a set of rows. Similarly, a hash-join operator uses a work area (the hash area) to build a hash table from its left input.
The size of a work area can be controlled and tuned. Generally, bigger work areas can significantly improve the performance of a particular operator at the cost of higher memory consumption. Ideally, the size of a work area is big enough that it can accommodate the input data and auxiliary memory structures allocated by its associated SQL operator. This is known as the optimal size of a work area. When the size of the work area is smaller than optimal, the response time increases, because an extra pass is performed over part of the input data. This is known as the one-pass size of the work area. Under the one-pass threshold, when the size of a work area is far too small compared to the input data size, multiple passes over the input data are needed. This could dramatically increase the response time of the operator. This is known as the multi-pass size of the work area. For example, a serial sort operation that needs to sort 10GB of data needs a little more than 10GB to run optimal and at least 40MB to run one-pass. If this sort gets less that 40MB, then it must perform several passes over the input data.
The goal is to have most work areas running with an optimal size (for example, more than 90% or even 100% for pure OLTP systems), while a smaller fraction of them are running with a one-pass size (for example, less than 10%). Multi-pass execution should be avoided. Even for DSS systems running large sorts and hash-joins, the memory requirement for the one-pass executions is relatively small. A system configured with a reasonable amount of PGA memory should not need to perform multiple passes over the input data.
Prior to release 9i, the maximum size of these working areas was controlled using the SORT_AREA_SIZE, HASH_AREA_SIZE, BITMAP_MERGE_AREA_SIZE and CREATE_BITMAP_AREA_SIZE parameters. Setting these parameters is difficult, because the maximum work area size is ideally selected based on the data input size and the total number of work areas active in the system. These two factors vary a lot from one work area to another and from one point in time to another. Thus, the various *_AREA_SIZE parameters are hard to tune under the best of circumstances.
|
See Also:
|
With release 9i, it is possible to simplify and improve the way the PGA is allocated. There is an automatic mode to dynamically adjust the size of the portion of the PGA memory dedicated to work areas. The size of that portion is adjusted based on an overall PGA memory target explicitly set by the DBA.
When running under the automatic PGA memory management mode, sizing of work areas for all dedicated sessions becomes automatic. Thus, the *_AREA_SIZE parameters are ignored by all sessions running in that mode. At any given time, the total amount of PGA memory available to work areas active in the instance is automatically derived from the parameter PGA_AGGREGATE_TARGET. This amount is set to the value of PGA_AGGREGATE_TARGET minus the PGA memory allocated by other components of the system (for example, PGA memory allocated by sessions). The resulting PGA memory is then assigned to individual active work areas based on their specific memory requirements.
The value of the PGA_AGGREGATE_TARGET initialization parameter, for example 100000K, 2500M, or 50G, should be set based on the total amount of memory available for the Oracle instance. This value can then be dynamically modified at the instance level.
For example, assume that an Oracle instance is configured to run on a system with 4GB of physical memory. Part of that memory should be left for the operating system and other non-Oracle applications running on the same hardware system. For example, the DBA might decide to dedicate only 80% of the available memory to the Oracle instance (3.2GB in the above example). The DBA must then decide how to divide the resulting memory between the SGA and the PGA. For OLTP systems, the PGA memory typically accounts for at most 20% of that total (that is, 80% for the SGA), while decision support systems (DSS) running large memory-intensive queries typically dedicate up to 70% of that memory to the PGA (that is, up to 2.2GB).
A good starting point to set the parameter PGA_AGGREGATE_TARGET could be:
PGA_AGGREGATE_TARGET = (TOTAL_MEM * 80%) * 20% for an OLTP system
PGA_AGGREGATE_TARGET = (TOTAL_MEM * 80%) * 50% for a DSS system
where TOTAL_MEM is the total amount of physical memory available on the system. Using the above computation and a value of TOTAL_MEM equal to 4GB, the DBA sets PGA_AGGREGATE_TARGET to 1600M for the DSS system and to 655M for the OLTP system.
After the PGA_AGGREGATE_TARGET parameter is configured and the instance is restarted, the PGA memory management of SQL work areas becomes fully automatic for all dedicated Oracle server processes. Under this automatic mode, Oracle tries to maximize the number of work areas that are using optimal memory and uses one-pass memory for the others. A work area should not run multi-pass under the automatic mode unless PGA_AGGREGATE_TARGET is set to a value that is too small for the instance workload. If this is the case, then increase its value (and probably decrease the size of the SGA accordingly).
Several dynamic performance views help tune the value of the parameter PGA_AGGREGATE_TARGET:
Statistics in the V$SYSSTAT and V$SESSTAT views show the total number of work areas executed with optimal memory size, one-pass memory size, and multi-pass memory size. These statistics are cumulative since the instance or the session was started.
The following query gives the total number and the percentage of times work areas were executed in these three modes since the instance was started:
SELECT name profile, cnt, decode(total, 0, 0, round(cnt*100/total)) percentage
    FROM (SELECT name, value cnt, (sum(value) over ()) total
    FROM V$SYSSTAT
    WHERE name like 'workarea exec%');
The output of this query might look like the following:
PROFILE                                    CNT PERCENTAGE
----------------------------------- ---------- ----------
workarea executions - optimal             5395         95
workarea executions - onepass              284          5
workarea executions - multipass              0          0
This output tells the DBA if he/she needs to change the setting of PGA_AGGREGATE_TARGET. This can be done dynamically with an ALTER SYSTEM statement. For example, if the number of multi-pass executions is not zero, then consider increasing the value of this parameter. Also consider increasing the value of this parameter when the percentage of one-pass executions is high compared to optimal. On the other hand, if the percentage of optimal work area is 100%, then consider reducing the PGA target.
The V$PGASTAT view gives instance level statistics on the PGA usage and the automatic memory manager. All values are returned in bytes. For example:
SELECT name, value
FROM V$PGASTAT;
The output of this query might look like the following:
NAME                                                             VALUE
---------------------------------------------------------------- ----------
aggregate PGA auto target                                         912052224
global memory bound                                                   51200
total expected memory                                                262144
total PGA inuse                                                    35444736
total PGA allocated                                                53967872
maximum PGA allocated                                              66970624
total PGA used for auto workareas                                    262144
maximum PGA used for auto workareas                                 5292032
total PGA used for manual workareas                                       0
maximum PGA used for manual workareas                                     0
estimated PGA memory for optimal                                     262144
maximum PGA memory for optimal                                    500123520
estimated PGA memory for one-pass                                    262144
maximum PGA memory for one-pass                                    70123520
The main statistics are:
aggregate PGA auto target: This gives the amount of PGA memory Oracle can use for work areas running in automatic mode. This amount is derived from the value of the parameter PGA_AGGREGATE_TARGET. If this value is too low compared to PGA_AGGREGATE_TARGET, then a lot of PGA memory is used by other components of the system (for example, PL/SQL or Java memory) and little is left for work areas.
global memory bound: This gives the maximum size of a work area executed in AUTO mode. This value is continuously adjusted by Oracle to reflect to current state of the work area workload. It generally decreases when the number of active work areas is increasing in the system. In general, the value of the global bound should not decrease below one megabyte. If it does, then the value of PGA_AGGREGATE_TARGET should probably be increased.
total PGA allocated: This gives the current amount of PGA memory allocated by the instance. Oracle tries to keep this number below the value of PGA_AGGREGATE_TARGET. However, it is possible for the PGA to be over allocated by a small amount and for a short period of time when the work area workload is increasing very rapidly.
total PGA used for auto workareas: This indicates how much PGA memory is consumed by work areas running in automatic memory management mode. This number can be used to determine how much memory is consumed by other consumers of PGA memory (for example, PL/SQL or Java):
PGA other = 'total PGA allocated' - 'total PGA used for auto workareas'
Over allocating PGA memory can also happen if the value of PGA_AGGREGATE_TARGET is too small to accommodate this 'PGA other' component. If this is the case (that is, 'PGA other' > PGA_AGGREGATE_TARGET), then increase the value of PGA_AGGREGATE_TARGET.
estimated PGA memory for optimal/one-pass: This estimates how much PGA memory is required to run all active work areas in optimal mode (respectively in one-pass mode). To avoid running one or more work areas in multi-pass mode, ensure that PGA_AGGREGATE_TARGET is set to at least the maximum value of the estimated PGA memory for one-pass and generally to a higher value such that some work areas get enough memory to run in optimal mode.
The V$PROCESS view has one row per Oracle process connected to the instance. The columns PGA_USED_MEM, PGA_ALLOC_MEM and PGA_MAX_MEM can be used to monitor the PGA memory usage of these processes. For example:
SELECT program, pga_used_mem, pga_alloc_mem, pga_max_mem
FROM V$PROCESS;
The output of this query might look like the following:
PROGRAM                        PGA_USED_MEM PGA_ALLOC_MEM PGA_MAX_MEM
------------------------------ ------------ ------------- -----------
PSEUDO                                    0             0           0
oracle@miflo (PMON)                  120463        234291      234291
oracle@miflo (DBW0)                 1307179       1817295     1817295
oracle@miflo (LGWR)                 4343655       4849203     4849203
oracle@miflo (CKPT)                  194999        332583      332583
oracle@miflo (SMON)                  179923        775311      775323
oracle@miflo (RECO)                  129719        242803      242803
oracle@miflo (TNS V1-V3)            1400543       1540627     1540915
oracle@miflo (P000)                  299599        373791      635959
oracle@miflo (P001)                  299599        373791      636007
oracle@miflo (P002)                  299599        373791      570471
oracle@miflo (P003)                  303899        373791      636007
oracle@miflo (P004)                  299599        373791      635959
Query V$SQL_WORKAREA_ACTIVE to display the work areas that are active (or executing) in the instance. Small active sorts (under 64KB) are excluded from the view. Use this view to precisely monitor the size of all active work areas. For example:
  SELECT   to_number(decode(SID, 65535, NULL, SID)) sid,
           operation_type OPERATION,
           trunc(WORK_AREA_SIZE/1024) WSIZE,
           trunc(EXPECTED_SIZE/1024) ESIZE,
           trunc(ACTUAL_MEM_USED/1024) MEM,
           trunc(MAX_MEM_USED/1024) "MAX MEM",
           NUMBER_PASSES PASS
  FROM V$SQL_WORKAREA_ACTIVE
  ORDER BY 1,2;
The output of this query might look like the followingFoot 2:
SID OPERATION             WSIZE     ESIZE       MEM   MAX MEM PASS
--- --------------------- ----- --------- --------- --------- ----
 27 GROUP BY (SORT)          73        73        64        64    0
 44 HASH-JOIN              3148      3147      2437      2437    0
 71 HASH-JOIN             13241     19200     12884     34684    1
This output shows that session 71 is running a hash-join whose work area is running in one-pass mode. This work area is currently using 12MB of memory (MEM column) and has used in the past up to 34MB of PGA memory (MAX MEM column). When a work area is deallocated, that is, when the execution of its associated SQL operator is completed, the work area is automatically removed from the V$SQL_WORKAREA_ACTIVE view.
Oracle maintains cumulative work area statistics for each loaded cursor whose execution plan uses one or more work areas. Every time a work area is deallocated, the V$SQL_WORKAREA table is updated with execution statistics for that work area.
V$SQL_WORKAREA can be joined with V$SQL to relate a work area to a cursor. It can even be joined to V$SQL_PLAN to precisely determine which operator in the plan uses a work area.
The following example finds the top 10 work areas requiring most cache memory:
SELECT *
FROM
     ( SELECT workarea_address, operation_type, policy, estimated_optimal_size
       FROM V$SQL_WORKAREA
       ORDER BY estimated_optimal_size )
WHERE ROWNUM <= 10;
The following example finds the cursors with one or more work areas that have been executed in one or even multiple passes:
SELECT sql_text, sum(ONEPASS_EXECUTIONS), sum(MULTIPASSES_EXECUTIONS)
FROM V$SQL s, V$SQL_WORKAREA wa
WHERE s.address = wa.address
GROUP BY sql_text
HAVING sum(ONEPASS_EXECUTIONS+MULTIPASSES_EXECUTIONS)>0;
For the hash value and address of a particular cursor, the following query displays the cursor execution plan, including information about the associated work areas.
SELECT operation, options, object_name name,
       trunc(bytes/1024/1024) "input(MB)",
       trunc(last_memory_used/1024) last_mem,
       trunc(estimated_optimal_size/1024) optimal_mem,
       trunc(estimated_onepass_size/1024) onepass_mem,
       decode(optimal_executions, null, null,
              optimal_executions||'/'||onepass_executions||'/'||
              multipasses_exections) "O/1/M"
FROM V$SQL_PLAN p, V$SQL_WORKAREA w
WHERE p.address=w.address(+)
  AND p.hash_value=w.hash_value(+)
  AND p.id=w.operation_id(+)
  AND p.address='88BB460C';

OPERATION    OPTIONS  NAME     input(MB) LAST_MEM OPTIMAL_ME ONEPASS_ME O/1/M
------------ -------- -------- --------- -------- ---------- ---------- ------
SELECT STATE
SORT         GROUP BY               4582        8         16         16 16/0/0
HASH JOIN    SEMI                   4582     5976       5194       2187 16/0/0
TABLE ACCESS FULL     ORDERS          51
TABLE ACCESS FUL      LINEITEM      1000
The address and hash value can be obtained from the V$SQL view given a pattern on the SQL text of the query of interest. For example:
SELECT address, hash_value
FROM V$SQL
WHERE sql_text LIKE '%my pattern%';
Tuning sort operations using SORT_AREA_SIZE is only relevant for configurations running the Oracle shared server option or for configurations not running under the automatic memory management mode. In the later case, Oracle Corporation strongly recommends switching to the automatic memory management mode, because it is easier to manage and often outperforms a manually-tuned system.
This section describes the following:
A sort is an operation that orders data according to certain criteria before the data is returned to the requestor.
Operations that perform sorts include the following:
CREATE INDEX
SELECT .... ORDER BY
SELECT DISTINCT
SELECT .... GROUP BY
SELECT ... CONNECT BY
SELECT ... CONNECT BY ROLLUP
When the WORKAREA_SIZE_POLICY parameter is set to MANUAL, the maximum amount of memory allocated for a sort is defined by the parameter SORT_AREA_SIZE. If the sort operation is not able to completely fit into SORT_AREA_SIZE memory, then the sort is separated into phases. The temporary output of each phase is stored in temporary segments on disk. The tablespace in which these sort segments are created is the user's temporary tablespace.
When Oracle writes sort operations to disk, it writes out partially sorted data in sorted runs. After all the data has been received by the sort, Oracle merges the runs to produce the final sorted output. If the sort area is not large enough to merge all the runs at once, then subsets of the runs are merged in several merge passes. If the sort area is larger, then there are fewer, longer runs produced. A larger sort area also means that the sort can merge more runs in one merge pass.
Oracle collects statistics that reflect sort activity and stores them in dynamic performance views, such as V$SQLAREA and V$SYSSTAT.
The following statistics from V$SYSSTAT reflect sort behavior:
For example, the following query monitors these statistics:
SELECT NAME, VALUE
  FROM V$SYSSTAT
 WHERE NAME IN ('sorts (memory)', 'sorts (disk)');
The output of this query might look like the following:
NAME                                                                  VALUE
---------------------------------------------------------------- ----------
sorts (memory)                                                    430418566
sorts (disk)                                                          33255
In addition, to find individual SQL statements that are performing sorts, query the V$SQLAREA view. Order the rows by SORTS to identify the SQL statements performing the most sorts. For example:
SELECT HASH_VALUE, SQL_TEXT, SORTS, EXECUTIONS
  FROM V$SQLAREA
 ORDER BY SORTS;
In an OLTP environment, the best solution is to investigate whether the SQL statements can be tuned to avoid the sort activity.
For best performance in OLTP systems, most sorts should occur solely within memory. Sorts written to disk can adversely affect performance. If your OLTP application frequently performs sorts that do not fit into sort area size, and if the application has been tuned to avoid unnecessary sorting, then consider increasing the SORT_AREA_SIZE parameter for the whole instance.
If there are only a few programs that perform larger than average sorts that sort to disk, then it is possible to modify SORT_AREA_SIZE at the session level only for that workload or application (for example, building an index).
DSS applications typically access large volumes of data. These types of applications are expected to perform sorts to disk, purely because of the nature of the application and the data volumes involved. In DSS applications, it is important to identify the optimal SORT_AREA_SIZE to allow the disk sorts to perform most efficiently. Allocating more memory to sorts does not necessarily mean that the sort will be faster.
The main consideration when choosing SORT_AREA_SIZE is balancing memory usage with sort performance.
Since Oracle8 release 8.0, sorts do not allocate the whole of SORT_AREA_SIZE in one memory allocation at the beginning of the sort. The memory is allocated in DB_BLOCK_SIZE chunks when required, up to SORT_AREA_SIZE.
This means that increasing SORT_AREA_SIZE memory is a concern when the majority of processes on the system perform sorts and use the maximum allocation. In this situation, increasing SORT_AREA_SIZE for the instance as a whole results in more memory being allocated from the operating system (for dedicated connections; that is, if a shared server environment is not used). This is not necessarily a problem if the system has free memory available. However, if there is not enough free memory, then this causes paging and/or swapping.
If a shared server environment is used, then the additional memory is allocated out of the shared pool (the large pool in the shared pool, if this is configured). The actual amount of memory used in the shared pool is the lesser of SORT_AREA_SIZE, SORT_AREA_RETAINED_SIZE, and the actual allocation used by the sort.
If the SORT_AREA_SIZE is too small, then the sort is not performed as efficiently as possible. This means that sorts that could have been memory-only sorts will be disk sorts, or, alternatively, that the number of sort runs required to process the sort could be larger than necessary. Both of these situations can severely degrade performance.
Remember that there is a point after which increasing the SORT_AREA_SIZE no longer provides a performance benefit.
SORT_AREA_SIZE is a dynamically modifiable initialization parameter that specifies the maximum amount of memory to use for each sort. If a significant number of sorts require disk I/O to temporary segments, then your application's performance might benefit from increasing the value of SORT_AREA_SIZE. Alternatively in a DSS environment, increasing SORT_AREA_SIZE is not likely to make the sort a memory-only sort; however, depending on the current value and the new value chosen, it could make the sort faster.
The maximum value of this parameter depends on your operating system. You need to determine what size SORT_AREA_SIZE makes sense for your system.
The SORT_AREA_RETAINED_SIZE parameter determines the lower memory limit to which Oracle reduces the size of the sort area after the sort has started sending the sorted data to the user or to the next part of the query.
With dedicated connections, the freed memory is not released to the operating system, rather the freed memory is made available to the session for reuse.
However, if the connection is via shared server, then there could be a memory benefit to setting SORT_AREA_RETAINED_SIZE. If this parameter is set after the sort has completed, then the sorted data is stored in the SGA. The amount of memory used in the SGA is the lesser of the actual usage or SORT_AREA_RETAINED_SIZE if it is set; otherwise, it is SORT_AREA_SIZE. This is why setting SORT_AREA_RETAINED_SIZE could be of use with a shared server environment.
Although there might be a memory saving with shared server, setting SORT_AREA_RETAINED_SIZE causes additional I/O to write and read data to and from temporary segments on disk (if the sort requires more than SORT_AREA_RETAINED_SIZE bytes).
One cause of sorting is the creation of indexes. Creating an index for a table involves sorting all rows in the table based on the values of the indexed columns. However, Oracle lets you create indexes without sorting. If the rows in the table are loaded in ascending order, then you can create the index faster without sorting.
To create an index without sorting, load the rows into the table in ascending order of the indexed column values. Your operating system might provide a sorting utility to sort the rows before you load them. When you create the index, use the NOSORT clause on the CREATE INDEX statement. For example, the following CREATE INDEX statement creates the index emp_index on the ename column of the emp table without sorting the rows in the emp table:
CREATE INDEX emp_index
   ON emp(ename)
   NOSORT;
Presorting your data and loading it in order might not be the fastest way to load a table.
NOSORT clause.
NOSORT clause.
Sorting can be avoided when performing a GROUP BY operation when you know that the input data is already ordered, so that all rows in each group are clumped together. This can be the case if the rows are being retrieved from an index that matches the grouped columns, or if a sort merge join produces the rows in the right order. ORDER BY sorts can be avoided in the same circumstances. When no sort takes place, the EXPLAIN PLAN output indicates GROUP BY NOSORT.
If the overriding performance problem is that the server simply does not have enough memory to run the application as currently configured and the application is logically a single application (that is, it cannot readily be segmented or distributed across multiple servers), then only two possible solutions exist:
If the application is a large OLTP system, dramatic reductions in server memory usage can come from reducing the number of database connections, which in turn can resolve issues relating to the number of open network sockets and the number of operating system processes. However, to reduce the number of connections without reducing the number of users, the connections that remain must be shared. This forces the user processes to adhere to a paradigm in which every message request sent to the database describes a complete or atomic transaction.
Writing applications to conform to this model is not necessarily either restrictive or difficult, but it is certainly different. Conversion of an existing application, such as an Oracle Forms suite, to conform is not normally possible without a complete rewrite.
The Oracle shared server architecture is an effective solution for reducing the number of server operating system processes. Shared server is also quite effective at reducing overall memory requirements. You can also use shared server to reduce the number of network connections when you use a shared server architecture with connection pooling and session multiplexing.
Shared connections are possible in Oracle Forms environments when you use an intermediate server that is also a client. In this configuration, use the DBMS_PIPE package to transmit atomic requests from the user's individual connection on the intermediate server to a shared daemon in the intermediate server. The daemon, in turn, owns a connection to the central server.
1
Part of the run-time area can be located in the SGA when using shared server.
2
The memory sizes has been converted into kilobytes by dividing by 1024.
|
|
 Copyright © 1996-2001, Oracle Corporation. All Rights Reserved. |
|