| Bookshelf Home | Contents | Index | Search | PDF | |
Siebel Tools Reference > Special-Purpose Applets and Controls >
Chart Applets
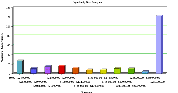
A chart applet graphically displays data from a business component in various formats for analysis of trends, category comparison, and other data relationships. Any data in a business component can be included in a chart. The data in a chart applet reflects the current query for the business component. The user can update the chart with changes to the query by clicking inside the chart. Figure 194 shows a chart applet in a view.
This view, titled Opportunity Size Analysis (Oppty Chart View - Opportunity Size Analysis in Siebel Tools), lists all opportunities in the upper (list) applet and aggregates them by size in the lower (chart) applet. By default, the chart applet in this view (Oppty Chart Applet - Competitor Frequency Analysis) displays the data in bar chart format, in a specific type of bar chart called 3dBar. The user can select different chart types from the Type picklist at upper right in the chart applet. Chart types are discussed in Chart Layout Options.
NOTE: To change the size of the legend for a chart applet, right-click on the legend and select one of the options.
| Bookshelf Home | Contents | Index | Search | PDF | |
Siebel Tools Reference, Version 7.5, Rev. A Published: 18 April 2003 |