AppXray: Introduction
This document describes the following:
- What Is AppXray?
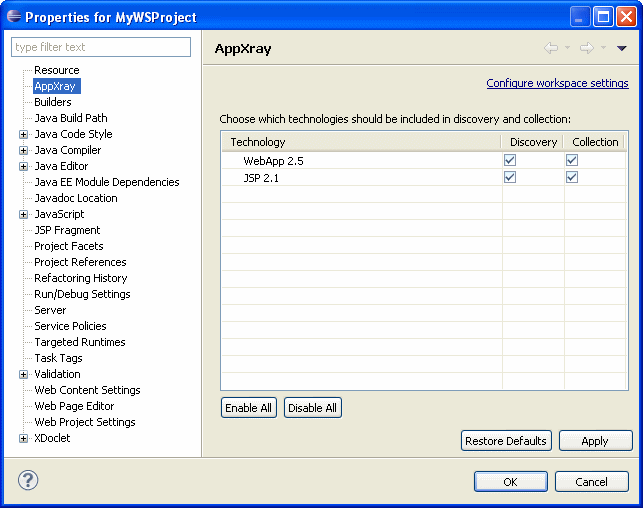
- Enabling and Disabling AppXray
- Visualizing AppXray Dependencies
- Related Information
Provided by OEPE, AppXray technology analyzes the JSP pages, Java source files, resource bundles, and Web configuration files of your application and uses this information to provide validation and consistency checking across many layers of the application, as well as source code completion and hyperlink navigation.
You can enable AppXray for your existing Web projects, or use it with your new dynamic Web projects for which it is enabled by default. Once available, AppXray will build its application database that allows it to track artifacts and populate it. If you have created a project using standard Web technologies, or if your project is JSP or JSF-enabled, those artifacts will be detected and added to the database. If you have enabled AppXray on an existing project, then artifacts in that project will be detected and added to the database. AppXray then uses this database for validation. As you work with your application, AppXray will automatically maintain the application database. If this degrades performance, you can selectively disable automatic maintenance and rebuild the application database as required.
Errors detected by AppXray are displayed in the Problems view, whereas dependencies are graphically displayed in AppXaminer.
AppXray collects information about the following:
2. Enabling and Disabling AppXray
3. Visualizing AppXray Dependencies To view dependencies for a Web project, do the following:
web.xml file
Note that you cannot modify default project-level settings.
commandLink tag to the section of the faces-config.xml file that defines the navigation rule.
Note that you can disable collection and leave discovery enabled for a particular technology, but not vice versa.

Figure 2. Properties Dialog - Expanded AppXray
Figure 8 shows AppXaminer's toolbar located in the upper right-hand corner of AppXaminer window. You can use this toolbar to zoom in and out of the view, print the diagram, and save it to an image file.
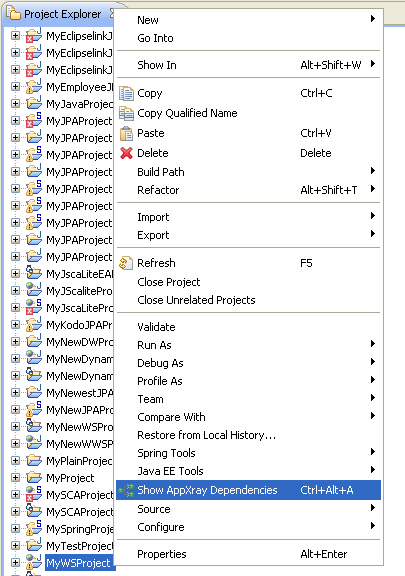
Figure 3. Displaying AppXray Dependencies
AppXaminer analyzes page, action, class, and many other dependency types. Initially all dependency types are active but can be easily reduced. AppXaminer displays a graph of dependencies between technology-specific artifacts in the project. You can drill down into additional detail on particular references: each dependency link has a number that indicates how many references the focal node contains to the referenced file, with upstream dependency nodes having an indicator on the source end of the link, and downstream nodes having the indicator on the destination end of the link. By clicking the number, you bring up a detail showing the nature of each reference, as Figure 4 shows.
By clicking one of the references you navigate to the corresponding reference location in the referring file. Figure 5 shows an example of how clicking on bean:message key="login.title" from the login.jsp file would opens the appropriate reference in in the source view.
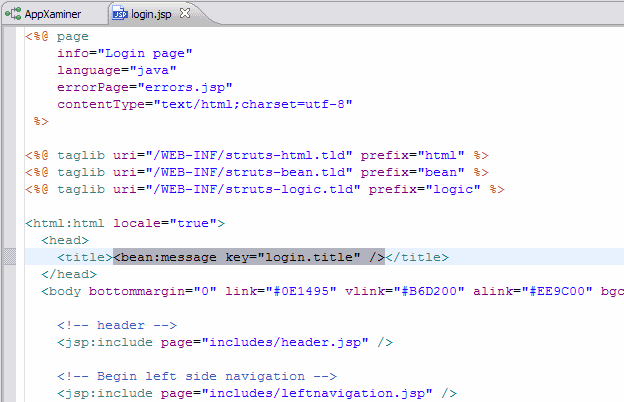
Figure 5. Reference in Source View
You can also right-click on a resource displayed in the AppXaminer diagram and select one of the following options from the drop-down menu:
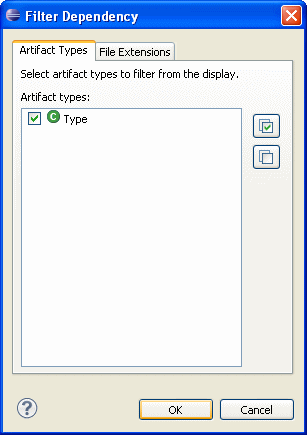
Figure 6. Filter Dependency Dialog - Artifact Types
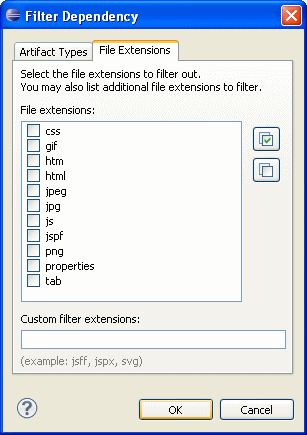
Figure 7. Filter Dependency Dialog - File Extensions
You can define your custom filter extensions on the Filter Dependency > File Extensions dialog. By filtering out dependencies, you reduce the number of dependencies displayed in the diagram.
Note the following:
