8 One View Reporting for Inventory Management
This chapter provides overview information, processing options, special processing, and reports for the following applications:
-
Section 8.1, "One View Average Cost Analysis from Item Ledger Inquiry (P41270)"
-
Section 8.2, "One View Inventory Valuation Analysis Inquiry (P41271)"
-
Section 8.3, "One View Inventory Cost Analysis By Item As Of Inquiry (P41272)"
8.1 One View Average Cost Analysis from Item Ledger Inquiry (P41270)
Access the One View Average Cost Analysis from Item Ledger Inquiry application (P41270) on the Inventory Inquiries (G41112) menu. Use One View Average Cost Analysis from Item Ledger Inquiry to analyze the average cost of items. One View Average Cost Analysis from Item Ledger Inquiry uses the One View Actual Cost Analysis - F4111 and F4101 business view (V41270A), which includes columns from the Item Ledger File table (F4111) and the Item Master table (F4101). One View Average Cost Analysis from Item Ledger Inquiry provides you with a broad view of the average cost of items within the same company. This information is helpful to identify the trending analysis and evaluate the cost of items by pulling in the data from the item ledger and item master.
8.1.1 Processing Options
Processing options enable you to specify the default processing for programs and reports.
8.1.1.1 Defaults
- 1. Document Company
-
Specify the document company that you want the system to use as the default value for filtering Item Ledger and Item Master lines.
- 2. Branch Plant
-
Specify the Branch Plant that you want the system to use as the default value for filtering Item Ledger and Item Master lines.
- 3. Document Type
-
Specify the document type that you want the system to use as the default value for filtering Item Ledger lines.
8.1.1.2 Process
- 1. Include all Item Ledger records
-
Specify whether to include/exclude records that have already been updated to the Item AS OF (F41112) table. This processing option will include the record only when it still exists in Item Ledger table.
Valid values are:
Blank: Do not include the records that have been updated to the Item As Of table.
1: Include the records that have been updated to the Item As Of table.
8.1.1.3 Versions
- 1. One View Average Cost Analysis from Item As Of (P41271)
-
Specify the version of One View Average Cost Analysis from Item As Of (41271) that the system uses to access the Average Cost Analysis from Item As Of application.
If you leave this processing option blank, the system uses version ZJDE0001.
- 2. One View Inventory Valuation Analysis (P41272)
-
Specify the version of One View Inventory Valuation Analysis (P41271) the system uses to access the Valuation Analysis application.
If you leave this processing option blank, the system uses version ZJDE0001.
- 3. One View Item Usage Trace (P41273)
-
Specify the version of One View Item Usage Trace (P41273) the system uses to access the Item Usage Trace application.
If you leave this processing option blank, the system uses version ZJDE0001.
8.1.2 Special Processing
This section explains some functionality for the One View Average Cost Analysis from Item Ledger Inquiry application.
Document Company is a required filter field. The processing option for this field can be blank, but if you tab out of this field in the application without entering a valid company, you will receive the error "Required Filter Criteria Not Entered."
F4111 records with a blank G/L date are not included in the average cost calculation. These records are:
-
Sales orders that have been ship confirmed but not run through Sales Update
-
Work orders that have been issued materials or completed but not run through the post program.
The quantity in the transaction UOM is converted to primary UOM based on the conversion factor specified in the item UOM conversion table or standard UOM conversion table. The system uses the flag Standard Unit of measure conversion (IFLA) to retrieve the conversion. The quantity in primary UOM appears in the Primary Quantity field. When an item with dual unit of measure is processed, the quantity in secondary transaction UOM is converted to secondary UOM of the item. The quantity in secondary UOM appears in the Primary Quantity Secondary field.
When there is no conversion defined for an item, either in the item UOM conversion table or standard UOM conversion table, then the columns "Primary Quantity, UOM, Primary Quantity Secondary" and "Primary UOM Secondary" are shown in red.
The month corresponding to the G/L date is displayed in the G/L month field. For example, if the G/L date is 01/15/2011 then the G/L month column contains "1."
8.1.3 Reports
The reports delivered with the One View Average Cost Analysis from Item Ledger application are:
-
Average Cost Analysis by Branch Plant
-
Average Cost Analysis by Lot Serial Number
-
Average Cost Analysis by Month/GL Date
-
Average Cost Analysis
8.1.3.1 Average Cost Analysis by Branch Plant
This report provides a view of the average cost of items across branch/plants within the same company. You also have the ability to view fluctuations in the average cost across branch/plants and over a span of several months.
This report contains the following components:
-
Average Cost of Item by Branch Plant (bar graph)
-
Average Cost of Item by Month (line graph)
-
Summary of Average Cost by Month and Branch Plant (table)
-
Average Cost of Item by Branch Plant Details Table
The Average Cost of Item by Branch Plant Details table component contains drill back functionality as described in the following table:
| Functionality | Value |
|---|---|
| Table column containing drill back link | Item Number |
| Table columns passed to application | Item, Branch Plant |
| Application called | Item Ledger Inquiry (P4111) |
| Form called | W4111A |
| Version called | ZJDE0001 |
8.1.3.2 Average Cost Analysis by Lot Serial Number
This report provides a broad view of the average cost of lot controlled/serialized items across branch/plants within the same company. You have the ability to view fluctuations in the average cost across branch/plants and over a span of several months.
This report contains the following components:
-
Average Cost of Item by Lot Serial Number (bar graph)
-
Average Cost of Item by Branch Plant (bar graph)
-
Summary of Average Cost by Month, Branch Plant, and Lot Serial Number (table)
-
Average Cost of Item by Branch and Lot Serial Number Details Table
The Average Cost of Item by Branch and Lot Serial Number Details table component contains drill back functionality as described in the following table:
| Functionality | Value |
|---|---|
| Table column containing drill back link | Item Number |
| Table columns passed to application | Item, Branch Plant |
| Application called | Item Ledger Inquiry (P4111) |
| Form called | W4111A |
| Version called | ZJDE0001 |
8.1.3.3 Average Cost Analysis by Month/GL Date
This report provides a broad view of the average cost of items over an identified GL date range.
This report contains the following components:
-
Average Cost of Item/Lot by Month (line graph)
-
Average Cost Percentage by Item for a Month (pie chart)
-
Summary of Average Cost by Month (table)
-
Summary of Average Cost by Month and Branch Plant (table)
-
Average Cost of Item by GL Date Details Table
The Average Cost of Item by GL Date Details table component contains drill back functionality as described in the following table:
| Functionality | Value |
|---|---|
| Table column containing drill back link | Item Number |
| Table columns passed to application | Item, Branch Plant |
| Application called | Item Ledger Inquiry (P4111) |
| Form called | W4111A |
| Version called | ZJDE0001 |
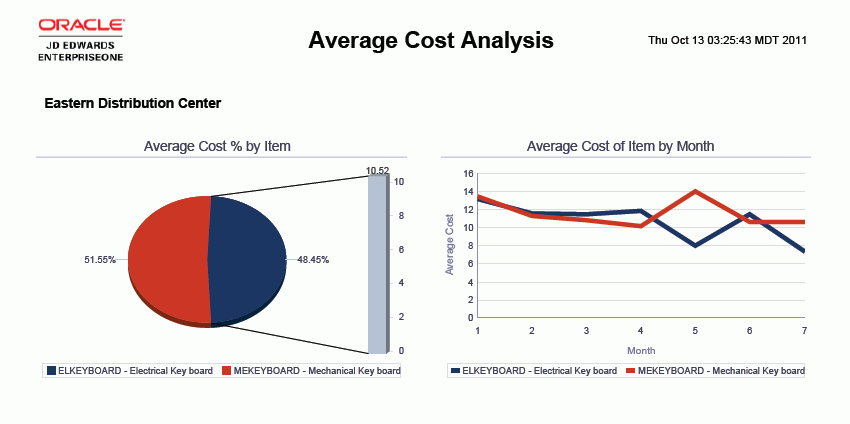
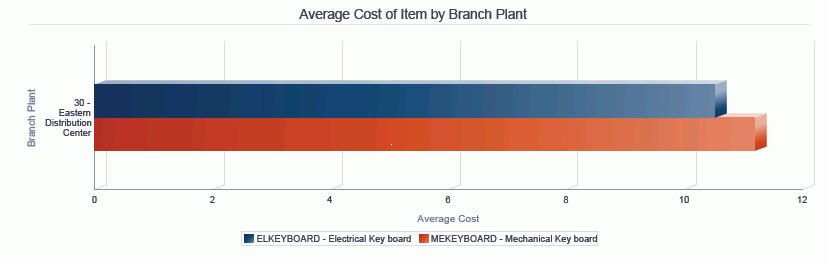
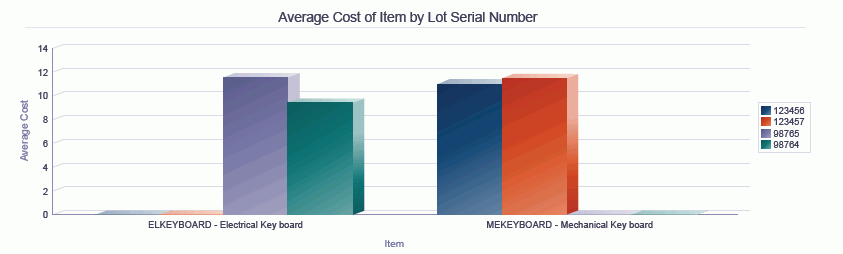
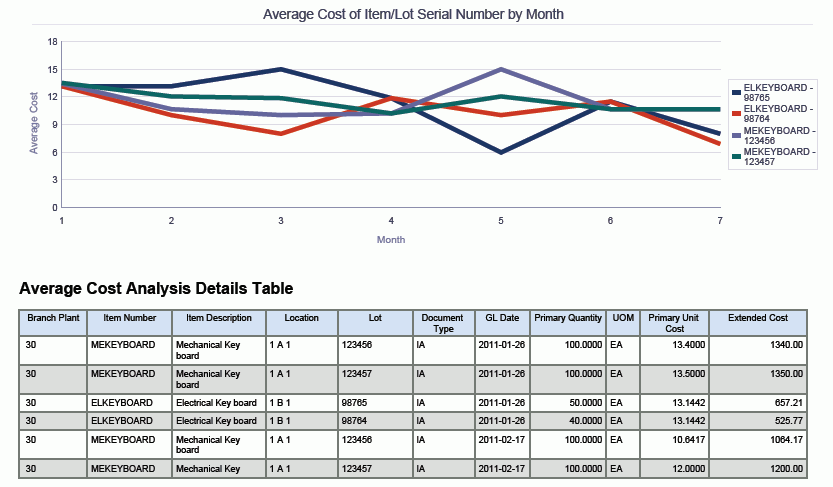
8.1.3.4 Average Cost Analysis
This report gives you complete control over the information shown on the gauges, graphs, charts and tables. The purpose of this report is to provide some key metrics from the other reports in one cumulative view to analyze the average cost of items within the same company.
This report contains the following components:
-
Average Cost Percentage by Item (pie chart)
-
Average Cost of Item by Month (line graph)
-
Average Cost of Item by Branch Plant (horizontal bar graph)
-
Average Cost of Item by Lot Serial Number (bar graph)
-
Average Cost of Item/Lot Serial Number by Month (line graph)
-
Average Cost Analysis Details (table)
When you run this report, you must have a document company specified in either the processing option or header of the One View Average Cost Analysis from Item Ledger Inquiry application.
8.2 One View Inventory Valuation Analysis Inquiry (P41271)
Access the One View Inventory Valuation Analysis Inquiry application (P41271) on the Inventory Inquiries (G41112) menu. Use One View Inventory Valuation Analysis Inquiry to view on hand, backordered, and future committed inventory values across one company. One View Inventory Valuation Analysis Inquiry uses the One View Inventory Valuation Analysis business view (V41271A), which includes columns from the Item Location table (F41021) and the F4101. This application also uses the cost from the Item Cost table (F4105) to calculate the inventory values ((for example, on hand, backordered, and future committed). One View Inventory Valuation Analysis Inquiry helps you to gain a better understanding of your inventory value levels throughout the supply chain.
8.2.1 Processing Options
Processing options enable you to specify the default processing for programs and reports.
8.2.1.1 Defaults
- 1. Branch Plant
-
Specify the Branch Plant that you want the system to use as the default value for filtering Item Location and Item Master tables.
8.2.1.2 Process
- 1. Costing Method - Sales/Inventory
-
Specify the hard-coded cost method that you want the system to use to calculate the inventory value and display it in the grid.
- 2. Costing Method - Sales/Inventory
-
Specify the hard-coded cost method that you want the system to use to calculate the inventory value and display it in the grid.
8.2.1.3 Versions
- 1. One View Average Cost Analysis from Item Ledger (P41270)
-
Specify the version of One View Average Cost Analysis from Item Ledger (P41270) that the system uses to access the Average Cost Analysis from Item Ledger application.
If you leave this processing option blank, the system uses version ZJDE0001.
- 2. One View Average Cost Analysis from Item As Of (P41272)
-
Specify the version of One View Average Cost Analysis from Item As Of (P41272) the system uses to access the Average Cost Analysis from Item As Of application.
If you leave this processing option blank, the system uses version ZJDE0001.
- 3. One View Item Usage Trace (P41273)
-
Specify the version of One View Item Usage Trace (P41273) the system uses to access the Item Usage Trace application.
If you leave this processing option blank, the system uses version ZJDE0001.
8.2.2 Special Processing
This section explains some functionality for the One View Inventory Valuation Analysis Inquiry application:
The system uses the default Sales/Inventory Cost method (CSIN value as I in F4105 table) for the item to calculate inventory values (for example, on hand, backordered, future committed) of the item. The inventory value is calculated by multiplying the quantity retrieved from the item location table with the cost. For example, for the item MEKEYBOARD the on hand quantity is 1000, and the default cost value is 5, which indicates that the on hand inventory value is 5000 (1000 * 5).
You can specify any two of the cost methods from the following nine hard coded cost methods in the processing options:
-
01 - Last In
-
02 - Weighted Average
-
03 - Memo
-
04 - Current
-
05 - Future
-
06 - Lot
-
07 - Standard
-
08 - Purchase- Base Cost No Adds
-
09 - Manufacturing Last Cost
The cost associated with the cost method specified in the processing options is retrieved from the Item Cost File (F4105). Inventory values are calculated by multiplying the cost with current inventory levels.
The cost method is restricted to two in the processing options because of performance reasons.
8.2.3 Reports
The reports delivered with the One View Inventory Valuation Analysis application are:
-
Inventory Valuation by Item
-
Inventory Valuation by Branch Plant
-
Inventory Valuation by Location
-
Inventory Valuation Analysis
8.2.3.1 Inventory Valuation by Item
This report provides a cross view of item inventory value levels. Having this information enables you to ensure that enough items are available to complete planning and shipping of goods quickly.
This report contains the following components:
-
On Hand and Back Ordered Inventory Value (bar graph)
-
Inventory Value Percentage of Highest Cost Item Across All Branch Plants (pie chart)
-
Summary of Inventory Value by Item (table)
-
Inventory Value by Item Details Table
The Inventory Value by Item Details table component contains drill back functionality as described in the following table:
| Functionality | Value |
|---|---|
| Table column containing drill back link | Branch Plant |
| Table columns passed to application | Item, Branch Plant |
| Application called | Item Availability (P41202) |
| Form called | W41202A |
| Version called | ZJDE0001 |
8.2.3.2 Inventory Valuation by Branch Plant
This report provides a cross view of item inventory value levels across branch plants. This information gives you an understanding of whether enough items are available to complete your planning and shipping of goods quickly.
This report contains the following components:
-
On Hand and Backordered Inventory Value (bar graph)
-
Inventory Value Percentage of Highest Cost Item for One Branch Plant (pie chart)
-
Summary of Inventory Value by Branch Plant (table)
-
Inventory Value of Item by Branch Plant Details Table
The Inventory Value of Item by Branch Plant Details table component contains drill back functionality as described in the following table:
| Functionality | Value |
|---|---|
| Table column containing drill back link | Item Number |
| Table columns passed to application | Item, Branch Plant |
| Application called | Item Availability (P41202) |
| Form called | W41202A |
| Version called | ZJDE0001 |
8.2.3.3 Inventory Valuation by Location
This report provides a cross view of item inventory value levels by location. This information gives you an understanding of whether enough items are available to complete your planning and shipping of goods quickly.
This report contains the following components:
-
On Hand and Backordered Inventory Value by Location (bar graph)
-
Inventory Value Percentage of Highest Cost Item in Primary Location (pie chart)
-
Summary of Inventory Value by Location (table)
-
Inventory Value of Item by Location Details Table
The Inventory Value of Item by Location Details table component contains drill back functionality as described in the following table:
| Functionality | Value |
|---|---|
| Table column containing drill back link | Item Number |
| Table columns passed to application | Item, Branch Plant |
| Application called | Item Availability (P41202) |
| Form called | W41202A |
| Version called | ZJDE0001 |
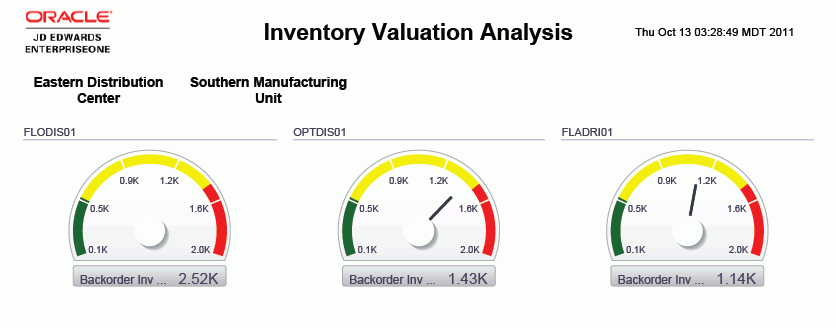
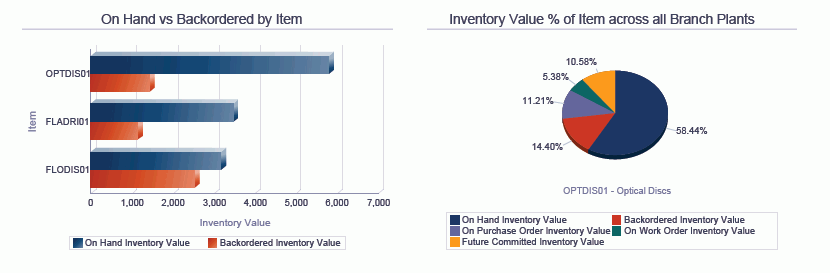
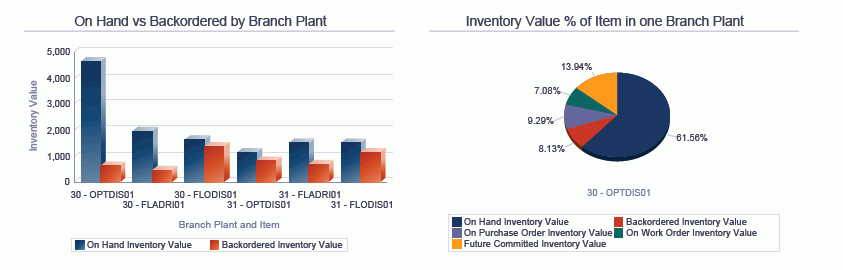
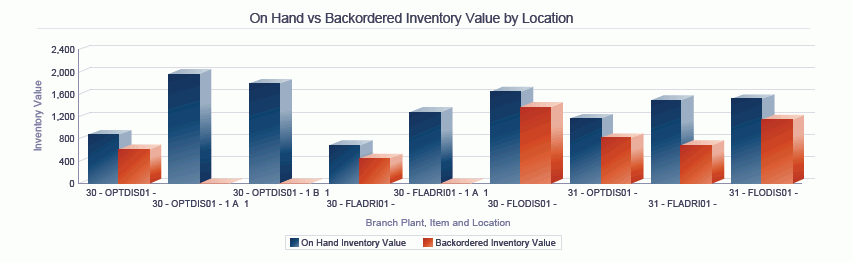
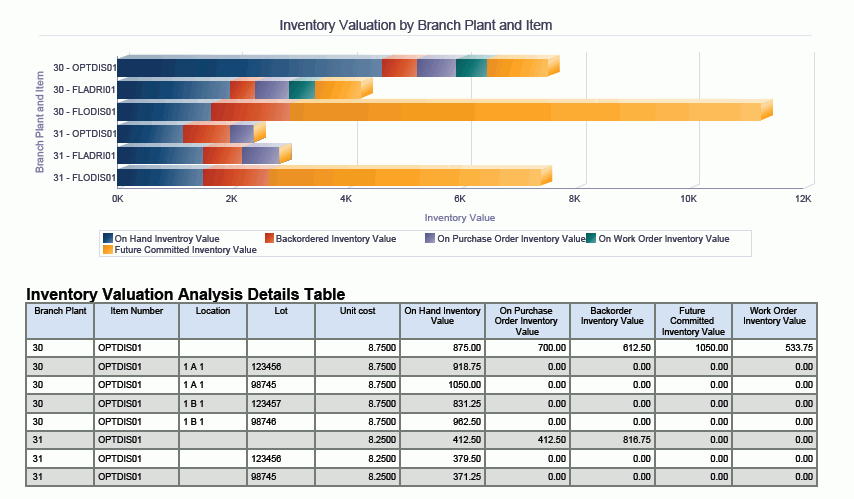
8.2.3.4 Inventory Valuation Analysis
This report gives you complete control over the information shown on the gauges, graphs, charts, and tables. The purpose of this report is to provide some key metrics from the other reports in one cumulative view to understand the inventory value levels within the same company.
This report contains the following components:
-
Backordered Inventory of Items by Branch/Plant (gauges)
-
On Hand vs. Backordered by Item (horizontal bar graph)
-
Inventory Value Percentage of Item across All Branch Plants (pie chart)
-
On Hand vs. Backordered by Branch Plant (bar graph)
-
Inventory Value Percentage of Item in One Branch Plant (pie chart)
-
On Hand vs. Backordered Inventory Value by Location (bar graph)
-
Inventory Valuation by Branch Plant and Item (horizontal bar graph)
-
Inventory Valuation Analysis Details (table)
The Inventory Valuation Analysis Details table component contains drill back functionality as described in the following table:
| Functionality | Value |
|---|---|
| Table column containing drill back link | Item Number |
| Table columns passed to application | Item, Branch Plant, Location |
| Application called | Item Ledger Inquiry (P4111) |
| Form called | W4111A |
| Version called | ZJDE0001 |
8.3 One View Inventory Cost Analysis By Item As Of Inquiry (P41272)
Access the One View Inventory Cost Analysis By Item As Of Inquiry application (P41272) on the Inventory Inquiries (G41112) menu. Use One View Inventory Cost Analysis By Item As Of Inquiry to view the average cost of items. One View Inventory Cost Analysis By Item As Of Inquiry uses the One View Actual Cost Analysis business view (V41272A), which includes columns from the Item ASOF File table (F41112) and the F4101. One View Inventory Average Cost Analysis by Item As Of Inquiry provides a broad view of the average cost of items across branch/plants, over a fiscal period, and by location and lot. This report enables you to analyze and compare if the average cost of items is acceptable across one company. This information is helpful to evaluate your cost analysis of items by pulling in the data from Item As of and Item Master tables.
8.3.1 Processing Options
Processing options enable you to specify the default processing for programs and reports.
8.3.1.1 Defaults
- 1. Branch Plant
-
Specify the Branch Plant that you want the system to use as the default value for filtering Item As Of and Item Master lines.
8.3.1.2 Versions
- 1. One View Average Cost Analysis from Item Ledger Inquiry (P41270)
-
Specify the version of One View Average Cost Analysis from Item Ledger Inquiry (P41270) that the system uses to access the Average Cost Analysis from Item Ledger application.
If you leave this processing option blank, the system uses version ZJDE0001.
- 2. One View Inventory Valuation Analysis Inquiry (P41271)
-
Specify the version of One View Inventory Valuation Analysis Inquiry (P41271) the system uses to access the Valuation Analysis application.
If you leave this processing option blank, the system uses version ZJDE0001.
- 3. One View Item Usage Trace Inquiry (P41273)
-
Specify the version of One View Item Usage Trace Inquiry (P41273) the system uses to access the Item Usage Trace application.
If you leave this processing option blank, the system uses version ZJDE0001.
8.3.2 Special Processing
The Year column in the grid translates the Fiscal Year column to display four numbers. For example, if the Fiscal year column is "9", the Year column is "2009".
The grid contains two total net posting and net quantities columns which summarize the 14 net posting column values and 14 net quantities column values. These two columns are used in the report.
8.3.3 Reports
The reports delivered with the One View Inventory Cost Analysis by Item As Of Inquiry application are:
-
Average As Of Cost by Item and Branch Plant
-
Average As Of Cost by Location and Lot
-
Average As Of Cost by Item and Fiscal Year
-
Average As Of Cost Analysis
8.3.3.1 Average As Of Cost by Item and Branch Plant
This report provides a view of the average as of cost of items across branch plants within the same company.
This report contains the following components:
-
Average As Of Cost by Item and Branch Plant (bar graph)
-
Average As Of Cost by Item and Fiscal Year (bar graph)
-
Summary of Average As Of Cost by Item and Branch Plant (table)
-
Average As Of Cost by Item and Branch Plant Details (table)
The Average As Of Cost by Item and Branch Plant Details table component contains drill back functionality as described in the following table:
| Functionality | Value |
|---|---|
| Table column containing drill back link | Item Number |
| Table columns passed to application | Item, Branch Plant |
| Application called | Item Ledger - Running Balance (P41112) |
| Form called | W41112A |
| Version called | ZJDE0001 |
8.3.3.2 Average As Of Cost by Location and Lot
This report provides a view of the average cost of items across locations and lots within the same company. It also gives you the ability to view fluctuations in the average cost across branch/plants and over a span of several months.
This report contains the following components:
-
Average As Of Cost by Item and Location (bar graph)
-
Average As Of Cost by Item and Lot (bar graph)
-
Summary of Average As Of Cost - By Location and Lot (table)
-
Average As Of Cost by Location and Lot Details (table)
The Average As Of Cost by Location and Lot Details table component contains drill back functionality as described in the following table:
| Functionality | Value |
|---|---|
| Table column containing drill back link | Item Number |
| Table columns passed to application | Item, Branch Plant, Lot |
| Application called | Item Ledger - Running Balance (P41112) |
| Form called | W41112A |
| Version called | ZJDE0001 |
8.3.3.3 Average As Of Cost by Item and Fiscal Year
This report provides a view of the average as of cost of items by Item and Fiscal Year. It also gives you the ability to view fluctuations in the average cost across branch/plants and over a span of several months.
This report contains the following components:
-
Average As Of Cost by Item and Fiscal Year (bar graph)
-
Average As Of Cost Disposition Percentage by Fiscal Year (pie chart)
-
Summary of Average As Of Cost by Item and Fiscal Year (table)
-
Average As Of Cost by Item and Fiscal Year Details (table)
The Average As Of Cost by Item and Fiscal Year Details table component contains drill back functionality as described in the following table:
| Functionality | Value |
|---|---|
| Table column containing drill back link | Item Number |
| Table columns passed to application | Item, Branch Plant |
| Application called | Item Ledger - Running Balance (P41112) |
| Form called | W41112A |
| Version called | ZJDE0001 |
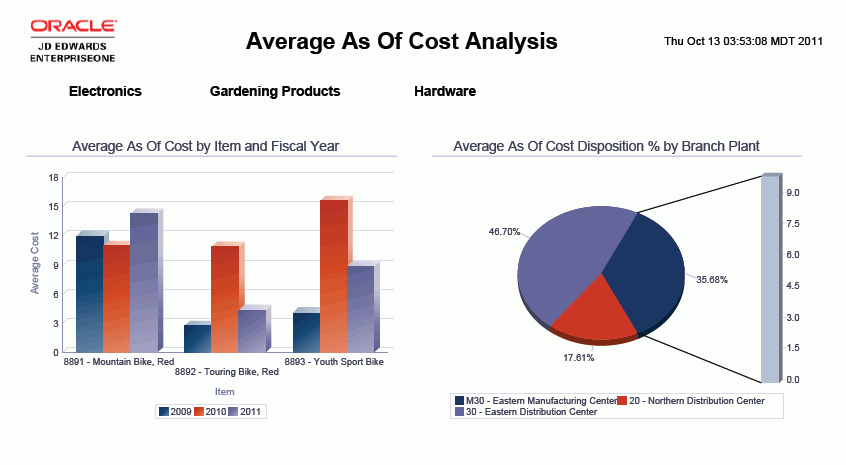
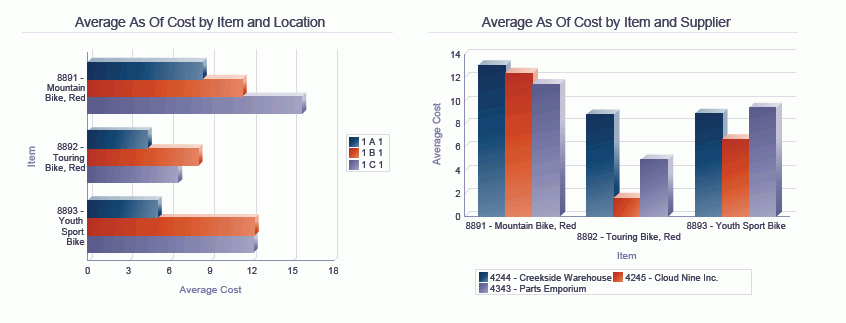
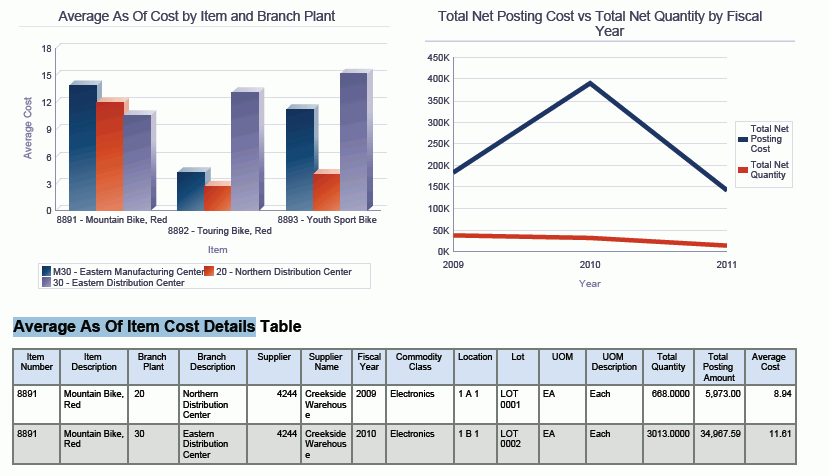
8.3.3.4 Average As Of Cost Analysis
This report gives you complete control over the information shown on the gauges, graphs, charts, and tables. The purpose of this report is to provide some key metrics from the other reports in one cumulative view to analyze the average as of cost of items through multiple views of data within the same company.
This report contains the following components:
-
Average As Of Cost by Item and Fiscal Year (bar graph)
-
Average As Of Cost Disposition Percentage by Branch Plant (pie chart)
-
Average As Of Cost by Item and Location (horizontal bar graph)
-
Average As Of Cost by Item and Supplier (bar graph)
-
Average As Of Cost by Item and Branch Plant (bar graph)
-
Total Net Posting Cost vs. Total Net Quantity by Fiscal Year (line graph)
-
Average As Of Item Cost Details (table)
The Average As Of Item Cost Details table component contains drill back functionality as described in the following table:
| Functionality | Value |
|---|---|
| Table column containing drill back link | Item Number |
| Table columns passed to application | Item, Branch Plant |
| Application called | Item Ledger Inquiry (P4111) |
| Form called | W4111A |
| Version called | ZJDE0001 |
8.4 One View Item Usage Trace Inquiry (P41273)
Access the One View Item Usage Trace Inquiry application (P41273) on the Inventory Inquiries (G41112) menu. Use One View Item Usage Trace Inquiry to gain insight into the movement of your inventory items. One View Item Usage Trace Inquiry uses the One View Item Usage Trace (F41021/F4101) business view (V41273A), which includes columns from the F41021 and F4101. This application provides the ability to create and run reports that illustrate the movement of inbound and outbound items, backordered quantities, and the respective percentage of goods moved. This can be capture over a period (for example, using the transaction date, weekly, or monthly) across branch/plant. This information is helpful to identify the trending analysis and evaluation of the movement of goods by pulling in the data from the item ledger and item location files.
8.4.1 Processing Options
Processing options enable you to specify the default processing for programs and reports.
8.4.1.1 Defaults
- 1. Document Type
-
Specify the document type that you want the system to use as the default value for filtering Item Ledger lines.
- 2. Document Company
-
Specify the document company that you want the system to use as the default value for filtering Item Ledger and Item Location lines.
- 3. Branch Plant
-
Specify the Branch Plant that you want the system to use as the default value for filtering Item Ledger and Item Location lines.
8.4.1.2 Versions
- 1. One View Average Cost Analysis from Item Ledger (P41270)
-
Specify the version of One View Average Cost Analysis from Item Ledger (P41270) that the system uses to access the Average Cost Analysis from Item Ledger application.
If you leave this processing option blank, the system uses version ZJDE0001.
- 2. One View Inventory Valuation Analysis (P41271)
-
Specify the version of One View Inventory Valuation Analysis (P41271) the system uses to access the Inventory Valuation Analysis application.
If you leave this processing option blank, the system uses version ZJDE0001.
- 3. One View Average Cost Analysis from Item As Of (P41272)
-
Specify the version of One View Average Cost Analysis from Item As Of (P41272) the system uses to access the Average Cost Analysis from Item As Of application.
If you leave this processing option blank, the system uses version ZJDE0001.
8.4.2 Special Processing
The quantity in the transaction UOM is converted to primary UOM based on the conversion factor specified in the item UOM conversion table or standard UOM conversion table. The system uses the flag Standard Unit of measure conversion (IFLA) to retrieve the conversion. The quantity in primary UOM appears in the Primary Quantity field. When an item with dual unit of measure is processed, the quantity in the secondary transaction UOM is converted to the secondary UOM of the item. The quantity in secondary UOM appears in the Primary Quantity Secondary field.
The month corresponding to the transaction date appears in the Trans month field. For example, if the transaction date is 01/15/2011, then the Trans month column contains "1."
The following quantities are shown only once per Item, Branch Plant, Location and Lot combination:
-
Quantity backordered
-
Quantity on hand
-
Quantity hard committed to work order
-
Primary quantity on project hard commit
-
Secondary quantity on project hard Commit
-
Quantity on loan to manufacturing
-
Quantity soft committed
-
Quantity hard committed
-
Quantity in inspection
-
Quantity in operation 1
-
Quantity in operation 2
-
Quantity in transit
-
Quantity inbound
-
Quantity on future
-
Quantity on other 1
-
Quantity on other 2
-
Quantity on other purchase order
-
Quantity on purchase order
-
Quantity on WO/RC
-
Quantity outbound
-
Secondary quantity hard committed
-
Secondary quantity inbound
-
Secondary quantity on hand
-
Secondary quantity on purchase order
-
Secondary quantity on WO/RC
-
Secondary quantity outbound
-
Secondary quantity soft committed
-
Secondary work order hard committed
-
Secondary work order soft commit
This is necessary to ensure that the system can use the columns to display proper data in the reports.
8.4.3 Reports
The reports delivered with the One View Item Usage Trace Inquiry application are:
-
Item Usage Trace by Item Branch
-
Item Usage Trace by Item and Date
-
Item Usage Trace by Week
-
Item Usage Trace Analysis
8.4.3.1 Item Usage Trace by Item Branch
This report provides a view of the inbound/outbound movement of items across branch/plants. It also gives you the ability to compare and contrast these inventory item movements across branch/plants. On Hand and Backordered Inventory is based on Item, Branch/Plant, Location and Lot combination.
This report contains the following components:
-
Inventory Movement by Branch Plant (bar graph)
-
Inventory Movement by Month (line graph)
-
Summary of Inventory Movement - by Branch Plant (table)
-
Summary of Inventory Movement - by Month and Branch Plant (table)
-
Item Usage Trace by Branch Plant and Item Details (table)
The Item Usage Trace by Branch Plant and Item Details table component contains drill back functionality as described in the following table:
| Functionality | Value |
|---|---|
| Table column containing drill back link | Item Number |
| Table columns passed to application | Item, Branch Plant |
| Application called | Item Ledger Inquiry (P4111) |
| Form called | W4111A |
| Version called | ZJDE0001 |
8.4.3.2 Item Usage Trace by Item and Date
This report provides a view of the inbound/outbound movement of items. It also gives you the ability to compare and contrast these inventory item movements by month and transaction date. On Hand and Backordered Inventory is based on Item, Branch/Plant, Location and Lot combination.
This report contains the following components:
-
Inventory Movement by Item (bar graph)
-
Inventory Movement by Month (line graph)
-
Summary of Inventory Movement - by Item (table)
-
Summary of Inventory Movement - by Month and Item (table)
-
Item Usage Trace by Transaction Date Details (table)
The Item Usage Trace by Transaction Date Details table component contains drill back functionality as described in the following table:
| Functionality | Value |
|---|---|
| Table column containing drill back link | Item Number |
| Table columns passed to application | Item, Branch Plant |
| Application called | Item Ledger Inquiry (P4111) |
| Form called | W4111A |
| Version called | ZJDE0001 |
8.4.3.3 Item Usage Trace by Week
This report provides a view of the inbound/outbound movement of items across a range of days or weeks. It also gives you the ability to compare and contrast these inventory item movements across branch/plants and transaction days. On Hand and Backordered Inventory is based on Item, Branch/Plant, Location and Lot combination.
This report contains the following components:
-
Inventory Movement by Item (bar graph)
-
Inventory Movement of Item by Branch Plant (line graph)
-
Summary of Inventory Movement - by Date and Item (table)
-
Summary of Inventory Movement - by Date and Branch Plant (table)
-
Item Usage Trace by Transaction Date Details (table)
The Item Usage Trace by Transaction Date Details table component contains drill back functionality as described in the following table:
| Functionality | Value |
|---|---|
| Table column containing drill back link | Item Number |
| Table columns passed to application | Item, Branch Plant |
| Application called | Item Ledger Inquiry (P4111) |
| Form called | W4111A |
| Version called | ZJDE0001 |
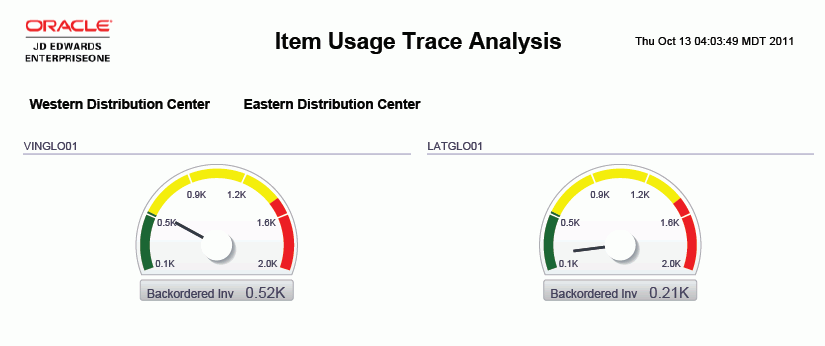
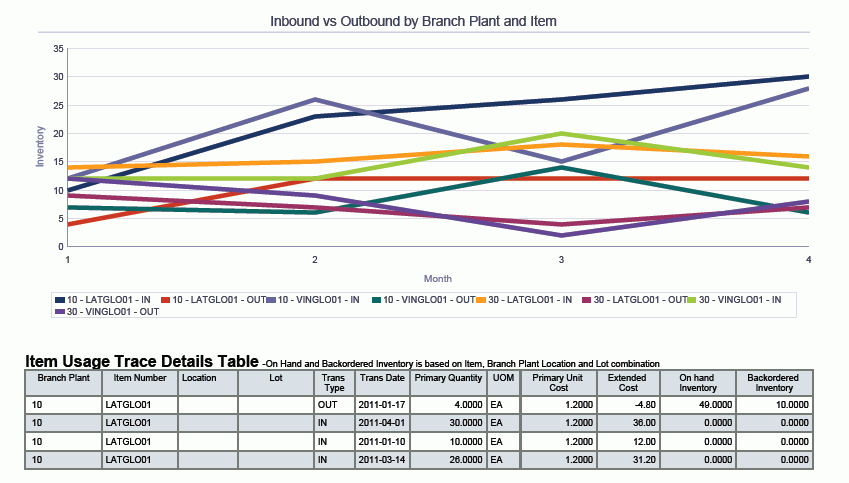
8.4.3.4 Item Usage Trace Analysis
This report gives you complete control over the information shown on the gauges, graphs, charts, and tables. The purpose of this report is to provide some key metrics from the other reports in one cumulative view to help analyze inventory movement over a span of time. On Hand and Backordered Inventory is based on Item, Branch/Plant, Location and Lot combination.
This report contains the following components:
-
Backordered Inventory (gauges)
-
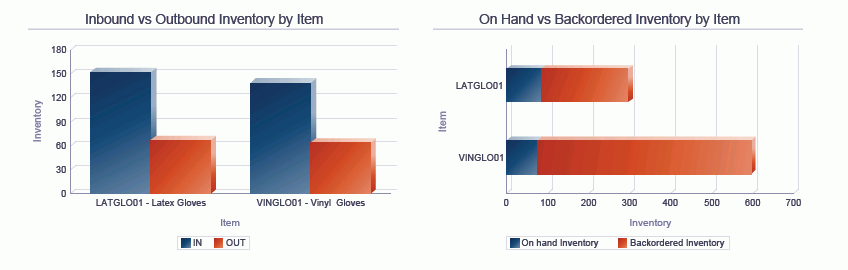
Inbound vs. Outbound Inventory by Item (bar graph)
-
On Hand vs. Backordered by Item (horizontal bar graph)
-
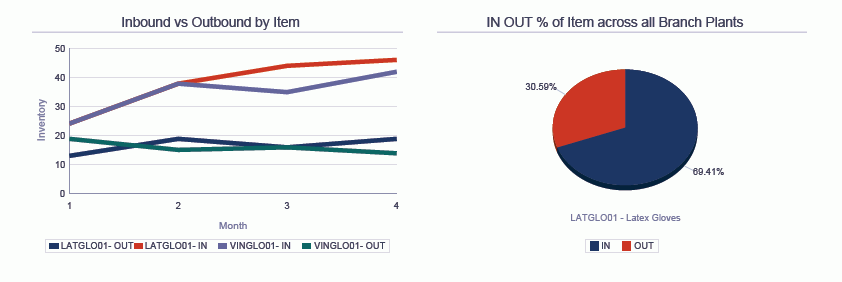
Inbound vs. Outbound by Item (line graph)
-
IN OUT Percentage of Item across all Branch Plants (pie chart)
-
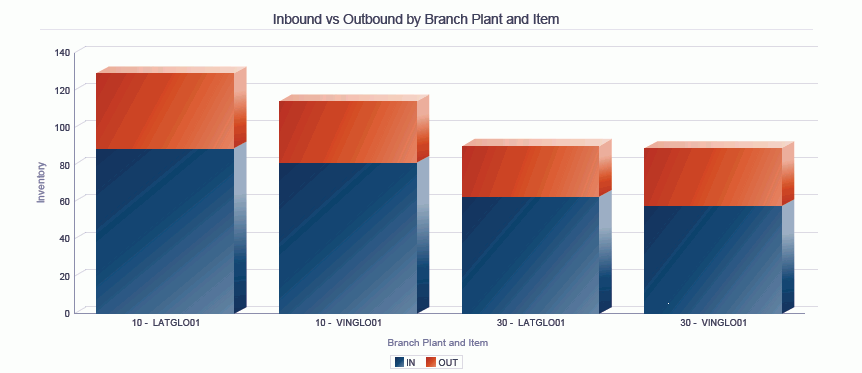
Inbound vs. Outbound by Branch Plant and Item (bar graph)
-
Inbound vs. Outbound by Branch Plant and Item (line graph)
-
Item Usage Trace Details (table)
The Item Usage Trace Details table component contains drill back functionality as described in the following table:
| Functionality | Value |
|---|---|
| Table column containing drill back link | Item Number |
| Table columns passed to application | Item, Branch Plant |
| Application called | Item Ledger Inquiry (P4111) |
| Form called | W4111A |
| Version called | ZJDE0001 |