17 One View Reporting for Transportation Management (Release 9.1 Update)
This chapter provides overview information, processing options, special process, and reports for the following applications:
-
Section 17.1, "One View Transportation Shipment Inquiry (P49270)"
-
Section 17.2, "One View Transportation Load Inquiry (P49271)"
17.1 One View Transportation Shipment Inquiry (P49270)
Access the One View Transportation Shipment Inquiry application (P49270) on the Transportation Inquiries menu (G4914). Use One View Transportation Shipment Inquiry to query shipment numbers and create transportation shipment inquiry reports including related data from the Shipment Header (F4215) and Shipment Routing Steps (F4941) tables. One View Transportation Shipment Inquiry uses the One View Transportation Shipment Analysis Inquiry business view (V49270A), which include columns from the Shipment Header table and the Shipment Routing Steps table.
This application provides the ability to create and run reports on current shipments including freight charges and shipment depot information, such as: on time shipments by shipment depot, shipment depot totals by year and month, shipment freight charges by shipment depot, and shipment value by shipment depot.
17.1.1 Processing Options
Processing options enable you to specify the default processing for programs and reports.
17.1.1.1 Default
- 1. Shipment Depot
-
Specify the shipment depot the system uses as the default value for filtering shipments.
- 2. Ship To
-
Specify the ship to address the system uses as the default value for filtering shipments.
- 3. Carrier Number
-
Specify the shipment carrier the system uses as the default value for filtering shipments.
- 4. Mode Of Transport
-
Specify the shipment mode of transport the system uses as the default value for filtering shipments.
17.1.1.2 Process
- 1. As If Weight UOM (unit of measure)
-
Specify the weight unit of measure the system uses to convert the weight of the shipment.
- 2. As If Volume UOM (unit of measure)
-
Specify the volume unit of measure the system uses to convert the volume of the shipment.
- 3. As If Distance UOM (unit of measure)
-
Specify the distance unit of measure the system uses to convert the distance of the shipment.
- 4. As If Currency Code
-
Specify the currency code the system uses to calculate currency amounts.
- 5. Approved Shipment Status
-
Specify the shipment status that indicates that the shipment has been approved.
- 6. Confirmed Shipment Status
-
Specify the shipment status that indicates that the shipment has been confirmed.
17.1.2 Special Processing
One View Transportation Shipment Inquiry converts the weight, volume, and distance to the unit of measure (UOM) specified in the header of the application. You can use processing options to specify the default UOM values in the header fields for weight, volume, and distance. You can also change UOMs during run time and view the weight, volume, and distance in the revised UOM.
The system converts all the currency amounts on the application to the currency specified in the header of the application. You can use processing options to specify default values for the header.
At the routing step level, the system calculates the weight, volume, distance, cost, and price. At the shipment level, the system calculates the weight, volume, cost, and price.
17.1.3 Reports
The reports delivered with the One View Transportation Shipment Inquiry application are:
-
On Time Shipments by Shipment Depot
-
Shipment Depot Totals by Year and Month
-
Shipment Freight Charges by Shipment Depot
-
Shipment Value by Shipment Depot
-
Shipment Analysis
17.1.3.1 On Time Shipments by Shipment Depot Report
The On Time Shipments by Shipment Depot report enables you to view on time shipment information using shipment depot as a filter. The Number of On Time Shipments by Shipment Depot bar graph enables you to compare the number of on time shipments for selected shipment depots. The on time shipments are categorized by promised ship date, delivery date, and requested date. The Top 10 Carriers by On Time Delivery bar graph enables you to compare the top 10 carriers with the greatest number of on time shipments. The Freight Value for Outbound Past Due Shipments by Shipment Depot bar-line combination graph enables you to compare the freight value amount to the number of past due shipments for selected shipment depots. The Freight Value for Late Shipments by Shipment Depot bar-line combination graph enables you to plot the total freight value in relationship to number of late shipments and total number of shipments. The Summary of On Time Shipments by Shipment Depot table displays a historical summary of shipment depot, carrier, and date information used in the charts. The On Time Shipment Details Table displays all the historical freight charges and date detail records that were used to create the charts for the selected shipment depots.
This report contains the following components:
-
Number of On Time Shipments by Shipment Depot (bar graph)
-
Top 10 Carriers by On Time Delivery (bar graph)
-
Freight Value for Outbound Past Due Shipments by Shipment Depot (bar-line combination graph)
-
Freight Value for Late Shipments by Shipment Depot (bar-line combination graph)
-
Summary of On Time Shipments by Shipment (table)
-
On Time Shipment Details Table
The On Time Shipment Details table component contains drill back functionality as described in the following table:
| Functionality | Value |
|---|---|
| Table column containing drill back link | Shipment Depot |
| Table columns passed to application | Shipment Depot |
| Application called | Work with Shipments (P4915) |
| Form called | W4915B |
| Version called | ZJDE0001 |
17.1.3.2 Shipment Depot Totals by Year and Month Report
The Shipment Depot Totals by Year and Month report enables you to view annual and monthly shipment information using shipment depot as a filter. The Total Weight Shipped by Shipment Depot bar graph enables you to compare the monthly tonnage shipped over a specified year for selected shipment depots. The Total Volume Shipped by Shipment Depot bar graph enables you to compare the monthly volume shipped over a specified year for selected shipment depots. The Number of Shipments and Total Weight line graph enables you to compare the total shipment weight to the number of shipments for the same time period for the selected shipment depot. The Total Price, Cost, and Number of Shipments line graph enables you to compare the total price, cost, and number of shipments for the same time period for the selected shipment depot. The Total Cost and Weight by Shipment Depot bubble chart enables you to plot the total shipped tonnage in relationship to total cost and number of shipments. The Freight Charges per Weight and Volume by Shipment Depot bar graph enables you to compare the billable and payable freight charges based on weight and volume for selected shipment depots. The Summary of Shipment Weight and Volume by Shipment Depot table displays a historical summary of weight, volume, shipment depot and carrier information used in the charts. The Shipment Depot Totals Weight and Volume Analysis Details Table displays all the historical weight and volume detail records that were used to create the charts for the selected shipment depots.
This report contains the following components:
-
Total Weight Shipped by Shipment Depot (bar graph)
-
Total Volume Shipped by Shipment Depot (bar graph)
-
Number of Shipments and Total Weight (line graph)
-
Total Price, Cost, and Number of Shipments (line graph)
-
Total Cost and Weight by Shipment Depot (bubble chart)
-
Freight Charges per Weight and Volume by Shipment Depot (bar graph)
-
Summary of Shipment Weight and volume by Shipment Depot (table)
-
Shipment Depot Totals Weight and Volume Analysis Details Table
The Shipment Depot Totals Weight and Volume Analysis Details table component contains drill back functionality as described in the following table:
| Functionality | Value |
|---|---|
| Table column containing drill back link | Shipment Depot |
| Table columns passed to application | Shipment Depot |
| Application called | Work with Shipments (P4915) |
| Form called | W4915B |
| Version called | ZJDE0001 |
17.1.3.3 Shipment Freight Charges by Shipment Depot Report
The Shipment Freight Charges by Shipment Depot report enables you to view operating ratio and freight charges information using shipment depot as a filter. The Total and Average Billable Freight by Shipment Depot bar-line combination graph enables you to compare the total billable freight charges to average billable freight charges for selected shipment depots. The Total and Average Payable Freight by Shipment Depot bar-line combination graph enables you to compare the total payable freight charges to the average payable freight charges for selected shipment depots. The Freight Net Revenue by Shipment Depot line graph enables you to compare freight net revenue by shipment depots. The Operating Ratio by Shipment Depot bar graph enables you to compare operating ratios for selected shipment depots. The Total Freight Charges and Net Revenue by Shipment Depot bar-line combination graph enables you to compare the relationship of net revenue derived from billable and payable freight charges for selected shipment depots. The Total Freight Charges and Operating Ratio by Shipment Depot bubble chart enables you to plot the operating ratio in relationship to billable and payable freight charges for selected shipment depots. The Summary of Payable Freight by Shipment Depot and Carrier table displays a historical summary of payable freight charges, shipment depot, and carrier information used in the charts. The Summary of Billable Freight by Shipment Depot and Ship table displays a historical summary of billable freight charges, shipment depot, and ship to information used in the charts. The Shipment Freight Charges Details Table displays all the historical billable and payable freight charges detail records that were used to create the charts for the selected planning depots.
This report contains the following components:
-
Total and Average Billable Freight by Shipment Depot (bar-line combination graph)
-
Total and Average Payable Freight by Shipment Depot (bar-line combination graph)
-
Freight Net Revenue by Shipment Depot (line graph)
-
Operating Ratio by Shipment Depot (bar graph)
-
Total Freight Charges and Net Revenue by Shipment Depot (bar-line combination graph)
-
Total Freight Charges and Operating Ratio by Shipment Depot (bubble chart)
-
Summary of Payable Freight by Shipment Depot and Carrier (table)
-
Summary of Billable Freight by Shipment Depot and Ship To (table)
-
Shipment Freight Charges Details Table
The Shipment Freight Charges Details table component contains drill back functionality as described in the following table:
| Functionality | Value |
|---|---|
| Table column containing drill back link | Shipment Depot |
| Table columns passed to application | Shipment Depot |
| Application called | Work with Shipments (P4915) |
| Form called | W4915B |
| Version called | ZJDE0001 |
17.1.3.4 Shipment Value by Shipment Depot Report
The Shipment Value by Shipment Depot report enables you to view freight value and cost information using shipment depot as a filter. The Inbound Freight Value by Shipment Depot bar graph enables you to compare the inbound freight value of selected shipment depots. The Inbound Freight Cost as a Percentage of Purchase by Shipment Depot bar graph enables you to compare inbound freight costs as a percentage of purchase for selected shipment depots. The Purchase Cost and Inbound Freight Charge by Shipment Depot bar graph enables you to compare purchase cost to inbound freight charges for selected shipment depots. The Outbound Freight Value by Shipment Depot bar graph enables you to compare the outbound freight value for selected shipment depots. The Outbound Freight Cost as a Percentage of Sales by Shipment Depot bar graph enables you to compare the outbound freight cost as a percentage of sales for selected shipment depots. The Sales Revenue and Outbound Freight Charge by Shipment Depot bar graph enables you to compare sales revenue to outbound freight charges for selected shipment depots. The Outbound Freight Revenue as a Percentage of Sales bar graph enables you to compare the outbound freight revenue percentage of sales for selected shipment depots. The Summary of Inbound Freight Value by Shipment Depot table displays a historical summary of payable freight charges and freight value information used in the charts. The Summary of Outbound Freight Value by Shipment Depot table displays a historical summary of billable freight charges and freight value information used in the charts. The Shipment Depot Inbound and Outbound Value Analysis Details Table displays all the historical billable and payable freight charges, freight value, carrier, and ship to detail records used to create the charts for selected shipment depots.
This report contains the following components:
-
Inbound Freight Value by Shipment Depot (bar graph)
-
Inbound Freight Cost as a Percentage of Purchase by Shipment Depot (bar graph)
-
Purchase Cost and Inbound Freight Charge by Shipment Depot (bar graph)
-
Outbound Freight Value by Shipment Depot (bar graph)
-
Outbound Freight Cost as a Percentage of Sales by Shipment Depot (bar graph)
-
Sales Revenue and Outbound Freight Charge by Shipment Depot (bar graph)
-
Outbound Freight Revenue as a Percentage of Sales (bar graph)
-
Summary of Inbound Freight Value by Shipment Depot (table)
-
Summary of Outbound Freight Revenue by Shipment Depot (table)
-
Shipment Depot Inbound and Outbound Value Analysis Details Table
The Shipment Depot Inbound and Outbound Value Analysis Details table component contains drill back functionality as described in the following table:
| Functionality | Value |
|---|---|
| Table column containing drill back link | Shipment Depot |
| Table columns passed to application | Shipment Depot |
| Application called | Work with Shipments (P4915) |
| Form called | W4915B |
| Version called | ZJDE0001 |
17.1.3.5 Shipment Analysis Report
The Shipment Analysis report enables you to view shipment information using shipment depot as a filter. The Past Due Shipments gauges display the three shipment depots with the most past due shipments. The Total Weight by Carrier bar chart enables you to compare the amount of tonnage that each carrier has shipped for the selected shipment depot. The Total Volume by Carrier bar chart enables you to compare the amount of cubic volume that each carrier has shipped for the selected shipment depot. The Total Weight, Volume and Number of Shipments by Top 10 Carriers bubble chart enables you to plot the top ten carriers in relationship to the total number of shipments, weight, and volume for the selected shipment depot. The Freight Value for Outbound Past Due Shipments by Shipment Depot bar chart enables you to compare the value of the total number of shipments from each shipment depot that were shipped late. The Total Weight Shipped by Mode of Transport pie chart enables you to view the distribution of the shipment depot's total amount of shipped weight based upon mode of transport. The Total Volume Shipped by Mode of Transport pie chart enables you to view the distribution of the shipment depot's total amount of shipped volume based upon mode of transport. The Freight Charges per Weight and Volume by Top 5 Carriers bar chart displays information for the top 5 carriers based upon payable freight charges derived from the specified unit of measure for weight, volume, and currency. The Freight Charges per Weight and Volume by Shipment Depot bar chart displays the amount of billable and payable freight charges categorized by weight and volume for each selected shipment depot. The Shipment Weight, Volume, and Freight Charge Analysis Detail Table displays the shipment detail lines that were included in the selected shipment depot.
This report contains the following components:
-
Past Due Shipments (gauges)
-
Total Weight by Carrier (bar graph)
-
Total Volume by Carrier (bar graph)
-
Total Weight, Volume and Number of Shipments by Top 10 Carriers (bubble chart)
-
Freight Value for Outbound Past Due Shipments by Shipment Depot (bar-line combination graph)
-
Total Weight Shipped by Mode of Transport (pie chart)
-
Total Volume Shipped by Mode of Transport (pie chart)
-
Payable Freight per Weight and Volume by Top 5 Carriers (bar graph)
-
Freight Charges per Weight and Volume by Shipment Depot (bar graph)
-
Shipment Weight, Volume and Freight Charge Analysis Details Table
The Shipment Weight, Volume and Freight Charge Analysis Details table component contains drill back functionality as described in the following table:
| Functionality | Value |
|---|---|
| Table column containing drill back link | Shipment Depot |
| Table columns passed to application | Shipment Number |
| Application called | Work with Shipments (P4915) |
| Form called | W4915B |
| Version called | ZJDE0001 |
Figure 17-1 Shipment Analysis Report
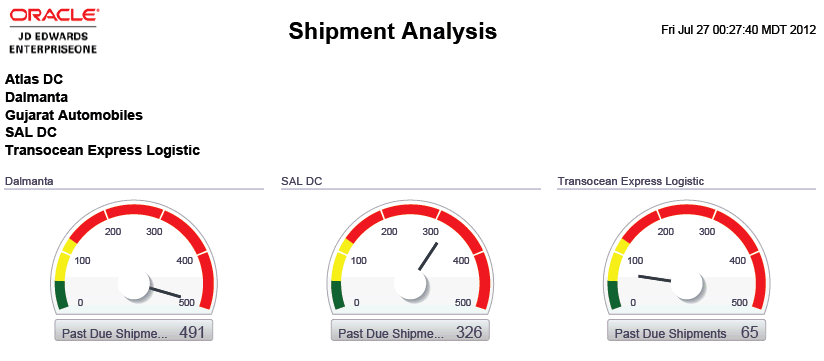
Description of ''Figure 17-1 Shipment Analysis Report''
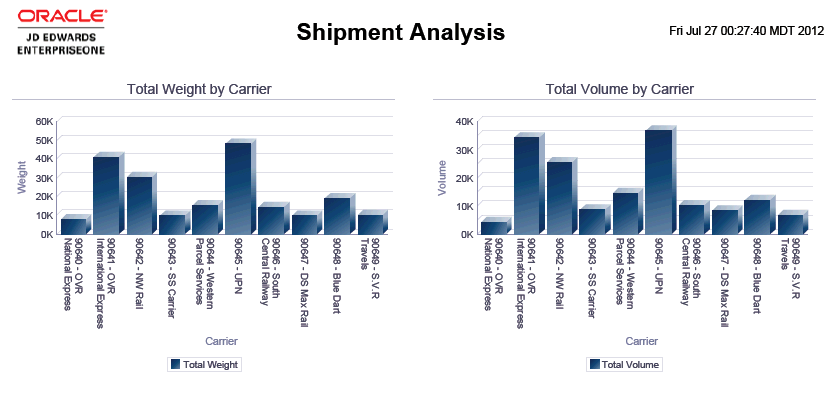
Description of ''Figure 17-1 Shipment Analysis Report''
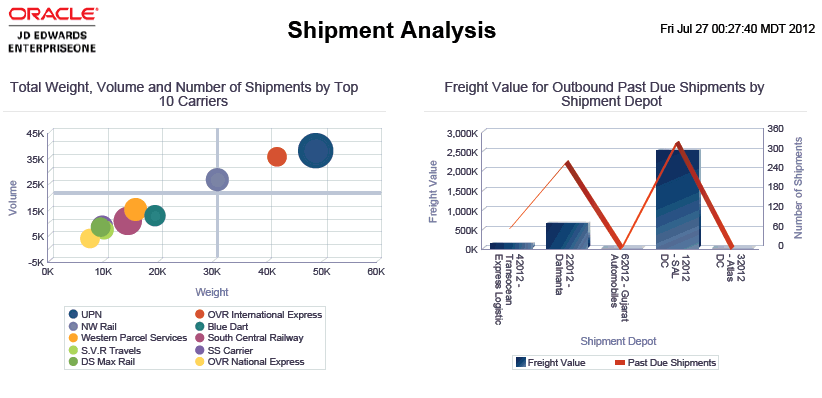
Description of ''Figure 17-1 Shipment Analysis Report''
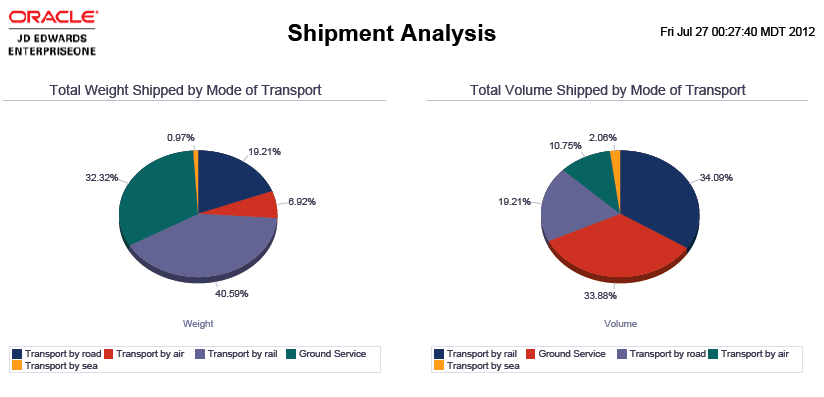
Description of ''Figure 17-1 Shipment Analysis Report''
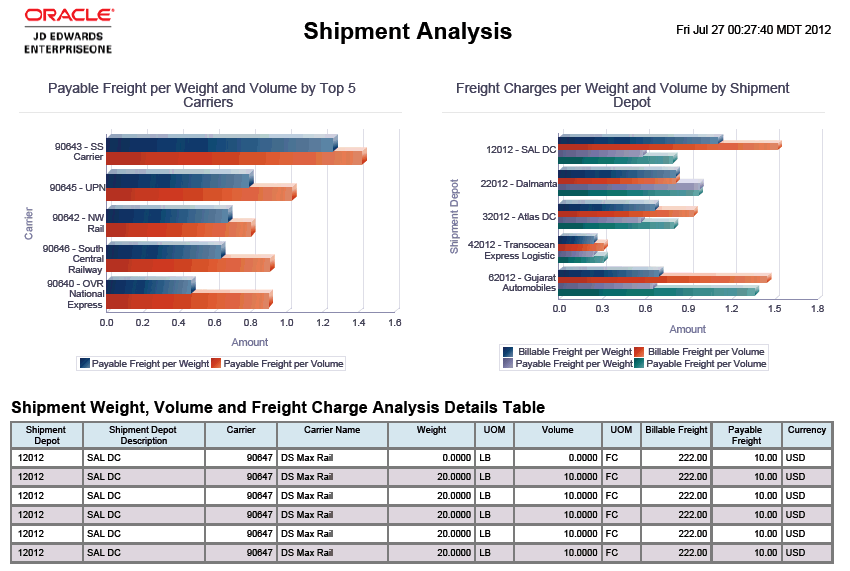
Description of ''Figure 17-1 Shipment Analysis Report''
17.2 One View Transportation Load Inquiry (P49271)
Access the One View Transportation Load Inquiry application (P49271) on the Transportation Inquiries menu (G4914). Use the One View Transportation Load Inquiry to query load numbers and create transportation load inquiry reports including related data from the Shipment Routing (F4941), Load Header (F4960), Load Legs (F4961), Vehicle Compartments (F49301), and Load Stop Sequence (F49611) tables. One View Transportation Load Inquiry uses the One View Transportation Load Inquiry business view (V49271A), which includes columns from the Load Header table, Load Legs table, and the Load Stop Sequence table. The system also fetches information from the Shipment Routing Steps table (F4941) and the Vehicle Compartments table (F49301) to calculate freight charges and vehicle utilization respectively.
This application provides the ability to create and run reports on current loads including freight charges, vehicle utilization and shipment depot information, such as: load distance by shipment depot and carrier, load bulk volume by shipment depot and date, load freight by planning depot, load payable freight by carrier and planning depot, and vehicle utilization by planning depot.
17.2.1 Processing Options
Processing options enable you to specify the default processing for program and reports.
17.2.1.1 Default
- 1. Planning Depot
-
Specify the planning depot that the system uses as the default value for filtering load detail lines.
- 2. Shipment Depot
-
Specify the shipment depot that the system uses as the default value for filtering load detail lines.
- 3. Carrier Number
-
Specify the carrier number that the system uses as the default value for filtering load detail lines.
- 4. Mode of Transport
-
Specify the mode of transport the system uses as the default value for filtering load detail lines.
17.2.1.2 Process
- 1. As If Weight UOM (unit of measure)
-
Specify the weight unit of measure the system uses to convert the weight of the load.
- 2. As If Volume UOM (unit of measure)
-
Specify the volume unit of measure the system uses to convert the volume of the load.
- 3. As If Cubic Volume UOM (unit of measure)
-
Specify the cubic volume unit of measure the system uses to convert the cubic volume of a load.
- 4. As If Distance UOM (unit of measure)
-
Specify the distance unit of measure the system uses to convert the trip distance.
- 4. As If Currency
-
Specify the currency code that the system uses to calculate currency amounts.
- 6. Approved Load Status
-
Enter a load status to indicate that the load is approved.
- 7. Confirmed Load Status
-
Enter a load status to indicate that the load is confirmed.
17.2.2 Special Processing
One View Transportation Load Inquiry converts the weight, volume, cubic volume, and distance to the UOM specified in the header of the application.
You can use processing options to specify the default UOM values in the header fields for weight, volume, and distance. You can also change UOMs during run time and view the weight, volume, cubic volume, and distance in the revised UOM.
The system converts all the currency amounts on the application to the currency specified in the header of the application. You can use processing options to specify default values for the header.
The reports from the One View Transportation Load Inquiry are based upon the actual ship date.
The system accumulates and updates total price, cost, and payable freight of the entire load only on the first line of the load. The system calculates and updates billable freight for each delivery point.
17.2.3 Reports
The reports delivered with the One View Transportation Load Inquiry application are:
-
Load Bulk Volume by Shipment Depot and Date
-
Load Distance by Shipment Depot and Carrier
-
Load Freight by Planning Depot
-
Load Payable Freight by Carrier and Planning Depot
-
Vehicle Utilization by Planning Depot
-
Packaged Load Analysis
17.2.3.1 Load Bulk Volume by Shipment Depot and Date Report
The Load Bulk Volume by Shipment Depot and Date report enables you to view load information using shipment depot and date as a filter. The Total and Average Load Bulk Volume by Shipment Depot bar-line combination graph enables you to compare the total and average bulk volume for loads shipped within a specified date range from selected shipment depots. The Load Bulk Volume by Shipment Depot and Date bar graph enables you to compare the total bulk volume for loads shipped on a specific date from selected shipment depots. The Load Bulk Volume by Shipment Depot, Date, and Carrier bar graph enables you to compare total bulk volume for loads shipped by specific carriers on a specific date from selected shipment depots. The Load Bulk Volume Percentage by Shipment Depot pie chart enables you to view the percentage of total bulk volume shipped by shipment depot. The Summary of Load Bulk Volume by Date, Shipment Depot, and Carrier table shows the historical shipment data for carriers and shipment depots that are used in the charts. The Load Bulk Volume Details Table displays all the historical load bulk volume detail records that were used to create the charts for the selected shipment depots.
This report contains the following components:
-
Total and Average Load Bulk Volume by Shipment Depot (bar-line combination graph)
-
Total Load Bulk Volume by Shipment Depot and Date (bar graph)
-
Total Load Bulk Volume by Shipment Depot, Date, and Carrier (bar graph)
-
Load Bulk Volume Percentage by Shipment Depot (pie chart)
-
Summary of Load Bulk Volume by Date, Shipment Depot, and Carrier (table)
-
Load Bulk Volume Details Table
17.2.3.2 Load Distance by Shipment Depot and Carrier Report
The Load Distance by Shipment Depot and Carrier report enables you to view load distance information using shipment depot and carrier as a filter. The Total and Average Load Distance by Shipment Depot bar-line combination graph enables you to compare the total load distance and average load distance of loads shipped from selected shipment depots. The Load Distance by Shipment Depot, Year, and Month line graph displays the annual and monthly load distance that originate from selected shipment depots. The Top 5 Carriers by Distance bar graph enables you to identify the top 5 carriers based on the total distance traveled from the selected shipment depot. The Average Payable Freight per Distance by Carrier bar graph enables you to compare the average payable freight charges based on distance for select carriers originating from a select shipment depot. The Average Load Weight by Shipment Depot bubble chart enables you to plot the average load weight in relationship to the total number of loads and the average load distance. The Year and Month Summary of Distance Traveled by Carrier table shows the historical distance information for carriers and time periods that are used in the charts. The Load Distance Details Table displays all of the historical load distance detail records that were used to create the charts for the selected shipment depots.
This report contains the following components:
-
Total and Average Load Distance by Shipment Depot (bar-line combination graph)
-
Load Distance by Shipment Depot, Year, and Month (line graph)
-
Top 5 Carriers by Distance (bar graph)
-
Average Payable Freight per Distance by Carrier (bar graph)
-
Average Load Weight by Shipment Depot (bubble chart)
-
Year and Month Summary of Distance Traveled by Carrier (table)
-
Load Distance Details Table
17.2.3.3 Load Freight by Planning Depot Report
The Load Freight by Planning Depot report enables you to view operating ratio and freight charges (billable and payable) information using planning depot as a filter. The Billable Freight and Average Billable Freight by Planning Depot bar-line combination graph enables you to compare the total billable freight charges to the average billable freight charge by planning depot. The Billable vs. Payable Freight by Year and Month line graph enables you to compare billable and payable freight charges for the same time period. The Operating Ratio by Planning Depot bar graph enable you to compare operating ratios for selected planning depots. The Payable Freight by Planning Depot bubble chart enables you to plot the payable freight charges in relationship to the total number of shipments and the total number of loads. The Billable Freight Percentage by Planning Depot pie chart enables you to view the distribution of billable freight charges by planning depot. The Summary of Payable Freight by Planning Depot and Carrier table displays a historical summary of payable freight charges, planning depot and carrier information used in the charts. The Summary of Billable Freight by Planning Depot table displays a historical summary of billable freight charges and planning depot information used in the charts. The Load Freight Analysis Details Table displays all the historical billable and payable freight charges detail records that were used to create the charts for the selected planning depots.
This report contains the following components:
-
Billable Freight and Average Billable Freight by Planning Depot (bar-line combination graph)
-
Billable vs. Payable Freight by year and Month (line graph)
-
Operating Ratio by Planning Depot (bar graph)
-
Payable Freight by Planning Depot (bubble chart)
-
Billable Freight Percentage by Planning Depot (pie chart)
-
Summary of Payable Freight by Planning Depot and Carrier (table)
-
Summary of Billable Freight by Planning Depot (table)
-
Load Freight Analysis Details Table
17.2.3.4 Load Payable Freight by Carrier and Planning Depot Report
The Load Payable Freight by Carrier and Planning Depot report enables you to view payable freight charges information using planning depot and carrier as a filter. The Total and Average Payable Freight by Carrier bar-line combination graph enables you to compare the total payable freight charges to the average payable freight charge by carrier. The Payable Freight by Carrier and Planning Depot bar graph enables you to compare payable freight charges for carriers shipping from the same planning depot. The Payable Freight by Planning Depot, Year, and Month line graph enables you to compare payable freight charges by planning depot for the same time period. The Payable Freight Percentage by Planning Depot pie chart enables you to view the distribution of payable freight charges by planning depot. The Load Weight by Carrier bubble chart enables you to plot the load weight by carrier in relationship to the payable freight charges and number of loads. The Summary of Payable Freight by Planning Depot and Carrier table displays a historical summary of payable freight charges, planning depot, and carrier information used in the charts. The Summary of Payable Freight by Planning Depot table displays a historical summary of payable freight charges and planning depot information used in the charts. The Load Payable Freight Analysis Details Table displays all the historical payable freight charges detail records that were used to create the charts for the selected planning depots.
This report contains the following components:
-
Total and Average Payable Freight by Carrier (bar-line combination graph)
-
Payable Freight by Carrier and Planning Depot (bar graph)
-
Payable Freight by Planning Depot, Year, and Month (line graph)
-
Payable Freight Percentage by Planning Depot (pie chart)
-
Load Weight by Carrier (bubble chart)
-
Summary of Payable Freight by Planning Depot and Carrier (table)
-
Summary of Payable Freight by Planning Depot (table)
-
Load Payable Freight Analysis Details Table
17.2.3.5 Vehicle Utilization by Planning Depot Report
The Vehicle Utilization by Planning Depot report enables you to view vehicle utilization information using planning depot as a filter. The Average Vehicle Weight and Volume Utilization Percentage by Planning Depot bar-line combination graph enables you to compare the vehicle weight utilization percentage to the vehicle cubic volume utilization percentage for selected planning depots. The Vehicle Bulk Volume Utilization Percentage and Average Bulk volume by Planning Depot bar-line combination graph enables you to compare the vehicle bulk volume utilization percentage to the vehicle average bulk volume for selected planning depots. The Vehicle Weight Utilization Percentage by Shipment Depot bubble chart enables you to plot the vehicle weight utilization percent for select planning depots in relationship to average load weight and number of loads. The Average Load Weight and Vehicle Weight Utilization Percentage by Vehicle Type bar-line combination graph enables you to compare the average load weight to the vehicle utilization percent for selected vehicle types. The Summary of Load Weight, Cubic Volume, and Bulk Volume by Planning Depot table displays a historical summary of weight, volume, and planning depot information used in the charts. The Vehicle Utilization Analysis Details Table displays all the historical vehicle information detail records that were used to create the charts for the selected planning depots.
This report contains the following components:
-
Average Vehicle Weight and Volume Utilization Percentage by Planning Depot (bar-line combination graph)
-
Vehicle Bulk Volume Utilization Percentage and Average Bulk Volume by Planning Depot (bar-line combination graph)
-
Vehicle Weight Utilization Percentage by Shipment Depot (bubble chart)
-
Average Load Weight and Vehicle Weight Utilization Percentage by Vehicle Type (bar-line combination graph)
-
Summary of Load Weight, Cubic Volume, and Bulk Volume by Planning Depot (table)
-
Vehicle Utilization Analysis Details Table
17.2.3.6 Packaged Load Analysis Report
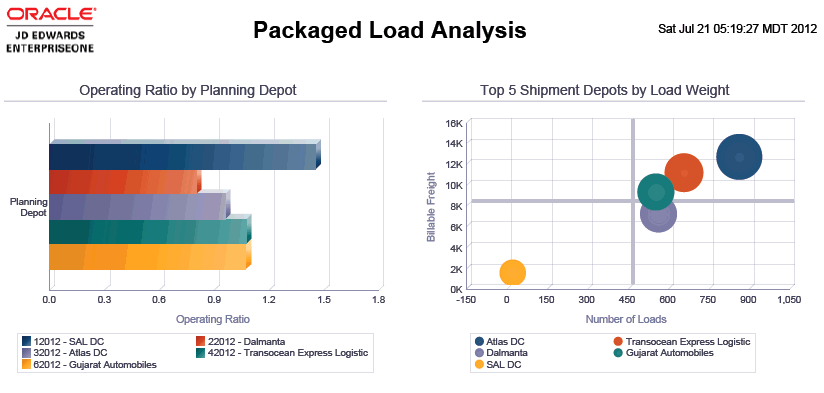
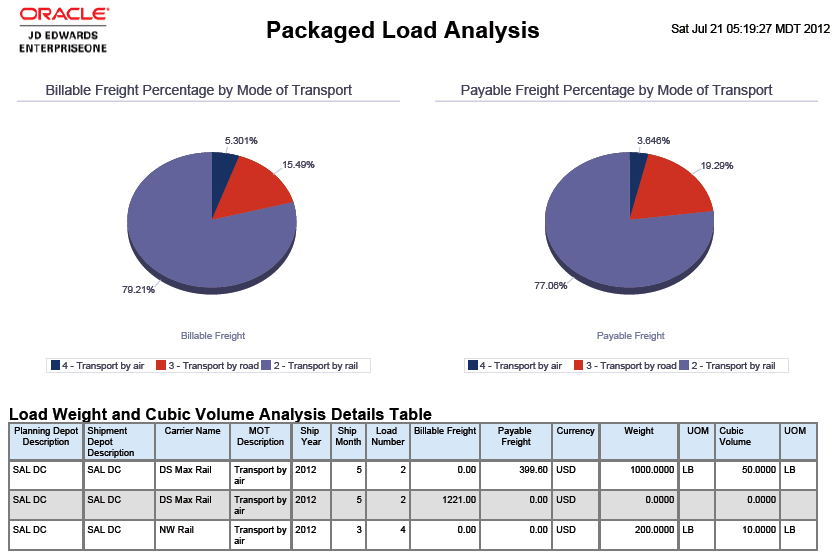
The Packaged Load Analysis report enables you to view load information using shipment or planning depot as a filter. The Vehicle Weight Utilization Percentage gauges displays the three shipment depots with the lowest vehicle utilization percentages. The Load Weight vs. Volume by Shipment Depot bar-line combination graph enables you to compare the load weight to the load volume for selected shipment depots. The Billable vs. Payable Freight by Year and Month line graph enables you to compare billable and payable freight charges for the same time period. The Payable Freight per Weight by Carrier bar graph enables you to compare payable freight per a defined unit of measure for selected carriers. The Billable vs. Payable Freight per Weight by Planning Depot bar graph enables you to compare billable and payable freight charges per a defined unit of measure for selected planning depots. The Operating Ratio by Planning Depot bar graph enables you to compare operating ratios for selected planning depots. The Top 5 Shipment Depots by Load Weight bubble chart enables you to plot the top 5 shipment depots by load weight in relationship to billable freight charges and number of loads. The Billable Freight Percentage by Mode of Transport pie chart enables you to view the distribution of billable freight charges by mode of transport. The Payable Freight Percentage by Mode of Transport pie chart enables you to view the distribution of payable freight charges by mode of transport. The Load Weight and Cubic Volume Analysis Details Table displays all the historical load weight and cubic volume detail records that were used to create the charts for the selected planning or shipment depot.
This report contains the following components:
-
Vehicle Weight Utilization Percentage (gauges)
-
Load Weight vs. Volume by Shipment Depot (bar-line graph combination)
-
Billable vs. Payable Freight by Year and Month (line graph)
-
Payable Freight per Weight by Carrier (bar graph)
-
Billable vs. Payable Freight per Weight by Planning Depot (bar graph)
-
Operating Ratio by Planning Depot (bar graph)
-
Top 5 Shipment Depots by Load Weight (bubble chart)
-
Billable Freight Percentage by Mode of Transport (pie chart)
-
Payable Freight Percentage by Mode of Transport (pie chart)
-
Load Weight and Cubic Volume Analysis Details Table
Figure 17-2 Packaged Load Analysis Report
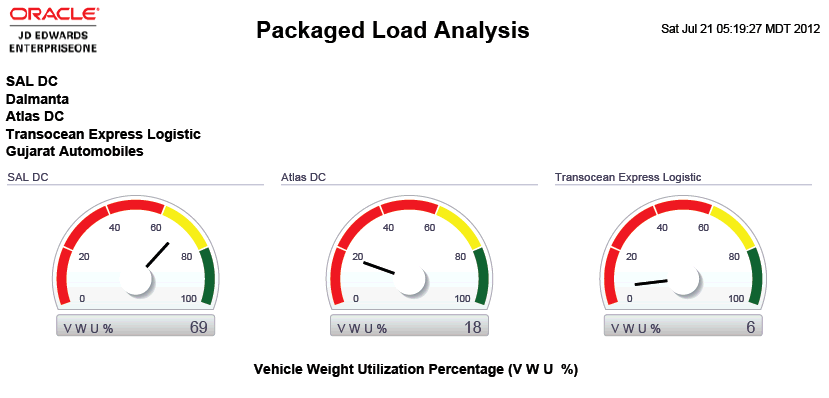
Description of ''Figure 17-2 Packaged Load Analysis Report''
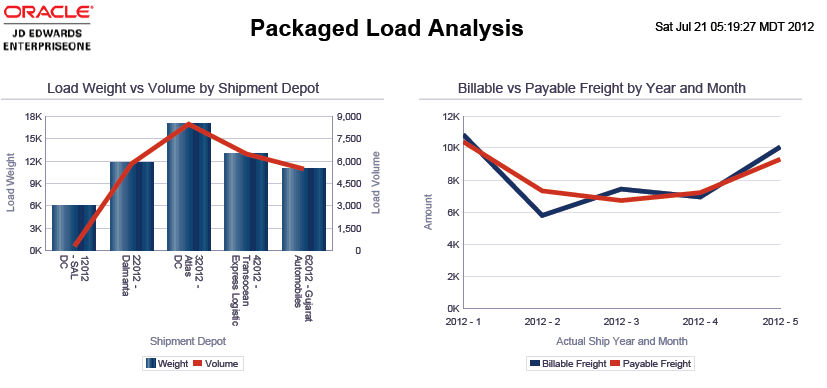
Description of ''Figure 17-2 Packaged Load Analysis Report''
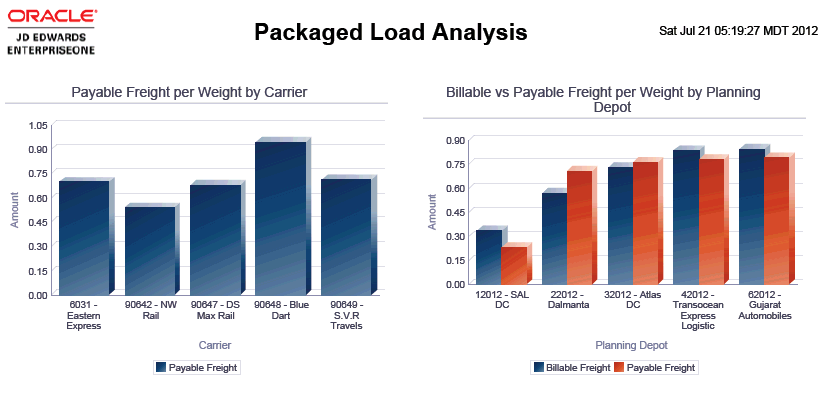
Description of ''Figure 17-2 Packaged Load Analysis Report''
Description of ''Figure 17-2 Packaged Load Analysis Report''
Description of ''Figure 17-2 Packaged Load Analysis Report''