| Oracle® Enterprise Data Quality for Product Data Governance Studio Reference Guide Release 5.6.2 Part Number E23609-02 |
|
|
View PDF |
| Oracle® Enterprise Data Quality for Product Data Governance Studio Reference Guide Release 5.6.2 Part Number E23609-02 |
|
|
View PDF |
This chapter explains how to use the Output tabs created by your DSA so that you can review your data.
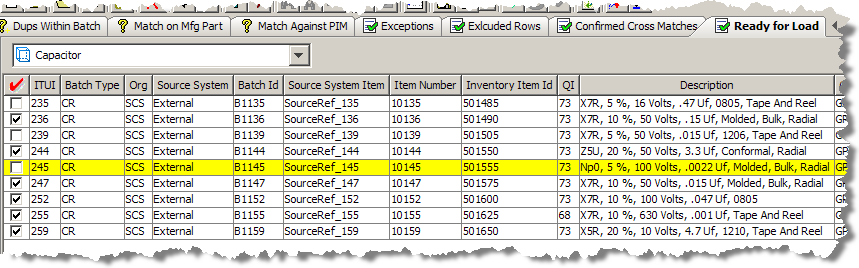
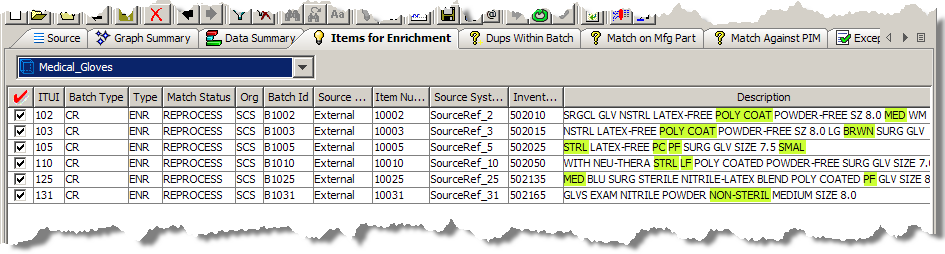
The ”Review, Approve and Route” Output tabs are identified by the green check mark icons. These types of tabs contain tables of output data and correspond to a DSA output step with the output type of 'Review, Approve, and Route'. Data in these tabs may be selected for output to a file, edited, emailed to others, or run as input to a synchronous job. The following figure shows an example of a ”Review, Approve and Route” Output tab.
The following sections describe how to use Output tabs.
You can select a single row or multiple rows for additional processing using the following methods:
Use Ctrl+a.
Press and hold Ctrl and click on each row to select.
Press and hold Shift then click the first row and then the last in the group you want to select.
You may right-click on any row in a Governance Studio table and copy the data in the cell that you are hovered over to the clipboard. Data that has been copied into the clipboard may then be pasted into another application or into a different Output tab table in the Governance Studio.
For more information about context-sensitive menus in task panes, see "Top Pane Functions".
If the cell has not been designated as a read only cell in the DSA Output tab, double-clicking a cell in any of the Output tab tables enables one of the following actions:
The cell can be edited. A text insertion cursor appears, the background of the cells turns to white, and you can enter or change the text in the cell.
Note:
The ability to edit a field is configured in the DSA in the Application Studio. If a field cannot be edited and you want that ability, you can change the behavior by adding two exclamation points (!!) to the Edit Value output column of that output step.A list appears and you can select one of the values predetermined by the DSA. The value, ”<empty>”, allows you to invalidate (or null) the selected value from the list.
Disables a suggestion when in the AutoSuggest table, which changes the color to pink. Double-clicking it again re-enables the suggestion, which turns the highlight back to green. You can choose the suggestions you want to keep and those to discard. For more information, see "Review, Approve and Route Output Tabs".
The ”Review, Approve and Route” tab with AutoSuggest output is identified by the light bulb icon. Data in these tabs may access the Governance Studio AutoSuggest feature; this feature automatically predicts attributes that may have been missed due to misspellings and abbreviations or missing grammar. When this tab is not empty and there are suggested values for missing attributes available, the light bulb button is active. If no suggestions were found, this button is inactive (dimmed). The following figure shows an AutoSuggest table where the suggestion button is available.
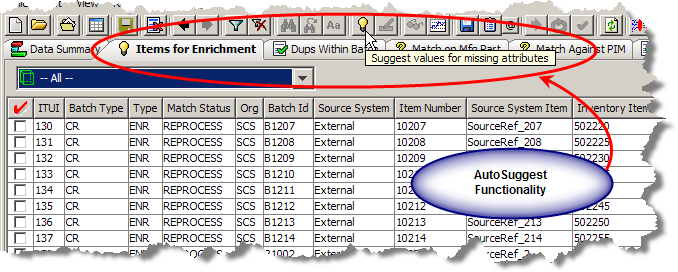
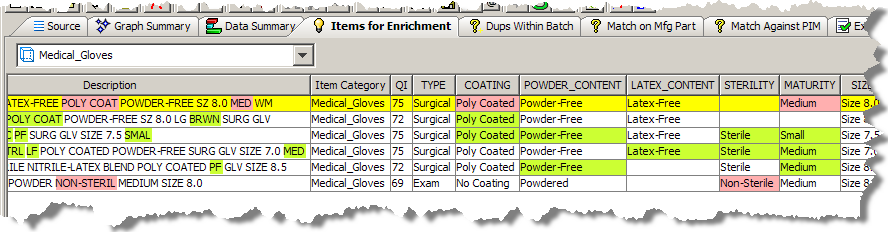
After clicking on an AutoSuggest Output tab, a table of data designated for output by the respective output step in the DSA is displayed. To view suggestions, click on the AutoSuggest light bulb button or from the Run menu, select AutoSuggest. Suggestions are now highlighted in green as shown in the following figure.
There are several operations that are allowed in the AutoSuggest table to process your data further and make it easier to edit, move, copy or accept suggestions. In addition to the normal table functions available to Output tab tables, the AutoSuggest table allows you to accept or reject suggestions by double-clicking the cell you want to reject.
The following figure shows the results of double-clicking a suggested cell in the Maturity column. The cell is now highlighted in pink showing that the attribute has been rejected; you can return the cell to accept by double-clicking the cell again.
When you have completed analyzing suggestions by rejecting the bad ones and keeping the good ones you may select rows you want to complete the enrichment process by clicking the check box to the left of the row to select it. Once all of the rows you to be enriched are selected, click the Re-run button to send the checked rows to a secondary DSA process to complete the process. The checked rows move from the AutoSuggest tab if the enriched attributes and/or additions to the description increase the QI to the point where the row(s) no longer require enrichment.
You can add or augment the knowledge in your data lens using this feature. Once you have used the AutoSuggest feature to identify matching text in your data further, you can add these additional matches to your data lens so that they are automatically recognized in subsequent processing. For example, 'STRL' is a variation of 'Sterile' and adding this variant form would increase the knowledge in your data lens therefore increasing the quality index.
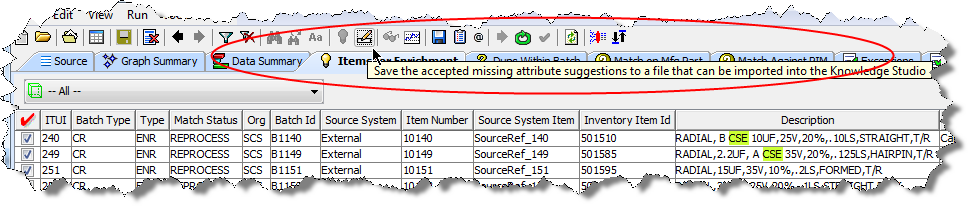
Using the Apply Augmentations feature creates missing attribute suggestions and this knowledge is then written to an Excel file. The Apply Augmentations button, which is a pencil on paper, is active only after using AutoSuggest otherwise this button is inactive (dimmed).
You can review and modify this knowledge before importing the data in the Excel file into your data lens in the Knowledge Studio.
Caution:
If you intend on both applying Augmentations and using a Re-Run secondary DSA to continue processing the rows, you must Apply Augmentations first.When you process the Re-Run first, the rows and the included Augmentations are removed from the tab and no longer available to process the Augmentations.
Use the following steps to augment attribute variants in your data lens:
Select an AutoSuggest Output tab.
Click the AutoSuggest button to identify variants.
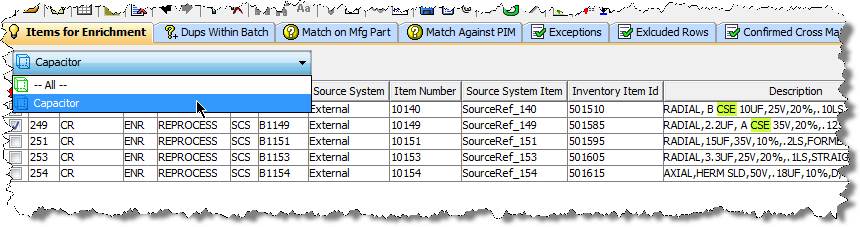
Select All or a single Item Definition for which you want to add attribute variant knowledge. If you select a single Item Definition, only knowledge related to that Item Definition is created; selecting All creates knowledge for all of the Item Definitions that have suggestions.
Select the rows that contain the variants you want to add.
Click the Apply Augmentations button or from the Run menu, select Apply Augmentations.
Locate the directory you in which to save the Excel file and click Save. The file is automatically named using the following convention:
Autosuggest-JobID-DataLensName-ItemDefinition.xls
Open the Excel file to review and modify (if necessary) the new knowledge.
Open the corresponding data lens that was identified as part of the file name created in the previous step in the Knowledge Studio.
From the File menu, select Import Phrases and Terms.
Locate the AutoSuggest file, select it, and then click Open.
Review the effected attributes; the augmentations are denoted with a light bulb icon in the hierarchical tree.
A matching application is a set of two DSAs that you use to find appropriate data records that match pre-specified criteria. A matching process is built upon a data lens (or set of data lenses), used to recognize items by their attributes and to rank attributes in order of importance.
Note:
The matching capability is an additional Enterprise DQ for Product component that is purchased and licensed. If match result Output tabs are expected though are not displayed, this functionality may not be activated. For more information, see Oracle Enterprise Data Quality for Product Data Oracle DataLens Server Administration Guide. To purchase this additional component, contact Oracle Sales.The output of the matching process is used in a DSA output step. There are two match result output types variations available for you to create in your DSA:
Single Selection Review, Approve, and Route
Multiple Selection Review, Approve and Route
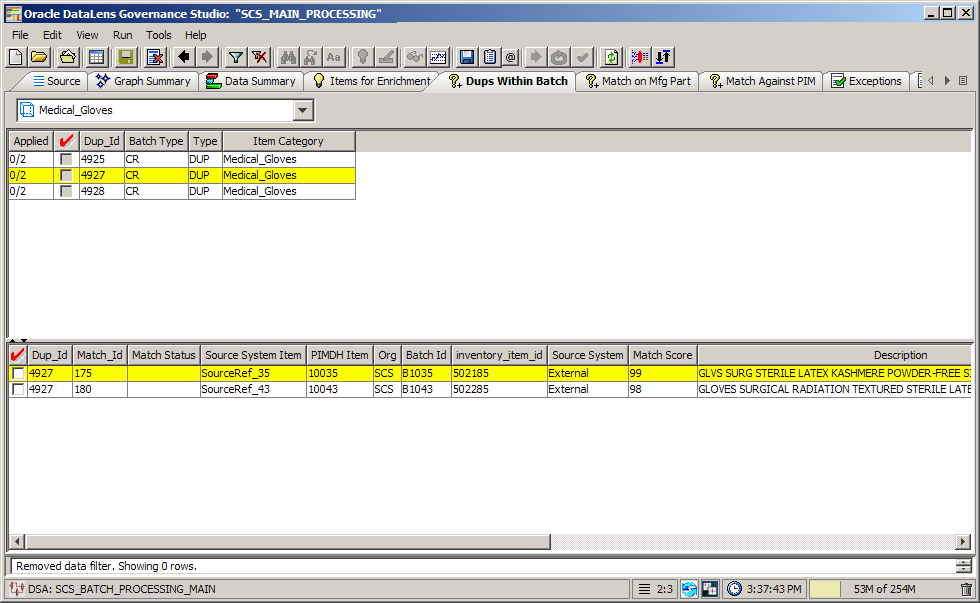
If you have created a match results output step in your DSA, then the corresponding tab appears in your Governance Studio project. The following figure shows a project with a sample match result set.
The Output tabs that contain data duplicates display a parent-child view of the match results. In a New Item Introduction use case, the system can match the new item against any existing items in your Item Master. The inbound row will be classified, its key attributes extracted and standardized, and a Semantic Key is created. This Semantic Key is used to find any potential duplicate rows in the Items Master. If matches for the incoming row are found in the item master, the system can route the row to a potential duplicates Output tab and give you a parent child view of the new record on the top pane, and the potential matches in the bottom pane.
The split screen function is only used for match result Output tabs. Once a row is selected from the top pane, the corresponding matched candidates for that row on the bottom pane are highlighted as in the following figure.
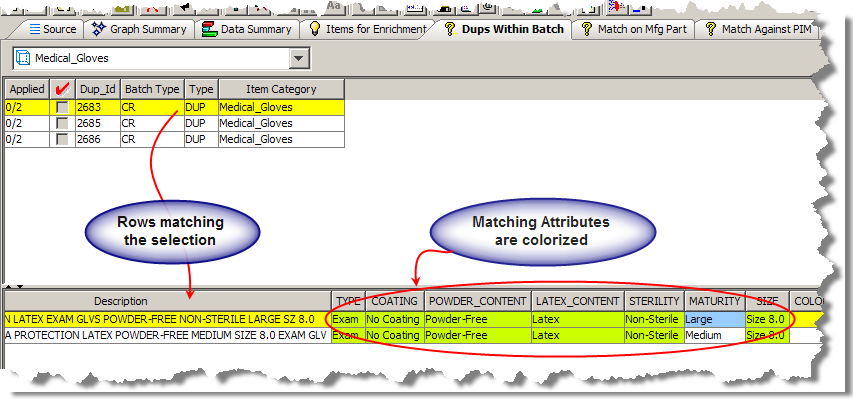
The Governance Studio output is color coded in order to highlight key attributes participating in the match. Additionally, the attributes are colorized based on the type of match rule that has been triggered on the attribute. Attributes are colorized as follows:
Match the parent row and were set to required in the item specific match rules.
Match the parent row and were set to participating, but not required in the item-specific match rules.
Indicates that the matched row did not contain a value for that particular attribute so that attribute did not participate in the match score.
Indicates that the matched row contains a value for that attribute, but that the attribute value for the matched row did not match the attribute value for the parent row.
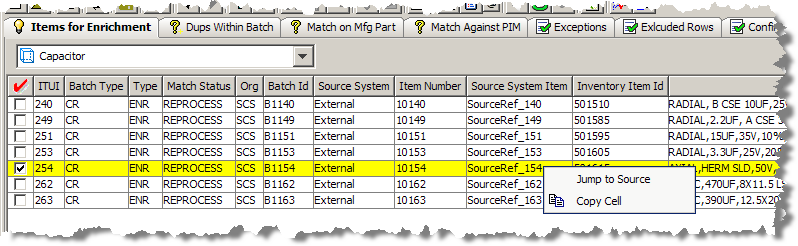
You can use the context-sensitive menu by right-clicking a data record and use the options as follows:
| Jump to Source
Activate the Source tab with the same selected output data selected. For example, this allows you to view the ID if it were not included in the output. |
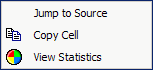 |
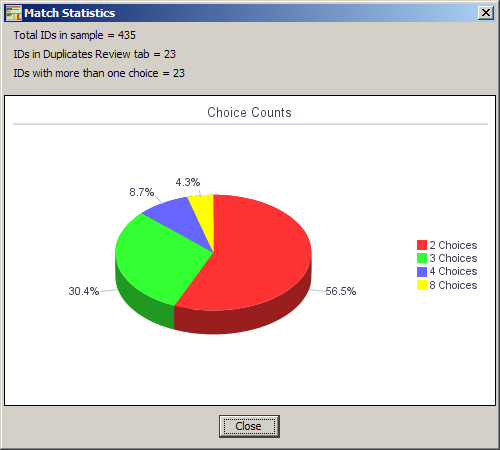
| Copy Cell
Copy the cell for downstream processing in a data lens or to another worksheet or file. View Statistics Displays number of choices per record; use this option for Match Process results to produce a graph of the breakout of rows with matching records as in the following figure: |
|
Similar to the top pane functionality, you can right-click on a matched row to use the following additional context-sensitive menu options.
| Filter
Allows you to filter the displayed data based on text or a text pattern. The filter operation applies only to the currently selected tab. Only the rows that match the text entered in the Filter dialog are displayed in the table. For more information about filtering, see "Filtering Data". Un-Filter Removes the filter applied to the selected tab so that all of the data is displayed. |
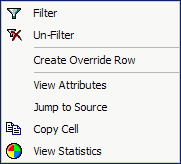 |
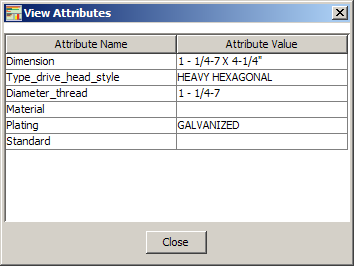
| Create Override Row
This functionality is detailed in the Survivorship Process section. View Attributes Provides a table view of the attributes for the selected row as in the following figure. |
|
The Governance Studio interprets a set of results and populates match results tabs based on:
the DSA options that were set indicating a matched set, and
the accuracy of the attribute naming, order and structure.
You review the rows and determine the matching rows based on the defined use case as in the examples in the following sections.
You select a single match item for each requested item to be quoted and the Governance Studio identifies the best record to for use in the quote based on the information in the data lens and other industry related criteria.
In the following figure, the selected Dup_Id is 6222 for which there are two items in the item master that can be quoted. To process the request for the quote process, you would select the best match based on the information provided by the system and possibly other criteria, such as the supplier or margin, and then select a single row to continue to be quoted. In this case, the Governance Studio determined that record 156 was the best quotable item for the Dup_Id 6222.
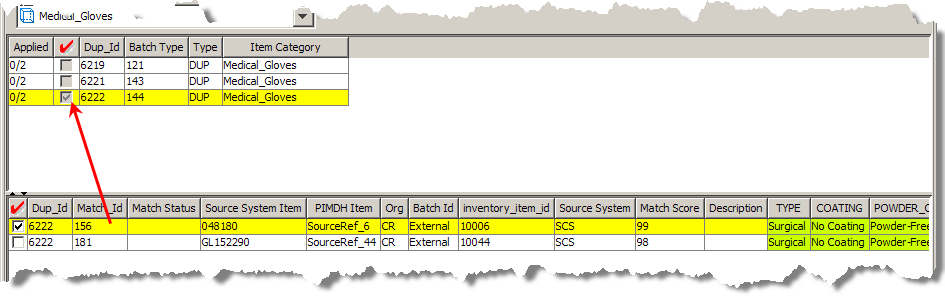
Once the record for quote has been selected, you can move the record to a downstream process using the options previously described.
A second popular use case is the creation of a functional equivalents cross-reference to be used by web-based merchandising applications. In this case, a cross reference of all the functional equivalents found in the item master by the Oracle DataLens Server corresponding to Dup_Id 6222 is created. In the following figure, Match_Id 156 and 181 are selected as the two functional equivalent records for record 12.
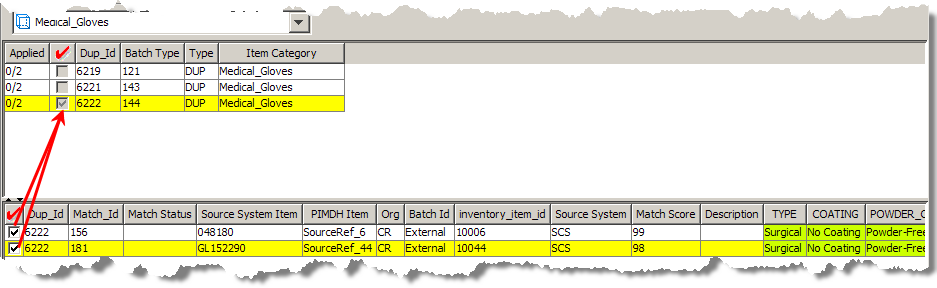
Once a record has been selected, you can process the checked rows with the options previously described.
The Dup_Id/Match_Id relationship can be used as a cross-reference, and by a down stream process, such as a PIM to create the cross-reference.
This advanced option assists in an item survivorship process by creating an override row that can then be manipulated to create a blended record of all possible duplicates. This is used during a system consolidation process.
Begin creating an override row by selecting a duplicates tab.
In the upper-pane, locate a duplicate to be merged and click the adjacent check box.
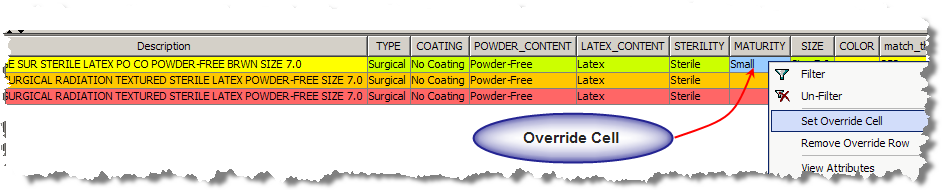
In the lower-pane, right-click on the duplicate row you want to merge and select Create Override Row.
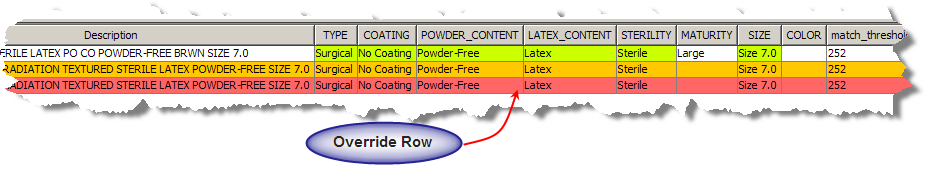
The selected override row is highlighted in orange and is indicated in the Match Status column by MO (manual override). Once an override row is selected, you can set an override cell from the context-sensitive menu or remove the override row selection.
In the following example, the third row has been selected as the override row, and the contents of the Maturity column (attribute) in the first row has been selected as an override cell.
The resulting blended record is that all the information from the override row with the exception of the size attribute, which is extracted from the override cells. You can select an unlimited number of override cells to create the blended record. Once the rules for the composite record have been created, the rows are selected.
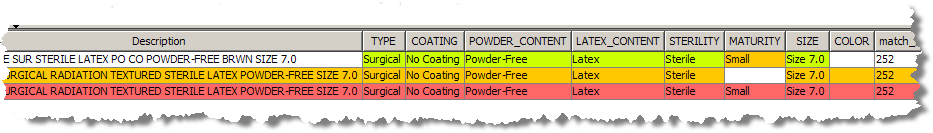
All of the additional options create a new row for the blended record tagged with an MO for Manual Override in the matched Match Status field. This informs the downstream survivorship process that this row is the override, which contains the blended record information.
Tip:
You can use a regular expression to filter your data to make it easier to work with a subset of the data and find the row that you want to use as the override row. For example, if your data contains an ellipsis (…) then you could filter your data using this as part of the regular expression with the text you are searching for, such as '…abc'. The filtered results would return only those rows that meet that condition. As a result, only checked rows of the filtered data are processed rather than the entire set so that you can easily create your override row. You first must remove the filter to remove the override row from the set of data. For more information about filtering, see "Filtering Data".Trend analysis is a Governance Studio feature that allows you to see a graph of the output data row count for various job runs you have made over time for a given output step. You can use this feature on any tab by clicking the Trend Analysis button or from the View menu, select Show Trend.
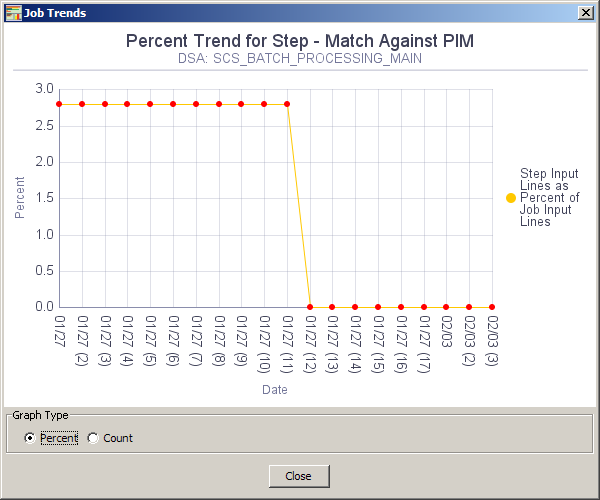
You can toggle the view of the graph as a percentage or count of the rows in the selected Output tab using the Graph Type options provided.
Though this functionality is available on all tabs, if trend data is not available, a message indicating this is displayed.
You can select one or more rows to create a task for another user to update the data lens. This capability is available on any Output tab.
From the Run menu, select Create Task from Checked Rows.
Note:
If the Output tab is a split-screen, you must choose whether you want to use total number of rows that include both the detail and total number of checked rows.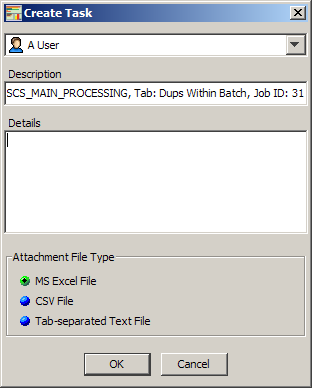
Select the user to whom this task will be assigned.
Edit the automatically populated Description field if you desired. It is populated with the DSA name, Output tab that the task is being created from, and a unique Job ID for the task (though this is not recommended.)
Add all instructions for user so that the task can be accomplished in the Details field.
Select the type of file to contain the selected to attach to the task using the options.
Click OK.
The task is created and an email containing the task details is sent to the assigned user. Attachments can be downloaded by the assigned user as described in the View My Tasks section.
You can see if you have any tasks assigned to use with this feature.
From the View menu, select View My Tasks.
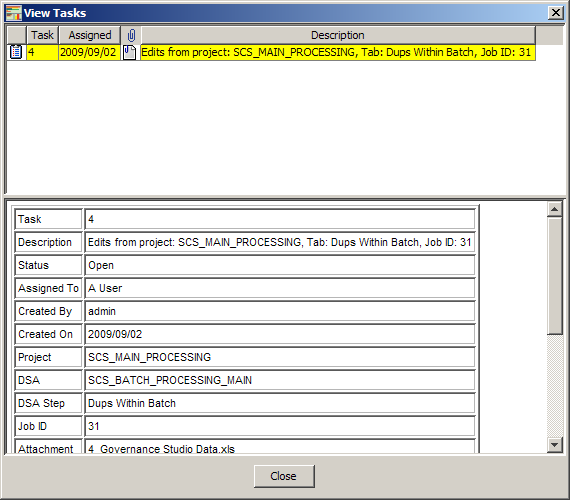
All assigned tasks are displayed in the top pane, while the bottom pane provides the details for the selected task.
Note:
Though the fields in the bottom pane appear to be editable, the changes are not saved.The context-sensitive menu in the top pane is activated by right-clicking the attachment icon and is used as follows:
| Change Task Status
See "Changing the Task Status". Download Attachments |
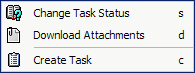 |
| You can download the file that was saved when the task was created for use in completing the task. A file save dialog appears for you to select the directory in which to save the file.
Create Tasks See "Creating a Task". |
|
Selecting this option allows you to change the status of the task and/or reassign the task to another user.
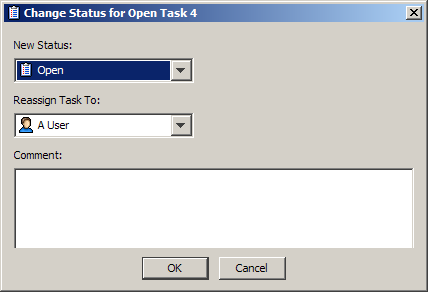
Select a new status and/or a user to reassign the task to from the lists.
Tip:
You can use the Unassigned Tasks user if you are unsure who you want to review this task and intend to assign it the proper person later.Enter a comment that reflects why you have affected the change for future reference or to alert the new recipient of the task and why they are now responsible for it.
Click OK.
Selecting this option allows you to create an entirely new review task.
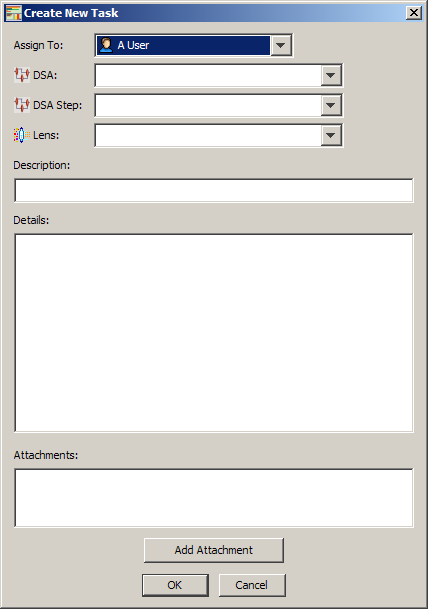
Select a user to complete this task.
Select the DSA and the DSA step that you want to change.
Select the data lens to which the change is to be applied.
Enter a description and specific instructions on how to perform the task.
If you have a data file or other information that you want to attach, click Add Attachment, locate the file, and then click OK.
Repeat this step until all necessary files are attached.
Click OK.
The task is created and an email containing the task details is sent to the assigned user.
|
Copyright © 2001, 2011, Oracle and/or its affiliates. All rights reserved. Legal Notices |
|