This section provides a detailed description of the monitoring data collected for each target type. It also explains how this information is displayed in various panels, which are combined to form the Oracle VDI target pages.
Metrics collection is an asynchronous operation. Live data, such as desktop states or CPU load, are updated every 5 or 15 minutes by default depending on their importance. This means that related targets, meaning parent or child targets, may show different values at the same point in time. Configuration data is collected every 24 hours. The collection schedule can be altered by the Oracle Enterprise Manager administrator, as described in "Collection Intervals" in Section 4.3, “Metrics Collection”.
This section provides a detailed description of the different panels that appear in multiple target pages. Panels that are specific to one target page, are described in the target page overviews in the sections that follow.
- Summary
Every Oracle VDI target page has a Summary panel. It contains general configuration information and, if applicable, hardware configuration details of the host. Click Oracle VDI Manager to access the administration tool for the Oracle VDI Center.
- Desktop States
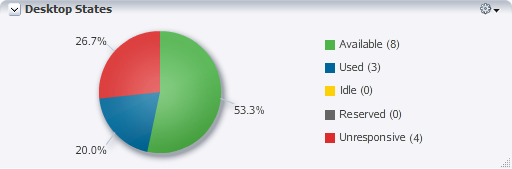
In the Desktop States panel, current information for the desktop states is displayed as a pie chart. For each desktop state, a total count is shown in brackets in the legend. Possible desktop states are: available, used, idle, reserved and unresponsive.
- Desktop States History
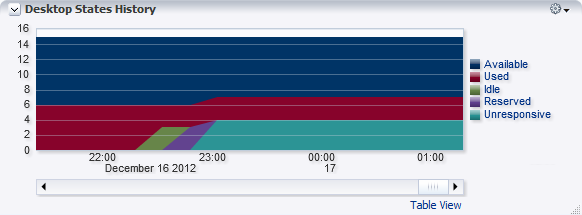
In the Desktop States History panel, the state of desktops is shown in a stacked area chart on a time scale. The number of desktops in each state are stacked, so that the highest value represents the total number of desktops in the company. The chart shows the history of desktop states over a period of time. The time period can be modified by zooming in or out. You control the zoom level by clicking the magnifying glass icon to the left of the scroll bar or by dragging the edges of the slider on the scroll bar.
Desktops are in an available, used, idle, reserved or unresponsive state, and individual graphs are displayed if you move the mouse pointer over the colored area or legend item.
Click Table View to display the chart values in a pop-up window as a table, where each row represents a measure recorded at a specific time and date.
- Machine States
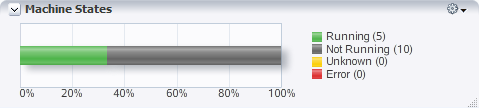
In the Machine States panel, current information for the virtual machine states is displayed on a horizontal bar with a percentage scale. For each virtual machine state, a total count is shown in brackets in the legend. Possible machine states are: running, not running, unknown and error.
- Desktop Distribution by CPU Utilization
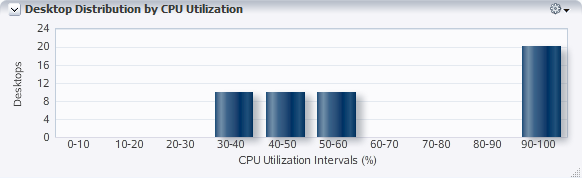
In the Desktop Distribution panel, the total number of desktops is broken down by the percentage of CPU load. The diagram displays the number of desktops for each 10% interval of CPU activity.
- System Utilization
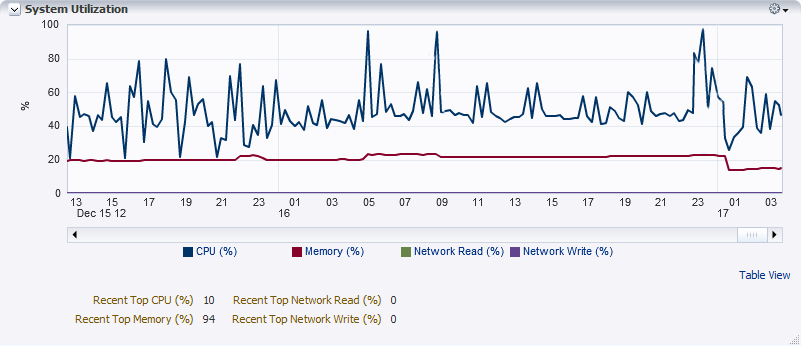
The System Utilization line chart displays four major performance parameters of a host or a group of hosts: CPU usage, memory usage, network read bandwidth and network write bandwidth. The chart shows the history of these parameters over a period of time. The time period can be modified by zooming in or out. You control the zoom level by clicking the magnifying glass icon to the left of the scroll bar or by dragging the edges of the slider on the scroll bar.
The values used to plot the line graphs are typically averages based on metrics collected from different servers. The highest value among the metrics from all servers is called the top value, and the most recently collected top values are displayed below the chart.
The target type determines whether top values are displayed. For example, CPU utilization always has a top value because a single host likely has multiple cores. However, in a single host configuration there is no top value for memory because it is treated as one global entity.
NoteIncidents and problems related to these metrics are triggered by top values that exceed a threshold and not by their totals or averages.
Individual graphs are displayed if you move the mouse pointer over the line or legend item.
Click Table View to display the chart values in a pop-up window as a table, where each row represents a measure recorded at a specific time and date.
- File System Utilization
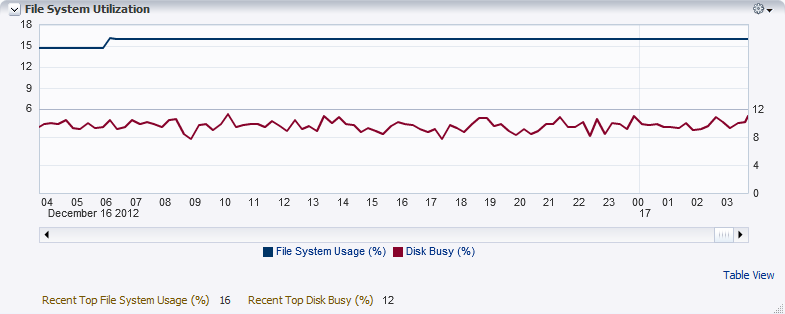
The File System Utilization line chart displays two major disk activity parameters of a host or a group of hosts: file system usage and disk busy percentage. The chart shows the history of these parameters over a period of time. The time period can be modified by zooming in or out. You control the zoom level by clicking the magnifying glass icon to the left of the scroll bar or by dragging the edges of the slider on the scroll bar.
Individual graphs are displayed if you move the mouse pointer over the line or legend item.
Click Table View to display the chart values in a pop-up window as a table, where each row represents a measure recorded at a specific time and date.
- Incidents and Problems
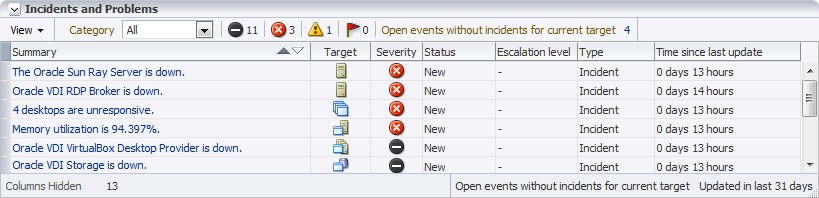
The Incidents and Problems table shows any event from a target or resource that exceeds a threshold, stops working, or disappears from monitoring. For each event, the default table shows when it occurred and which monitoring target is impacted, provides a short description, and indicates the severity. See Section 3.3, “Predefined Incidents and Problems” for additional information.
In the View menu, in the top-left corner of the panel, you can configure which columns are displayed in the table.
Warnings, which are the lowest severity category, are not escalated from child targets to parent targets.
Click the event description in the Summary column to display all details of the incident or problem in Oracle Enterprise Manager's built-in Incident Manager.
The Oracle VDI Center is the main target node in the Target Navigation panel, to which all other Oracle VDI targets are hierarchically connected. Its monitoring page is designed to provide an overview of the most important metrics and configuration data, enabling you to quickly determine the general status of the entire Oracle VDI environment. Several areas of this monitoring page provide links to child targets, such as companies and desktop providers, which enable you to drill-down quickly into the details of components that require investigation.
Target Page Information
This target page provides the following resource details and monitoring data:
- Summary
The Summary panel shows configuration details such as the Oracle VDI Center target name and the Oracle VDI database setup and status.
Click Oracle VDI Manager to access the administration tool for the Oracle VDI Center.
- Desktop States
Refer to the functional description of the Desktop States panel in Section 3.2.1.
The chart applies to all desktops in the entire Oracle VDI Center.
- Companies
All companies that are configured in the Oracle VDI Center are displayed in a table, showing the total number of desktops for each company, and how many of them are in use or unresponsive. Oracle VDI companies that are down, appear at the top of the table.
Click the name of an Oracle VDI company to access its target page directly.
- Oracle VDI Hosts
All hosts that are part of the Oracle VDI Center are displayed in a table with their respective CPU usage, memory usage and file system usage. Oracle VDI hosts that are down, appear at the top of the table.
Click the name of an Oracle VDI host to access its target page directly.
- Machine States
Refer to the functional description of the Machine States panel in Section 3.2.1.
The chart applies to all virtual machines in the Oracle VDI Center.
- Desktop Providers
All desktop providers that are managed within the Oracle VDI Center are displayed in a table with their respective top CPU usage, memory usage and file system usage. Oracle VDI desktop providers that are down, appear at the top of the table.
Click the name of an Oracle VDI desktop provider to access its target page directly.
- Incidents and Problems
Refer to the functional description of the Incidents and Problems panel in Section 3.2.1.
The table shows incidents and problems for the entire Oracle VDI Center.
An Oracle VDI host is a host that runs the Oracle VDI software, and manages user connections to virtual desktops. Although single-host configurations are possible, Oracle VDI Centers configured for high-availability and failover always consist of multiple hosts. For the desktop sessions as well as for the Oracle VDI configuration, an Oracle VDI host runs a number of services. These services and desktop sessions constitute the most important monitoring data provided specifically on the Oracle VDI host target page.
Target Page Information
This target page provides the following resource details and monitoring data:
- Summary
The Summary section for an Oracle VDI host target is subdivided as follows:
General Information: the host's name, Oracle VDI version and operating system
Tools: a link to the administration tool for the Oracle VDI Center
System Information: details of the host's hardware configuration
- Services
The Oracle VDI and remote connection services configured on this host are displayed in a table with clear status indication. If a host is database master or replication host, or primary or secondary Sun Ray server, this is shown in the Information column.
Desktop sessions are in an active, disconnected or critical state. Critical sessions are remote connections with a packet loss of 10 percent or more.
- Session States History
The state of desktop sessions is shown in a line chart on a time scale. The chart shows the history of session statistics over a period of time. The time period can be modified by zooming in or out. You control the zoom level by clicking the magnifying glass icon to the left of the scroll bar or by dragging the edges of the slider on the scroll bar.
Desktop sessions are in an active, disconnected or critical state. Critical sessions are remote connections with a packet loss of 10 percent or more.
- System Utilization
Refer to the functional description of the System Utilization panel in Section 3.2.1.
The chart indicates system load on the selected Oracle VDI host.
- File System Utilization
Refer to the functional description of the File System Utilization panel in Section 3.2.1.
The chart applies to the selected Oracle VDI host's file system.
- Incidents and Problems
Refer to the functional description of the Incidents and Problems panel in Section 3.2.1.
The table shows incidents and problems for the selected Oracle VDI host.
Oracle VDI companies provide access to user directories and contain pools of desktops for these users. An Oracle VDI Center can contain multiple companies. Users and virtual desktops are separated by company. Virtualization hosts and storage are part of the underlying infrastructure, and can be shared between companies. The Oracle VDI company target page contains monitoring information only from the pools, desktops, users and groups associated with it.
Target Page Information
This target page provides the following resource details and monitoring data:
- Summary
The Summary section for an Oracle VDI company target is subdivided as follows:
General Information: the company name and total number of desktops in its pools
Tools: a link to the administration tool for the Oracle VDI Center
User Directory: details of the directory service configured for this company
- Desktop States
Refer to the functional description of the Desktop States panel in Section 3.2.1.
The chart applies to all desktops associated with the selected Oracle VDI company.
- Pools
All desktop pools that are configured for the selected Oracle VDI company are displayed in a table, showing the total number of desktops in each pool, how many are in use or unresponsive, and the desktop provider type that hosts the desktops. Oracle VDI pools which are down, appear at the top of the table.
Click the name of an Oracle VDI pool to access its target page directly.
- Desktop States History
Refer to the functional description of the Desktop States History panel in Section 3.2.1.
The chart shows the history of desktop states within the selected company.
- Machine States
Refer to the functional description of the Machine States panel in Section 3.2.1.
The chart applies to all virtual machines in the selected company.
- Desktop Distribution by CPU Utilization
Refer to the functional description of the Desktop Distribution by CPU Utilization panel in Section 3.2.1.
The graph applies to all desktops in the selected company.
- System Utilization
Refer to the functional description of the System Utilization panel in Section 3.2.1.
The chart indicates system load based on metrics collected from all hosts and storages that are used by the company's pools.
- File System Utilization
Refer to the functional description of the File System Utilization panel in Section 3.2.1.
The chart applies to the storage available to all desktops in the pools that belong to the company.
- Incidents and Problems
Refer to the functional description of the Incidents and Problems panel in Section 3.2.1.
The table shows incidents and problems for the selected company.
A pool is a collection or container of desktops. At the same time, a pool is a functional and logical subdivision of the company, which encompasses all desktops in all its pools. Typically, you create different pools for different types of users or different categories of desktops. The Oracle VDI pool monitoring data recorded for desktops is a subset of the same metrics displayed in the parent target page of the company.
Target Page Information
This target page provides the following resource details and monitoring data:
- Summary
The Summary section shows configuration details such as the Oracle VDI pool target name, the associated desktop provider and type, and the desktop assignment method. The information displayed depends on the type of desktop provider associated with the desktop pool: an Oracle VDI VirtualBox desktop provider returns the most detailed information.
Click Oracle VDI Manager to access the administration tool for the Oracle VDI Center.
- Desktop States
Refer to the functional description of the Desktop States panel in Section 3.2.1.
This panel is displayed only for VirtualBox, Microsoft Hyper-V, VMware vCenter and Generic pools.
The chart applies to all desktops present in the selected Oracle VDI pool.
Microsoft Remote Desktop providers report Session states instead of Desktop states.
- Desktop States History
Refer to the functional description of the Desktop States History panel in Section 3.2.1.
This panel is displayed only for VirtualBox, Microsoft Hyper-V, VMware vCenter and Generic pools.
The chart shows the history of desktop states within the selected pool.
Microsoft Remote Desktop providers report Session states history instead of Desktop states history.
- Machine States
Refer to the functional description of the Machine States panel in Section 3.2.1.
This panel is displayed only for VirtualBox, Microsoft Hyper-V and VMware vCenter pools.
The chart applies to all virtual machines in the selected pool.
- Desktop Distribution by CPU Utilization
Refer to the functional description of the Desktop Distribution by CPU Utilization panel in Section 3.2.1.
This panel is displayed only for VirtualBox pools.
The graph applies to all desktops in the selected pool.
- System Utilization
Refer to the functional description of the System Utilization panel in Section 3.2.1.
This panel is displayed only for VirtualBox pools.
The chart indicates system load based on metrics collected from all hosts and storages that are used by the company's pools.
- File System Utilization
Refer to the functional description of the File System Utilization panel in Section 3.2.1.
This panel is displayed only for VirtualBox pools.
The chart applies to the storage available to all desktops in the pool.
- Incidents and Problems
Refer to the functional description of the Incidents and Problems panel in Section 3.2.1.
The table shows incidents and problems for the selected pool.
A desktop provider is the collection of virtualization resources (CPU, memory and storage) that are used to run the desktops. For the Oracle VDI VirtualBox desktop provider, all virtualization and storage hosts are treated as separate monitoring targets in the Enterprise Manager Plug-in for Oracle VDI. The desktop provider target page displays their cumulated metrics.
Target Page Information
This target page provides the following resource details and monitoring data:
- Summary
The Summary section for an Oracle VDI VirtualBox desktop provider target contains the name of the desktop provider and the number of running desktops.
Click Oracle VDI Manager to access the administration tool for the Oracle VDI Center.
- Hosts and Storages
All virtualization and storage hosts that are part of the Oracle VDI VirtualBox desktop provider are displayed in a table with their respective top CPU usage, memory usage and file system usage. hosts or storages which are down, appear at the top of the table.
Click the name of a virtualization or storage host to access its target page directly.
- System Utilization
Refer to the functional description of the System Utilization panel in Section 3.2.1.
The chart indicates system load based on metrics collected from all VirtualBox hypervisors and storages configured for the desktop provider.
- File System Utilization
Refer to the functional description of the File System Utilization panel in Section 3.2.1.
The chart applies to the selected Oracle VDI VirtualBox desktop provider hosts' file systems.
- Incidents and Problems
Refer to the functional description of the Incidents and Problems panel in Section 3.2.1.
The table shows incidents and problems for the selected Oracle VDI VirtualBox desktop provider.
An Oracle VDI VirtualBox hypervisor target page provides a detailed view on the configuration details and monitoring data of an individual VirtualBox hypervisor. An Oracle VDI VirtualBox desktop provider may consist of multiple VirtualBox hypervisors. If so, the VirtualBox desktop provider target page displays data cumulated from the hosts, and each VirtualBox hypervisor has its own target page.
Target Page Information
This target page provides the following resource details and monitoring data:
- Summary
The Summary section for an Oracle VDI VirtualBox target is subdivided as follows:
General Information: the host name and the number of desktops it hosts
Tools: a link to the administration tool for the Oracle VDI Center
System Information: details of the Oracle VDI VirtualBox hypervisor's hardware configuration
- Machine States
Refer to the functional description of the Machine States panel in Section 3.2.1.
The chart applies to all virtual machines on the selected VirtualBox hypervisor.
- System Utilization
Refer to the functional description of the System Utilization panel in Section 3.2.1.
The chart indicates system load on the selected VirtualBox hypervisor.
- File System Utilization
Refer to the functional description of the File System Utilization panel in Section 3.2.1.
The chart applies to the selected VirtualBox hypervisor's file system.
- Incidents and Problems
Refer to the functional description of the Incidents and Problems panel in Section 3.2.1.
The table shows incidents and problems for the selected VirtualBox hypervisor.
An Oracle VDI VirtualBox desktop provider has a separate child monitoring target for its storage. Storage targets are created for all Oracle VDI storage types, including local storage on the VirtualBox hypervisor. The Oracle VDI storage target page provides a detailed view on the configuration details and monitoring data of the individual Oracle VDI storage. Cumulated data from all storages that belong to the VirtualBox desktop provider is displayed on the parent target page.
Target Page Information
This target page provides the following resource details and monitoring data:
- Summary
The Summary section for an Oracle VDI storage target is subdivided as follows:
General Information: the host name, storage type, repository and the number of desktops it offers storage to
Tools: a link to the administration tool for the Oracle VDI Center
System Information: details of the storage host's hardware configuration
- File System Usage
Current information on the available disk space is presented on a horizontal bar with a percentage scale. The amount of free and used space in gigabytes is shown in brackets in the legend. The chart applies to all virtual machines associated to which the selected storage host provides disk capacity.
- System Utilization
Refer to the functional description of the System Utilization panel in Section 3.2.1.
The chart is displayed only for Sun ZFS storages with 2009.09 firmware or later (AMBER_COMSTAR_Q3 subtype), and indicates system load on the selected Oracle VDI storage host.
- File System Utilization
Refer to the functional description of the File System Utilization panel in Section 3.2.1.
The chart is displayed only for Sun ZFS storages with 2009.09 firmware or later (AMBER_COMSTAR_Q3 subtype), and applies to the selected storage host's file system.
- Incidents and Problems
Refer to the functional description of the Incidents and Problems panel in Section 3.2.1.
The table shows incidents and problems for the selected Oracle VDI storage.
The Enterprise Manager Plug-in for Oracle VDI does not create new target pages for desktop provider types other than Oracle VDI VirtualBox. However, these other desktop provider types do appear in the Target Navigation pane as child targets of the Oracle VDI Center, and there is monitoring data available for each of them, as collected and presented by Oracle Enterprise Manager.
As a minimum, these target pages display the overall status of the desktop provider, along with a table of incidents and problems. The monitoring targets that are presented this way are:
Microsoft Hyper-V desktop provider
VMware vCenter desktop provider
Microsoft Remote Desktop Services provider
Sun Ray Kiosk desktop provider
Generic desktop provider