Release 11g (11.1.1)
Part Number E13881-02
Contents
Previous
Next
| Oracle Fusion Middleware Report Designer's Guide for Oracle Business Intelligence Publisher Release 11g (11.1.1) Part Number E13881-02 | Contents | Previous | Next |
| View PDF |
This chapter covers the following topics:
BI Publisher's support for Flash templates enables you to develop Adobe Flex templates that can be applied to BI Publisher reports to generate interactive Flash output documents.
Note: Adobe Flex is an open-source technology for building interactive cross-platform applications. Flex applications can be delivered using Adobe Flash Player. For more information see the Flex Web site at http://www.flex.org.
BI Publisher's integration with Flex enables you to build Flex templates, test them on your desktop, and deploy them to the BI Publisher server to generate Flash output. Users are then able to run the reports from the BI Publisher user interface or schedule them for delivery to report consumers.
This chapter will describe how to set up a Flex template with a BI Publisher "flat" data source (that is, there is no hierarchy in the XML data) and how to include simpler objects such as tables and charts. For more information about interactivity, connectivity between components and more advanced topics, refer to Adobe's Flex documentation.
Following are the prerequisites for building and viewing Flash templates:
For viewing output:
To view the report output from the Flash Template, you must have Adobe Flash Player 9 installed on your computer. If viewing reports over the BI Publisher user interface, your Web browser must also support the Adobe Flash Player 9 plug-in.
For building templates:
The FlexBuilder IDE from Adobe
Oracle BI Publisher is currently certified with version 2.0.1. The tool can be downloaded and purchased from the Adobe Web site at http://www.adobe.com/products/flex/.
Note that the charting functionality requires an additional license fee.
A report data model set up in BI Publisher that generates flat XML. For information on setting up your data model, see Defining the Data Model, Oracle Fusion Middleware Data Modeling Guide for Oracle Business Intelligence Publisher.
Tightened security settings in the latest versions of Adobe Reader (9.3) disable multimedia content like Flash by default. Because of this change, when accessing PDF report output that contains embedded Flash objects, users might get an error message such as "Some features are disabled to avoid potential security risks."
To enable Flash content in PDF output modify the Flash configuration settings as follows:
In Adobe Acrobat, on the Edit menu, click Preferences.
In the Preferences dialog, from the Categories list, click Multimedia Trust (legacy).
Select Display Permissions for: Other Documents.
Select "Permissions for Adobe Flash Player is set to Prompt".
Set "Change permission for selected multimedia player to" to "Always", then select all three check boxes below and click OK.
This section describes how to build a Flash template and includes the following topics:
Adding the Data Source
Creating the Layout
Data Binding
To add the data source:
Generate a sample data file from your report data model as follows:
From the Data Model Editor, select the Get XML Output toolbar button. From the Report Viewer, select the number of rows to return and then click Run. From the Actions toolbar list, select Export XML and save the results as an XML file to a local directory.
This example is based on the following data:
<ROWSET>
<ROW>
<NAME>Neena Kochhar</NAME>
<FIRST_NAME>Neena</FIRST_NAME>
<LAST_NAME>Kochhar</LAST_NAME>
<SALARY>17000</SALARY>
<ANNUAL_SALARY>204000</ANNUAL_SALARY>
<FED_WITHHELD>57120</FED_WITHHELD>
<JOB_TITLE>Administration Vice President</JOB_TITLE>
<DEPARTMENT_NAME>Executive</DEPARTMENT_NAME>
<MANAGER>Steven King</MANAGER>
</ROW>
<ROW>
...
</ROWSET>
This data is generated from the following simple query-based report:
select
e.first_name || ' ' || e.last_name name,
e.first_name,
e.last_name,
e.salary,
e.salary*12 ANNUAL_SALARY,
e.salary*12*0.28 FED_WITHHELD,
j.job_title,
d.department_name,
m.first_name || ' ' || m.last_name manager
from employees e,
employees m,
departments d,
jobs j
where e.department_id = d.department_id
and j.job_id = e.job_id
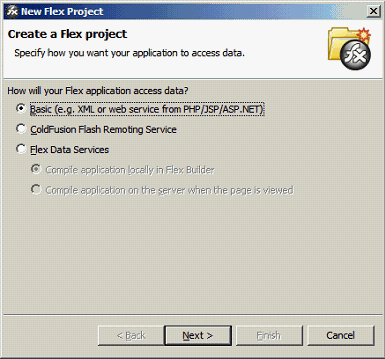
and e.manager_id = m.employee_idOpen the Flex IDE and create a new Flex Project; select the "Basic" data access method, as shown in the following example.
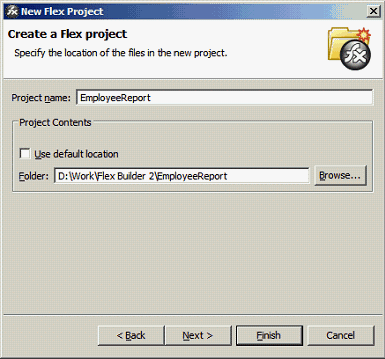
In the next dialog, give the project a name as shown in the following example. The name you use here will be assigned to the template file name you are going to create.
Click Finish.
The IDE creates the Flex template definition file, which is an MXML file. An MXML file is an XML format. Following is a sample:
<?xml version="1.0" encoding="utf-8"?>
<mx:Application xmlns:mx="http://www.adobe.com/2006/mxml" layout="absolute">
</mx:Application>
You can now update it manually or by using the visual builder.
Connect the XML you downloaded from your report data model:
To connect the data, use the XML data services that Flex supports and embed the sample data into the MXML file.
The sample MXML file with the connected data is shown. See the following section for a description of the file components.
<?xml version="1.0" encoding="utf-8"?>
<mx:Application xmlns:mx="http://www.adobe.com/2006/mxml" layout="absolute">
 <mx:Script>
   <![CDATA[
      [Bindable]
      public var dataXML:XML =
<ROWSET>
<ROW>
<NAME>Neena Kochhar</NAME>
<FIRST_NAME>Neena</FIRST_NAME>
<LAST_NAME>Kochhar</LAST_NAME>
<SALARY>17000</SALARY>
<ANNUAL_SALARY>204000</ANNUAL_SALARY>
<FED_WITHHELD>57120</FED_WITHHELD>
<JOB_TITLE>Administration Vice President</JOB_TITLE>
<DEPARTMENT_NAME>Executive</DEPARTMENT_NAME>
<MANAGER>Steven King</MANAGER>
</ROW>
<ROW>
...
</ROWSET>;
        ]]>
 </mx:Script>
</mx:Application>
The XML portion should look familiar as the data you downloaded. The additional components to note are:
<mx:Script> — This denotes the start of the template scripting code. There is also a closing </mx:Script> statement.
[Bindable] — This denotes that the following variable is bindable to a layout component.
public var dataXML:XML — This is the data variable declaration:
public — The value of the variable is available to the whole template.
var — Declares there is a variable in the report.
dataXML — The name of the variable. Note this is a compulsory name. You must use this name to use the template with BI Publisher.
:XML — Declares that the variable is an XML type.
; — Notice the semicolon after the end of the XML data you provided.
At runtime the BI Publisher server will generate the runtime data from the report and inject it into the Flex template replacing the sample data held within the dataXML variable. This feature allows the Flex report to be distributed to users without needing to connect to the server.
The Flex IDE creates a default canvas for you to drop objects onto. You can modify the canvas as required to suit your report.
Important: If you intend to embed the Flash output in a PDF document, you must set the Width and Height of the template in the Size region of the Layout properties. Even if you wish to accept the default size, you must explicitly enter values in these fields.
Create the layout by adding report objects to the layout palette. This example uses the Flex Design tab to add the objects to the layout. Click the Design tab to see the available objects in the Component Navigator pane.
The following figure shows an example of the available objects in the Component Navigator pane:
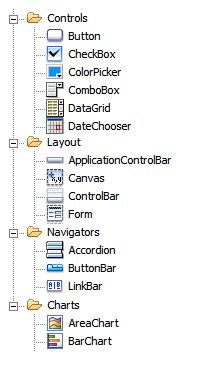
These objects can be dragged and dropped to the design palette.
Start by dragging a Panel object from under the Layout node to the design palette. Notice as you drag the panel around the edge of the palette, the guidelines are displayed in blue. Use these guides to aid you in aligning objects.
Drop the panel onto the top left hand corner of the palette.
Now drag the bottom right edge of the panel across to the right hand side of the palette.
Then drag it down to about half the height of the palette. Alternatively, use the property palette on the right hand side to set the size of the panel.
Now select a Datagrid object. This is the object to render the data in a tabular format. Drop it onto the panel you created in Step 1. The Datagrid is now a child of the panel; you can resize it as needed. The end result is shown in the following figure:
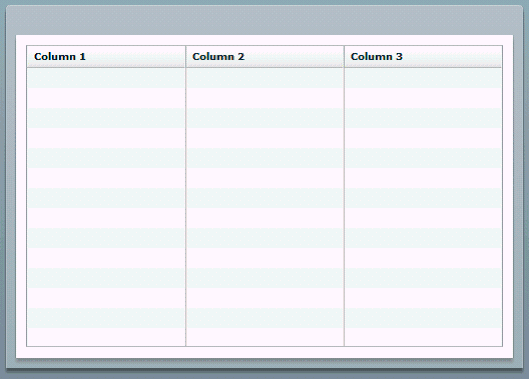
By default three columns are generated. In the next section, Binding the Layout Objects to the Data Source, you will override the default in the MXML code.
If you have purchased the charting option you can add charts to your layout.
First make some room for the chart in your layout. Highlight the Datagrid object and pull the top edge down to about half the height of the hosting panel.
For this example, select and drag a Column Chart from the design palette and drop it onto the hosting panel. Use the guidelines to align it.
Once you drop it, notice that the default size overlaps the Datagrid and that the chart legend is in the top left-hand corner. Resize the chart and move the legend to the right to look similar to the following figure:
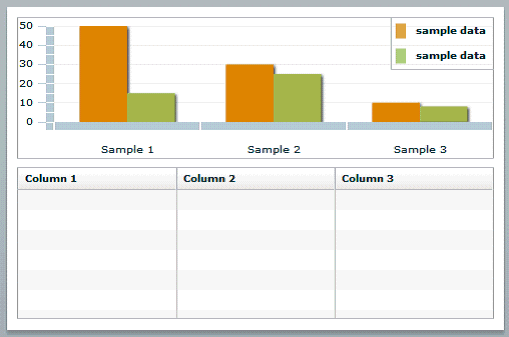
This is a sample chart. You will bind it to the data in the next section.
Now that the layout is complete, bind the layout objects to the data source. Flex offers some help through the property palette of the objects to define the binding, but not enough to complete the task. Therefore you must update the MXML directly using the Source editor.
To bind the DataGrid:
Start by highlighting the DataGrid in the design palette, and then click the Source tab to display the MXML source. You will see that the first line of the DataGrid code has been highlighted for you. This is a useful feature if you have built complex Flex templates and need to locate the code easily.
The DataGrid code is as follows:
<mx:DataGrid x="10" y="160" width="476" height="152">
   <mx:columns>
      <mx:DataGridColumn headerText="Column 1" dataField="col1"/>
      <mx:DataGridColumn headerText="Column 2" dataField="col2"/>
      <mx:DataGridColumn headerText="Column 3" dataField="col3"/>
   </mx:columns>
</mx:DataGrid>
Notice that the code defines the relative x,y position of the grid within its parent container and its width and height. The next element defines the columns with attributes for the header label and the data fields.
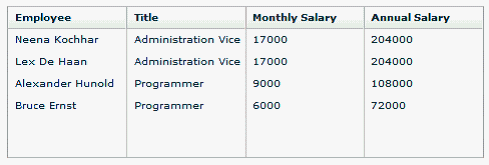
The goal is to achieve a table that looks like the following figure:
Make the DataGrid aware of the data source by adding an attribute to the <mx:DataGrid> element as follows:
dataProvider="{dataXML.ROW}"This attribute defines the data object to be used at runtime to populate the grid. Remember that in this example, the XML data variable was defined as "dataXML"; now use that definition followed by "ROW" (that is, dataXML.ROW). ROW is the repeating group in the data set. Note that the syntax requires the curly braces to let the Flex engine know it is a data source.
Bind the columns. In the basic structure provided, replace the values for dataField with the appropriate element name from your data source. Also replace headerText values with the desired column heading names. For example, for the first column, replace
<mx:DataGridColumn headerText="Column 1" dataField="col1"/>
with
<mx:DataGridColumn headerText="Employee" dataField="NAME" />
This defines the first column header name as "Employee" and binds the column data to the "NAME" element in the XML data source.
The completed DataGrid sample code follows:
<mx:DataGrid x="10" y="160" width="476" height="152" dataProvider="{dataXML.ROW}">
  <mx:columns>
    <mx:DataGridColumn headerText="Employee" dataField="NAME" />
    <mx:DataGridColumn headerText="Title" dataField="JOB_TITLE"/>
    <mx:DataGridColumn headerText="Monthly Salary" dataField="SALARY"/>
    <mx:DataGridColumn headerText="Annual Salary" dataField="ANNUAL_SALARY"/>
  </mx:columns>
</mx:DataGrid>
You can now preview the template with your sample data. Select Run, then Run EmployeeReport. This will open a new browser window and render the table with your sample data.
To bind the chart:
From the Design tab, highlight the chart. Next, switch back to the Source view to find the chart code:
<mx:ColumnChart x="10" y="10" id="columnchart1" width="476" height="142">
  <mx:series>
    <mx:ColumnSeries displayName="Series 1" yField=""/>
  </mx:series>
</mx:ColumnChart>
<mx:Legend dataProvider="{columnchart1}" x="383" y="10"/>
To bind the data source to the chart object, add the dataProvider attribute to the <mx:ColumnChart> element as follows:
dataProvider="{dataXML.ROW}"Next add in the binding for the horizontal axis and the column series. Refer to the Flex help files for more details.
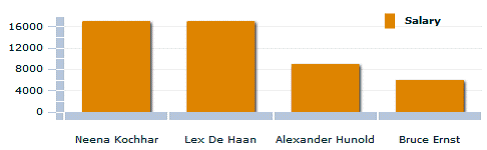
To create a chart showing salary by employee, similar to the following example:
make the following updates to the code:
Add a <horizontalAxis> element to define the element from the data source that will be used for the horizontal axis of the chart. Use the categoryField attribute to assign the data element value. In this example, the data element NAME is assigned.
Modify the <series> group to bind the SALARY value to each employee NAME to create a bar for each employee.
Following is the sample code:
<mx:ColumnChart x="10" y="10" id="columnchart1" width="476" height="142" dataProvider="{dataXML.ROW}">
   <mx:horizontalAxis>
     <mx:CategoryAxis  categoryField="NAME" />
   </mx:horizontalAxis>
   <mx:series >
     <mx:ColumnSeries xField="NAME"  yField="SALARY" displayName="Salary"/>
   </mx:series>
</mx:ColumnChart>
<mx:Legend dataProvider="{columnchart1}" x="383" y="10"/>
Note in the preceding sample, the <mx:horizontalAxis> element has been added and the categoryField attribute has the NAME data element assigned. This element is required to render the chart.
The <mx:series> element has been updated binding the SALARY value to each employee NAME to create a bar for each employee.
You do not need to update the legend code. Notice the id attribute of the <mx:ColumnChart> element matches the dataProvider attribute value of the <mx:Legend> element.
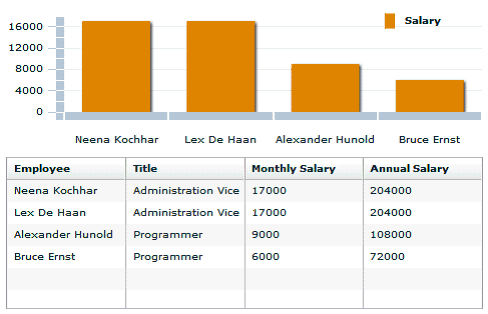
You can now run the template using your sample data. You should get an output showing the chart above the tabulated data as shown in the following figure:
To upload the template to your report definition:
Navigate to your report in the catalog. Click Edit to launch the Report Editor.
Click Add New Layout.
Under Upload or Generate New Layout, click Upload.
In the Upload Template File dialog:
Enter a Layout Name.
Click Browse and navigate to the Flex project directory. Under this directory open the bin directory and select the EmployeeReport.swf file.
From the Template Type list, select Flash Template.
Select the Locale for this template.
Click Upload to add the Flash template to the available layouts for the report.
The Report Properties page includes a set of properties specific to rendering Flash templates. These properties enable you to specify the size and placement of the Flash object when you select PDF as the output type.
Important: To produce PDF output you must specify the height and width of the template in the Flex Builder. See Creating the Layout.
To set properties for the PDF output:
Navigate to your report in the catalog. Click Edit to launch the Report Editor..
In the Report Editor, click Properties to open the Report Properties dialog.
Click the Formatting tab and scroll down to the set of properties under the Flash heading.
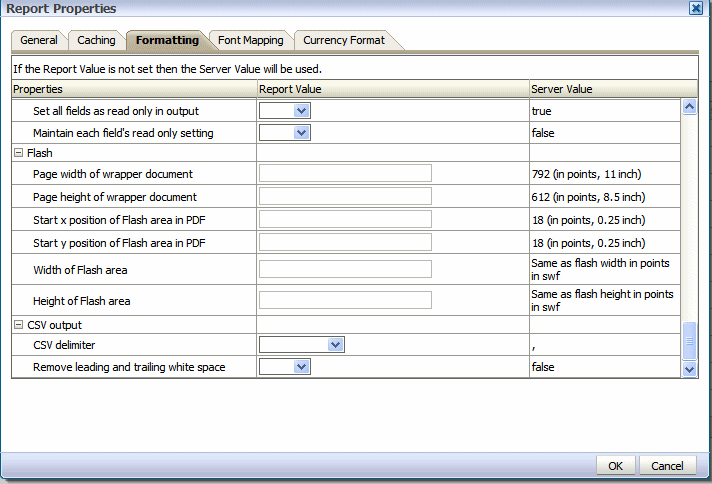
Enter values for the properties. Note that no properties are required. If you do not enter any values, the default values assume an 11 inch by 8.5 inch document (standard landscape), with a quarter inch inset from the upper left corner of the page as the insertion point of the Flash object. The default area in the document will be the size of the SWF object.
Page width of wrapper document – specify in points the width of the output PDF document. The default is 792, or 11 inches.
Page height of wrapper document – specify in points the height of the output PDF document. The default is 612, or 8.5 inches.
Start x position of Flash area in PDF – using the left edge of the document as the 0 axis point, specify in points the beginning horizontal position of the Flash object in the PDF document. The default is 18, or .25 inch.
Start y position of Flash area in PDF – using the upper left corner of the document as the 0 axis point, specify in points the beginning vertical position of the Flash object in the PDF document. The default is 18, or .25 inch.
Width of Flash area – enter in points the width of the area in the document for the Flash object to occupy. The default is the width of the SWF object.
Height of Flash area – enter in points the height of the area in the document for the Flash object to occupy. The default is the height of the SWF object.
This chapter demonstrated how to build a simple Flex template, but Adobe Flex allows you to build far more complex interactive reports for your users. The animation, "wiring" together and formatting of layout objects can be achieved with Flex. You can also summarize and create calculated fields on the incoming data. Please reference the Flex documentation for these more advanced features.
![]()
Copyright © 2010, 2011, Oracle and/or its affiliates. All rights reserved.