20 Review Inventory Analysis Reports
This chapter contains these topics:
Inventory analysis reports provide the following information about items in your inventory:
-
Which items are in the greatest demand
-
Differences in transaction costs versus current costs
-
Profitability
-
Value
-
Turnover
-
Supply and demand
-
Tag information for each item
20.1 Reviewing the ABC Analysis Report
From Inventory Management (G41), choose Inventory Reports
From InventoryReports (G41111), choose ABC Analysis
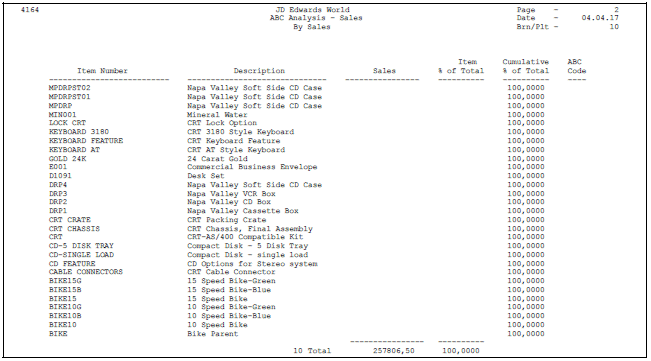
The ABC Analysis report is based on the principle that a small number of items will account for the largest part of a company's business. A slightly larger number of items will account for a smaller, but significant amount of business. The remaining large number of items, taken together, will account for only a small amount of business.
You can generate an ABC Analysis report based on an item's total sales, gross margin, or on-hand value. The ABC analysis report ranks inventory items with a letter grade of A, B, or C (where A represents the items with highest total sales, largest gross margin, or largest on-hand value). You can also use different ranking percentages in each category. For example, the system could rank Item A based on percentage of sales and Item C based on gross margin. The information that the ABC Analysis report provides helps you to determine which items control your inventory costs and profits.
You can use the ABC Analysis as the basis for inventory cycle counts (in which A items are counted more often than C items).
You can run this report in proof or final mode, based on how you set up the processing options. The first time you run the ABC Analysis report, you should run it in proof mode. Proof mode allows you to review the information without updating the item master and branch/plant records with the new ABC ratings.
Determine the natural breaks in your inventory item listing to determine where to set the percentage breaks in the branch/plant constants.
20.1.1 Before You Begin
-
Set up the ABC code percentage breaks on Branch/Plant Constants.
-
If you plan to run the sales version or the gross margin version of the ABC Analysis report, verify that you have set the processing options for the Sales Update program so that the system updates the Item History table (F4115).
-
If you decide to include forecasted records in the ABC calculations, you must first run DRP (Distribution Requirements Planning).
-
Determine which inventory items to exclude from the ABC analysis rankings. To exclude an item when you run this report, you must set the code on Branch/Plant Information to bypass the item. See Section 3.2, "Entering Basic Item Information" for information on the ABC codes.
20.2 Reviewing the Cost Analysis Report
From Inventory Management (G41), choose Inventory Reports
From Inventory Reports (G41111), choose Cost Analysis
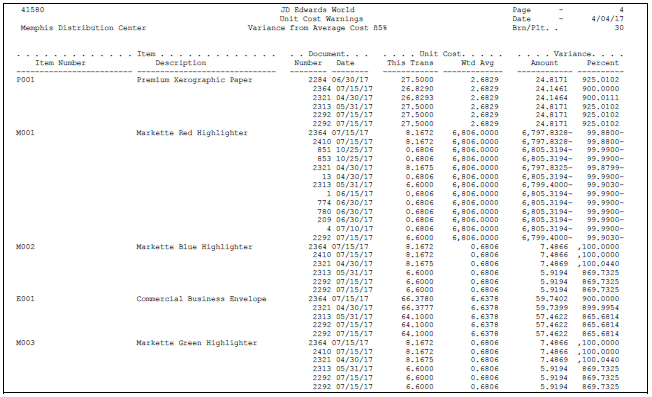
Cost Analysis is a DREAM Writer report that lists items with a transaction cost that is different from the current average cost that you specified in the processing options.
JD Edwards World recommends that you print this report at least once a month so that you are aware of transactions that vary significantly in costs from the average cost per item.
The Cost Analysis report retrieves records from the Item Ledger (F4111) and Item Cost Information (F4105) tables.
20.3 Reviewing the Margin Analysis Report
From Inventory Management (G41), choose Inventory Reports
From Inventory Reports (G41111), choose Margin Analysis
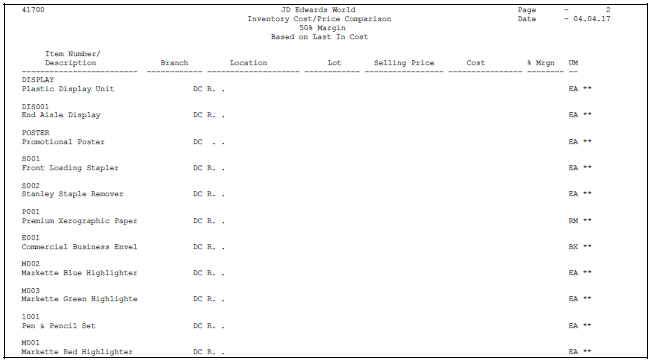
Margin Analysis is a DREAM Writer report that you use to identify profit margin based on current information. This report allows you to periodically analyze your cost and price values. It also identifies margin exception items.
The Margin Analysis report retrieves records from the Item Cost Information (F4105) and the Item Pricing Information (F4106) tables.
The two asterisks (**) next to the unit of measure indicate that the margin percentage does not meet the minimum margin that you specified in the processing options.
20.4 Reviewing the Valuation Analysis Report
From Inventory Management (G41), choose Inventory Reports
From Inventory Reports (G41111), choose Valuation Analysis
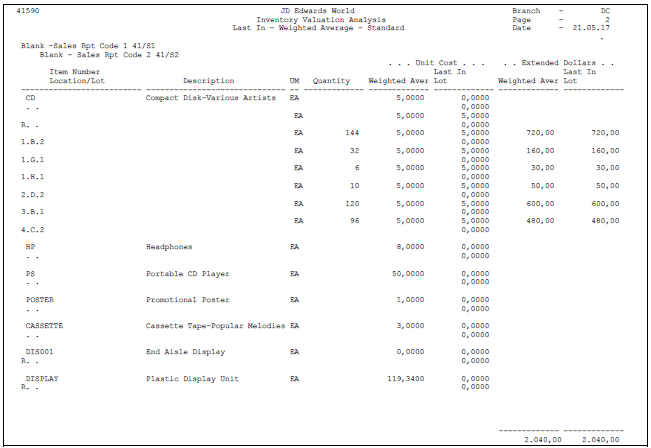
Valuation Analysis is a DREAM Writer report that you use to review the extended value of on-hand inventory, based on the following cost bases:
-
Weighted average unit cost
-
Last-in unit cost
-
Lot cost (associated with each storage area for an item)
You can compare these costs to your inventory account or the inventory accounts in your general ledger.
You can create a version of this report using the G/L class code to produce totals that correspond directly to the accounts in your general ledger.
You must use the following data sequence:
-
Warehouse
-
Sales reporting code 1
-
Sales reporting code 2
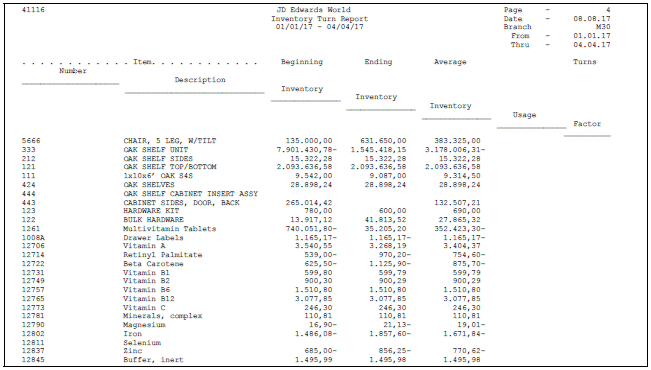
20.5 Reviewing the Inventory Turn Report
Inventory Turn is a report that you use to analyze the following:
-
Trends in your inventory environment
-
Inventory turnover in amount
To review Inventory Turn, you must complete the following tasks:
-
Group transaction types
-
Run the Inventory Turn report
20.5.2 Grouping Transaction Types
From Inventory Management (G41), choose Inventory Reports
From Inventory Reports (G41111), choose Transaction Family Documents
Before you run the Inventory Turn report, you must group your transaction types by document codes.
For example, you can group the transaction codes for inventory adjustments (IA), inventory issues (II), and inventory transfers (IT) into a transaction type for inventory transactions (I). You can then run the Inventory Turn report using "I" as a transaction family document type in the processing options.
On Transaction Family Documents
Figure 20-5 Transaction Familiy Documents screen

Description of "Figure 20-5 Transaction Familiy Documents screen"
Complete the following fields:
-
Transaction Type
-
Document Type
| Field | Explanation |
|---|---|
| Transaction Type | This field is used to locate different document transaction types such as I for Inventory Transaction documents, O for Purchase Order documents, and S for Sales Order documents. |
| Document Type | A user-defined code (system 00/type DT) that identifies the origin and purpose of the transaction.
JD Edwards World reserves several prefixes for document types, such as vouchers, invoices, receipts, and timesheets. The reserved document type prefixes for codes are: P – Accounts payable documents R – Accounts receivable documents T – Payroll documents I – Inventory documents O – Order processing documents J – General ledger/joint interest billing documents The system creates offsetting entries as appropriate for these document types when you post batches. |
20.5.3 Running the Inventory Turn Report
From Inventory Management (G41), choose Inventory Reports
From Inventory Reports (G41111), choose Inventory Turn Report
You can print this report for a cost center, an item, and a date range combination that you specify.
The Inventory Turn report:
-
Retrieves records from the Item Ledger table (F4111)
-
Clears the existing workfile, rebuilds it, and accesses records to produce the report
You must use the following data sequence:
-
Transaction date
-
Branch/plant
-
Item number-short
20.5.4 What You Should Know About
| Topic | Distribution |
|---|---|
| Columnar information | The system calculates beginning, ending, and average inventory as follows:
|
20.6 Reviewing the Supply and Demand Report
From Inventory Management (G41), choose Inventory Reports
From Inventory Reports (G41111), choose Supply/Demand
Supply and Demand is a DREAM Writer report that provides information about an item's demand, supply, and available quantities. The report lists the following information:
-
Quantities on hand
-
Safety stock
-
Sales orders
-
Purchase orders
-
Forecasts
-
Work orders
You can print a report for supply and demand information using the following criteria:
-
Branch/plant
-
Item number
-
Date
20.6.1 Before You Begin
-
Ensure that you have correctly identified all sources of supply and demand and have specified all sources in the supply and demand inclusion rules.
-
Review the formulas for determining supply and demand and available to promise. See Chapter 14, "Review Supply and Demand Information" and Chapter 15, "Review Performance Information"
20.7 Printing Stock Tags
From Inventory Management (G41), choose Inventory Reports
From Inventory Reports (G41111), choose Stock Tags
You can print generic DREAM Writer stock tags for inventory in the warehouse. The stock tags include bar codes for the item, location, and lot.
20.7.1 Before You Begin
-
To print bar code information, verify that you have a printer capable of printing from an Intelligent Printer Data Stream (IPDS) device file.
-
Set the Intelligent Printer Y/N field on DREAM Writer Printer File Overrides to Y.
-
Ensure that you have not changed any printer file override information. Any changes to information such as report length or width might affect the appearance of the report.
