12.4 Viewing Performance in Fusion Middleware Control
Fusion Middleware Control provides various performance metrics for administrators.
The following sections provide more details:
12.4.1 Resulting Pages for Selected Nodes and Targets
Using Fusion Middleware Control, you can view performance metrics for live sessions in a variety of formats.
Fusion Middleware Control provides Administrators with:
-
A cluster-wide view of performance for Access Manager with Security Token Service
-
A per-server drill-down of key performance metrics
-
The ability to quickly add or remove performance metrics
Table 12-2 summarizes the pages for selected nodes and target instances.
Table 12-2 Resulting Pages for Selected Nodes and Targets
| Node | Target | Information Summary Page | Performance Overview | Performance Summary w/Metrics |
|---|---|---|---|---|
|
Application Deployment Internal Applications |
...AdminServer oamsso_logout(11.1.1.3.0) AdminServer oamsso_logout(11.1.1.3.0) oam_server |
Yes Yes Yes |
No No No |
Yes Yes Yes |
|
WebLogic Server domain |
oam_bd (Cluster name) AdminServer oam_server |
Yes Yes Yes |
No No No |
No Yes Yes |
|
Identity and Access |
OAM (Cluster) oam_server (Server) |
No No |
Yes Yes |
Yes Yes |
Note:
Security Token Service performance is included with relevant OAM Cluster and Server pages.
12.4.2 Performance Overview Pages in Fusion Middleware Control
The Fusion Middleware Control Performance Overview can be used to reflect WebLogic cluster information down to specific performance metrics for individual Cluster and Server targets.
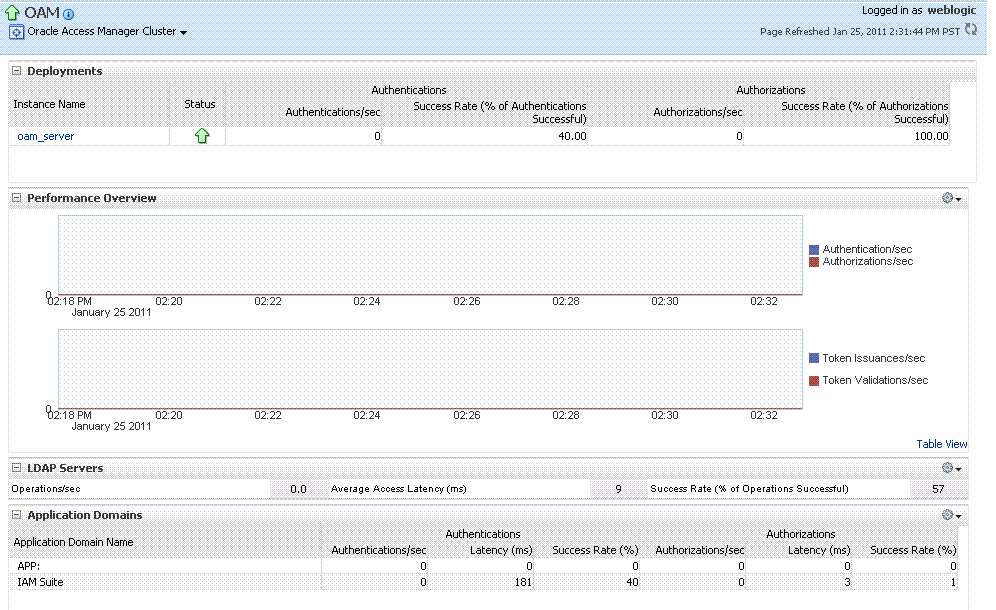
Cluster Page: The top node within Identity and Access leads to a page for the OAM Cluster Deployment, which includes a Performance Overview. For Figure 12-8, the Cluster is selected in the navigation tree, beneath the Identity and Access node. Figure 12-8 illustrates the Cluster Deployments and Performance Overview sections. This page includes a table for Token Issuance and Token Validations.
OAM Server Pages: Selecting an OAM Server target name from the navigation tree (or the open page), displays a Performance Overview for the target. At the top of the OAM Server page, a summary of Key Metrics for the server instances appears instead of the Cluster Deployment section. Figure 12-9 illustrates the OAM Server instance Key Metrics, which include Token Issuance and Token Validations per second. The Token Validation success rate is included.
Table 12-3 describes the elements of the Performance Overview for Clusters and OAM Server instances in Fusion Middleware Control. There are only a few differences.
Table 12-3 Summary of Performance Overviews in Fusion Middleware Control
| Section or Column Name | Description |
|---|---|
|
Cluster Menu |
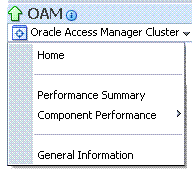
Dynamic context menus provide functions related to the selected target (also available when you right-click a target in the navigation tree). This menu is available for the selected Cluster. The Component Performance command enables you to choose between displaying Access Manager or Security Token Service metrics. See Also: "Access Manager Component Pages" and "Security Token Service Component Pages". |
|
Deployments, OAM Cluster pages |
This section appears only on OAM Cluster pages. It describes the status of each instance in the cluster. The following information is included:
|
|
Instance Name |
This column includes the name of each OAM Server instance in the cluster. For example: OAM_server_name |
|
Status |
This column identifies the status of each OAM Server instance in the cluster with either a:
|
|
Authentications |
Authentications columns identify:
|
|
Authorizations |
This column identifies the number of authorizations per second for each OAM Server instance in the cluster. Authorizations columns identify:
|
|
Server Instance Menu |
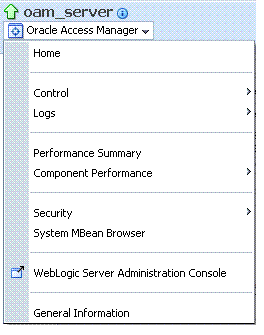
Dynamic context menus provide functions related to the selected target (also available when you right-click a target in the navigation tree). This menu is available for the selected server instance. The Component Performance command enables you to choose between displaying specific Access Manager or Security Token Service metrics. See Also: "Access Manager Component Pages" and "Security Token Service Component Pages". |
|
Key Metrics, OAM Server Page |
This table provides a summary of statistics for only the selected OAM Server instance. Key metrics include details for both Access Manager and Security Token Service:
|
|
Performance Overview, OAM Cluster and OAM Server Pages |
This section provides a graphic representations of Access Manager authentication and authorization operations and Security Token Service Token Issuance and Token Validation operations. Metrics in the Performance Overview are not configurable. The Metrics Palette is available for only the Performance Summary. Whether you have an OAM Cluster or OAM Server instance selected, the Performance Overview includes:
Within each table:
|
|
Table View |
Click the Table View link on the bottom-right side of the Performance Overview to display performance information in columns within a pop up window. |
|
LDAP Servers, OAM Cluster and OAM Server Pages |
This section is available when either an OAM Cluster or a single OAM Server instance is selected. It provides information for the default LDAP user identity store:
|
|
Application Domains, OAM Cluster and OAM Server Pages |
This section of the OAM Cluster and OAM Server pages provides information for all Application Domains that were used during authentication and authorization processing. Columns in this section provide the:
|
12.4.2.1 Access Manager Component Pages
The Component Performance command on both the Cluster and Server instance menus enables you to display Access Manager-specific metrics.
Cluster component-specific metrics are aggregated across the cluster, illustrated in Figure 12-10. Details follow in Table 12-4.
Figure 12-10 Aggregated Access Manager Component Metrics for the Cluster

Description of "Figure 12-10 Aggregated Access Manager Component Metrics for the Cluster"
Figure 12-11 illustrates the Access Manager component metrics for a single OAM Server instance.
Figure 12-11 Access Manager Component Metrics for a Single OAM Server Instance

Description of "Figure 12-11 Access Manager Component Metrics for a Single OAM Server Instance"
Table 12-4 describes the component-specific metrics for Access Manager.
Table 12-4 Access Manager Component Metrics
| Access Manager Metrics | Description |
|---|---|
|
Access Manager Clients |
Based on your selection (Cluster or Server instance), this page provides information for all active Access Clients in a cluster (or for the active Access Clients of an individual OAM Server). Details include:
|
|
Client ID |
Displays the name of the Agent, as defined in the Agent registration in the Oracle Access Management Console. For example: IAMSuiteAgent |
|
Type |
Displays the Agent. type For example: OAM Webgate |
|
Authentications |
Authentications columns identify:
|
|
Authorizations |
Authorizations columns identify:
|
12.4.2.2 Security Token Service Component Pages
The Component Performance command on both the Cluster and Server instance menus enables you to display Security Token Service component-specific metrics.
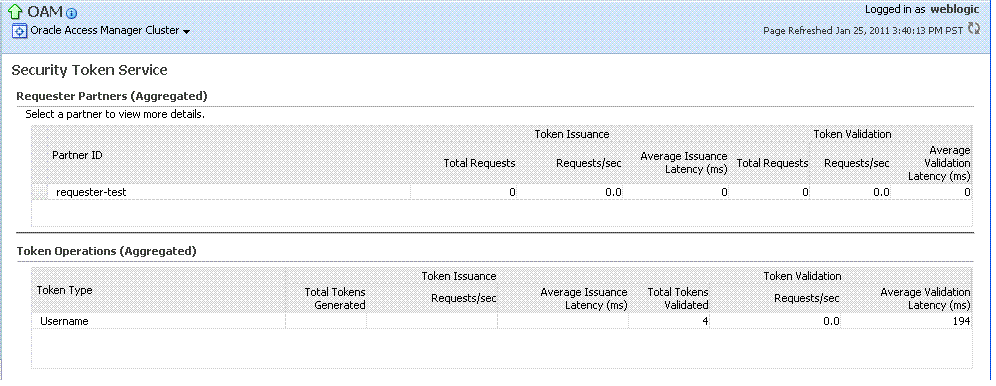
Component-specific metrics are aggregated for the Cluster, as illustrated in Figure 12-10.
Figure 12-12 Aggregated STS Component Metrics for the Cluster
Description of "Figure 12-12 Aggregated STS Component Metrics for the Cluster"
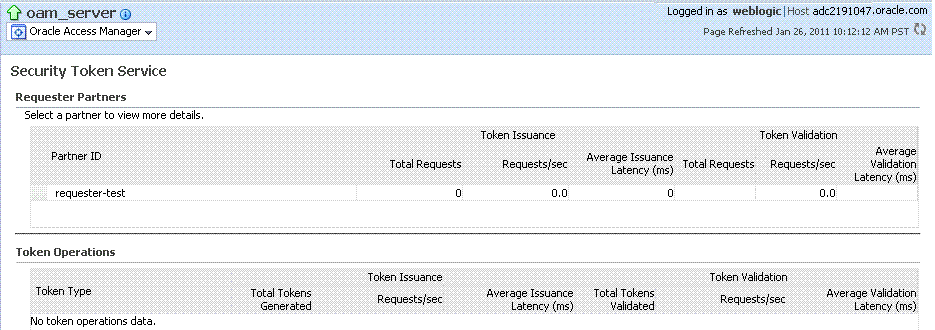
For each individual server instance, STS component-specific metrics are also available, as illustrated in Figure 12-10.
Figure 12-13 STS Component Metrics for an Individual OAM Server Instance
Description of "Figure 12-13 STS Component Metrics for an Individual OAM Server Instance"
Table 12-5 introduces the STS component specific metrics.
Table 12-5 STS Component-Specific Metrics
| Security Token Service Metrics | Description |
|---|---|
|
Requestor Partners |
Statistics summary for either the selected OAM Server instance (or an aggregated summary for the Cluster):
Selecting a Requestor Partner ID reveals Relying Party Details with specific information for only the named partner. |
|
Token Operations |
Metrics for STS Token Operations include:
|
12.4.3 Metrics Palette and the Performance Summary Page
The Performance Summary command on the Cluster or Server menu displays metrics charts for the selected target.
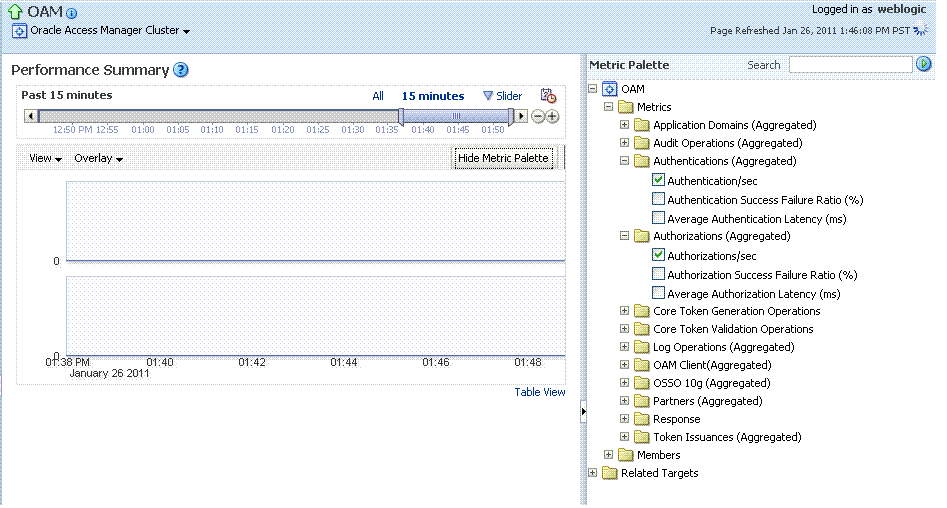
On the Performance Summary page, a chart is displayed for each selected metric. An OAM Server Performance Summary page. Figure 12-15 shows the Performance Summary page with an open Metric Palette from which you can choose metrics to chart. Stacked charts allow you to easily compare multiple metrics for the same time frame, change the time frame to go back in time, or zoom in or out.
Figure 12-15 Performance Summary Page with Metric Palette
Description of "Figure 12-15 Performance Summary Page with Metric Palette "
Table 12-6 describes the status and controls available on the Performance Summary page.
Table 12-6 Status and Controls on Performance Summary Pages
| Status or Control | Description |
|---|---|
|
Past n minutes |
Status is based on the specified time period, which can be adjusted using the slider. |
|
All |
|
|
n Minutes |
The specified time period, which can be adjusted using the slider. |
|
Slider |
The tool you use to adjust the time period. |
|
Chart Set |
A list from which you can choose the set of saved charts to view. |
|
View |
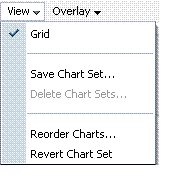
A menu that enables you to add a grid, save a chart, and order information on the page. |
|
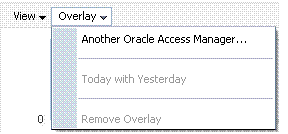
Overlay |
A menu that enables you to search for and view another instance of the same type and compare this against the instance in the summary. |
|
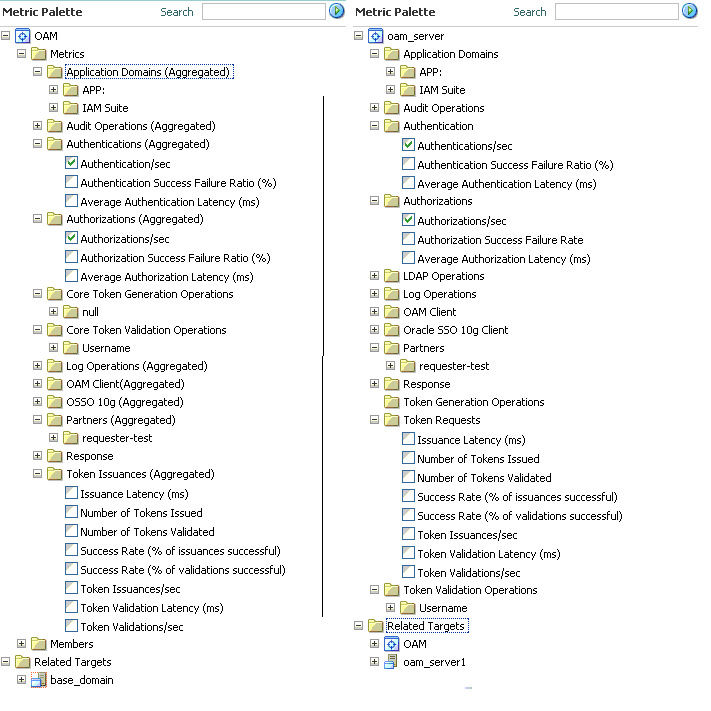
Metric Palette |
A listing from which you can select performance metrics to chart. Items unique to Access Manager and Security Token Service are shown here. Left: Metric Palette for the Cluster Right: Metric Palette for a Single OAM Server |
12.4.4 Displaying Performance Metrics in Fusion Middleware Control
Fusion Middleware Control Administrators can add or change the metrics that are displayed in the Performance Summary.
See Also:
-
Log in as described in "Logging In To Fusion Middleware Control".
-
Performance Overview:
-
Expand the desired node and select a target. For example: Identity and Access.
- Identity and Access
- oam_server
-
Review the Performance Overview.
-
-
Performance Summary:
-
Select a target (Step 1).
-
From the context menu, select Performance Summary.
-
Review the Summary Page.
-
-
Changing Metrics:
-
From the Performance Summary page (Step 2), click the Show Metrics Palette button.
-
From the Metrics Palette, expand nodes and check (or clear) boxes to add (or remove) metrics from the summary.
-
Review the updated the Summary page.
-
Click Hide Metrics Palette when you finish.
-
-
Saving a Chart Set:
-
From the View menu on the Performance Summary page, click Save Chart Set.
-
In the dialog box that appears, enter a unique name for this chart set and click OK when the operation is confirmed.
-
Click Hide Metrics Palette when you finish.
-
Review the updated information on the Summary Page.
-
-
Adding an Overlay, Access Manager:
-
From the Overlay menu on the Performance Summary page, click Another Oracle Access Manager.
-
In the Search and Select Targets dialog, enter the target name and host name, then click Go.
-
In the target results table, click the name of the desired target and then Select.
-
When finished viewing the overlay, click Remove Overlay from the Overlay menu.
-
-
Adding an Overlay, Today with Yesterday:
-
From the Overlay menu on the Performance Summary page, click Today with Yesterday.
-
When finished viewing the overlay, click Remove Overlay from the Overlay menu.
-
-
Testing:
-
Using the Access Tester, perform several authentication and authorization tests (see Validating Connectivity and Policies Using the Access Tester).
-
In Fusion Middleware Control, check performance metrics.
-
12.4.5 Displaying Component-Specific Performance Details
Fusion Middleware Control Administrators can use the following procedure to view and compare component-specific performance data.
-
Log in as described in "Logging In To Fusion Middleware Control".
-
Expand the desired node and select a target. For example:
- Identity and Access
- oam_server
-
From the context menu, select Component Performance.
-
Choose Access Manager (or Security Token Service).
-
STS Partner ID: Choose a Partner ID in the Security Token Service results table for more details, if needed.
-
Component Performance:
-
From the context menu, select Component Performance.
-
Choose either Access Manager (or Security Token Service).
-
Choose an item in the results table to get more details, if available.
-
-
Testing:
-
Using the Access Tester, perform several authentication and authorization tests (see Validating Connectivity and Policies Using the Access Tester).
-
In Fusion Middleware Control, check performance metrics.
-
