Hardware Monitoring
The Oracle Hardware Management Agents use Simple Network Management Protocol (SNMP) to monitor your Oracle hardware and storage devices. The software uses the Intelligent Platform Management Interface (IPMI) protocol to accesses the Oracle ILOM service processors.
A monitoring policy is a set of rules applied to an asset. If a status changes or a threshold is crossed, an alert is created. Oracle Enterprise Manager Ops Center provides default policies for each asset type. You can create new policies or modify existing policies.
Hardware Status
If a hardware asset can report a value for a hardware variable, Oracle Enterprise Manager Ops Center reports its current state and compares it to the threshold value.
-
Good – The hardware asset is working properly.
-
Unknown – Oracle Enterprise Manager Ops Center is unable to retrieve information from the sensor. The hardware asset is connected but is not reporting information.
-
Unreachable – The hardware asset cannot be contacted. This state indicates a network problem.
-
Warning Failure – Oracle Enterprise Manager Ops Center has detected a potential or impending fault condition. Take action to prevent the problem.
-
Critical Failure – A fault condition has occurred. Take corrective action.
-
Nonrecoverable Failure – The hardware asset has failed. Recovery is not possible.
-
Faulted – The hardware asset reports a fault. Contact service personnel to repair.
Groups of Hardware Assets
Oracle Enterprise Manager Ops Center monitors hardware assets according to the monitoring profile for that type of asset.
To see the default profile for monitoring a hardware type, see Hardware Monitoring.
Connectivity Status
You can view information about a hardware asset's Network Interface Card (NIC).
Connectivity is the network interface of the system.
Service Processor Details
Provides information about each component of the system.
Use the Hardware tab to view information about each component of the system:
-
Name and SNMP Community
-
Whether Auto DNS through DHCP is in use, and any DNS Servers
-
Search Path, if any
-
Time Zone
-
Whether an NTP server is in use an its identifier
RAID Controller Details
Lists the RAID Controller details.
-
RAID volume name
-
RAID level
-
Number of disks
-
Stripe zone
-
RAID Controller ID
Oracle ZFS Storage Appliance Details
The Oracle ZFS Storage Appliance supports both file storage and application use.
The Dashboard tab reports the following hardware information:
-
Name
-
Description
-
Current Alert Status
-
Model
-
Serial Number
-
Management IP
-
Memory
-
Power
-
Locator Light
-
Appliance Kit Version
-
Running Time
-
Processor
The Hardware tab displays the appliance's firmware version and the following information for each component:
-
CPU: Name, Model, Architecture, Speed, Manufacturer
-
Memory: Name, Type, Size in bytes, Manufacturer, Part number, Serial number
-
Network Adapters: Name or each, MAC Address, Description, Manufacturer, Part number, Serial number
-
Disks: Name, Size in bytes, Manufacturer, Part number, Serial number
-
Power Supply: Name, Manufacturer, Part number, Serial Number
-
Fan Tray: Name, Manufacturer, Part number, Serial number
ALOM and ILOM Servers Details
Lists the general details displayed for the ALOM and ILOM servers.
This version of the product software discovers and manages servers that use the ALOM or ILOM service processors. The following are general details displayed for these servers.
For server hardware, the Summary tab displays:
-
Server Name
-
Description
-
Current Alert Status
-
Model
-
Serial Number
-
Management Interface IP
-
MAC Address
-
Processor
-
Memory
-
Power state
-
On – The server is powered on and running.
-
Standby – The server is powered off but responds to commands.
-
Unknown – An error occurred while attempting to retrieve the power status of the hardware. The server is connected but is not returning any information on power status.
-
Unreachable –The server cannot be contacted for information about its power state. This indicates a network problem or that the server is in standby mode.
-
-
Locator Lights state
-
A table with the available Tags
-
A table with the Firmware information
The Hardware Tab for ALOM servers display summary information and a table with all the firmware installed.
The Hardware Tab for ILOM servers include more information in the component navigation pane of the Hardware tab:
-
System: Description, type, and version of all firmware installed except for disk firmware. See the Disk tab for firmware version.
-
Processors or CPU: Architecture, number of Installed CPUs, Actual Power Consumption, Summary Description, number of Max CPUs, and Status. The Processors table displays for each CPU: Name, Model, Speed, Manufacturer, and Status.
-
Memory: number of Installed DIMMs, Installed Size in bytes, number of Max DIMMs, Status, and Actual Power Consumption. The Memory table displays for each DIMM: Name, Size in bytes, Manufacturer, Part number, Serial number, and Status is displayed on the Memory table.
-
Power or Power Supply: number of Installed Power Supplies, Actual Power Consumption in watts, Status, number of Max Power Supplies, and Max Permitted Power in watts. The Power Supplies table displays for each power supply: Name, Manufacturer, Part number, Serial number, and Status.
-
Cooling or Fan Tray: number of Installed Chassis Fans, number of Installed PSU Fans, Inlet Temperature, Status, number of Max Chassis Fans, number of Max PSU Fans, and Exhaust Temperature. The Fans table displays for each item: Name, RPM (%), and Status. Servers with older versions of ILOM list a Fan Tray group instead including the identifier of each available fan and its speed (RPM).
-
Storage or Disk: Installed Disk Size in bytes, number of Installed Disks, Status, Logical Volumes, and number of Max Disks. The Disks table displays for each item: Name, Presence Status, and Status.
-
Networking or Network Adapter: number of Installed Ethernet Nics, and Status. The Network Adapters table displays for each item: Name, MAC Address, Description, and Status.
-
PCI Devices: a table listing the PCI Devices. The table displays for each item: Name, Card Type, Description, Vendor ID, Device ID, and Part Number. This information is not available for servers with older versions of ILOM.
-
Service Processor: Name, Auto DNS Via DHCP, Search Path, Use NTP Server, NTP Server 2, SNMP Community, DNS Servers, Time Zone, and NTP Server 1. The Service Processor Snapshots displays for each item: Name, Creation Date, Description, and Created By.
M-Series Servers Details
The hardware resources in a SPARC Enterprise M-Series Server are divided into one or more logical units called dynamic system domains. Oracle Enterprise Manager Ops Center can monitor each domain, in addition to the server hardware.
For an M-Series server, the Dashboard tab displays the following:
-
Number of dynamic system domains it is supporting
-
Model
-
Serial Number
-
Description
-
Support contract
-
XCP Firmware Version
-
OBP Firmware Version
-
XSCF Firmware Version
-
Hypervisor Firmware Version
-
Operator Panel Switch Status: Locked
-
Current Alert Status
The Summary Tab adds details to the information in the Dashboard tab. For the Power status, the reported status is for the server's domains. When any domain is powered on, the status is reported as powered on. When all domains are powered off, the Summary tab shows a status of Powered Off; the M-Series server itself remains powered on.
You can find the following information on the Summary tab:
-
Name
-
Model
-
Serial Number
-
Management IP
-
MAC Address
-
Current Alert Status
-
Power
-
Locator Light
-
Notification
-
All firmware versions including Description, Type and Version.
-
The table Domain displays for each item: Name, Model, Health, Power, Locator Light, Notification
-
Model
-
Serial Number
-
State
-
Power
-
Locator Light
-
Notification
-
Operator Panel Switch State
The Hardware tab shows the state of the server or, if a Dynamic System Domain is selected, the state of that domain. At the System level, the Hardware tab includes the following information:
For the M-5000 server, the System level of the Hardware tab also includes:
-
The Unallocated Resources table lists all the physical system boards and their status: PSD ID, Assignment Status, Power Status, Connection Status, Diagnostics Status, and Operational Status
-
The Allocated Resources table lists all domains that are using the physical system boards and their status: Domain ID, PSB ID, XSB ID, LSB ID, Assignment Status, Power Status, Connection Status, Diagnostics Status, and Operational Status
-
The Dynamic System Domain table lists all the domains and their details: Domain ID, MAC Address, Autoboot Policy, Secure Mode Policy, CPU Mode, Diagnostics Level, Domain Degradation Policy, and Operational Status
For Oracle SPARC M5-32 and M6-32 servers, the System level of the Hardware tab also includes:
-
System Type
-
Part Number
-
System Identifier
-
Management IP
-
Management MAC Address
-
Actual Power Consumption
-
Status
-
Data Source
-
The Subsystem Status table displaying a summary including: name of Subsystem, Status, and Inventory.
-
The Configured Dynamic System Domains table listing all the domains and their details: Domain ID, Domain Name, Priv MAC address, Auto Boot Policy, ILOM IP, Keyswitch State, and Operational Status
-
The Unconfigured Dynamic System Domains table listing the same information as the table above except for Domain Name.
-
Allocated Resources. No data is displayed on this table.
-
Unallocated Resources. No data is displayed on this table.
-
The Firmware table displaying for each item: Description, Type, and Version.
Oracle SPARC M5-32 and M6-32 servers include an ILOM 3.2 service processor. For more information about ILOM servers see ALOM and ILOM Servers Details.
Note:
M5 and M6 servers are supported, but some features have additional limitations. For more information see the Target Servers section of the Certified Matrix document in the Oracle Enterprise Manager Ops Center document library.
Use the Component Navigation pane in the Hardware tab to view information about each component of the system:
-
CPU: Name, Architecture, Type, Manufacturer, Speed, Core Count, Thread Count, Serial Number, Part Number, Version, Status For Sensors: Name, Description, Type, and Value.
-
Memory: Name, Type, Size in bytes, Serial number, Part number, Status For Sensors: Name, Description, Type, and Value.
-
Board: Name, Serial number, Part number, Memory mirrored, Version, and Status.
-
Power Supply: Name, Serial number, Part Number, Status For Sensors: Name, Description, Type, and Value.
-
Board: Name, XSB Mode, Memory Mirrored, Serial Number, Part Number, Version, Status For Sensors: Name, Description, Type, and Value.
-
IO Unit: Name, Serial Number, Part Number Version, Status For Sensors: Name, Description, Type, and Value.
-
XSCF: Name, Host Name, Serial Number, Part Number, Version, and Status.
-
Fan Tray: Name, Manufacturer, Part number, and Serial number.
-
Fans: Name, Speed For Sensors: Name, Description, Type, and Value.
Oracle Enterprise Manager Ops Center monitors the voltage for the Board and IO Unit components and the speed for the Fan components. The Monitoring tab shows the actual value and the threshold values.
CPU Activation Keys for Fujitsu M10 Servers
Starting with Oracle Enterprise Manager Ops Center 12 c Release 3 (12.3.1.0.0), you can add CPU activation keys to Fujitsu M10 servers or you can move CPU activation keys from one Fujitsu M10 server to another Fujitsu M10 server. The CPU activation key is not limited to one machine, but the key is limited to the model of the M10 server, such as M10-1, M10-4, and M10-4S. For example, the CPU activation key from an M10-1 server can be moved to another M10-1 server, but not to M10-4 or M10-4S servers.
After CPU activation keys are added to Fujitsu M10 servers, some CPU resource based on the amount of the CPU Activation that is defined in the CPU activation keys, becomes assignable.
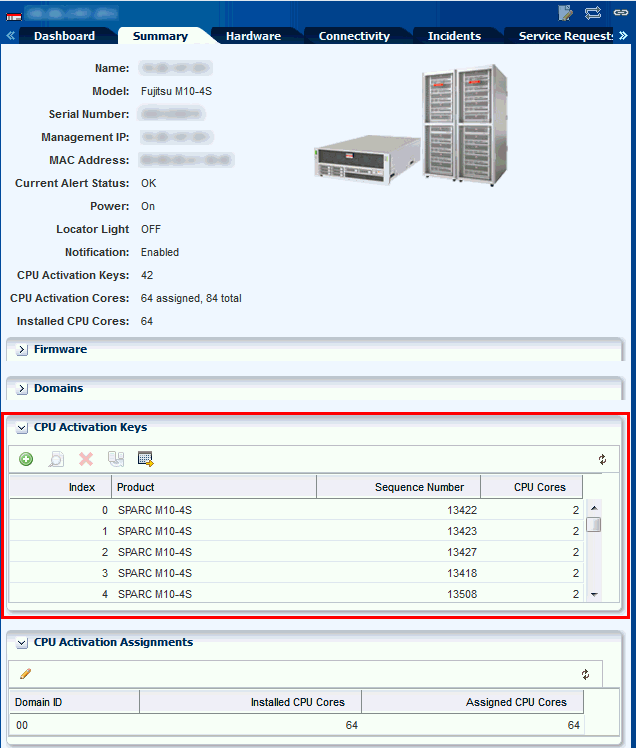
In the Summary tab of the M Series server, CPU Activation Keys section is displayed. The CPU Activation Keys section is displayed only for the Fujitsu M10 servers.
-
In the In the Navigation pane, under Assets, expand M-Series Servers, then click the server.

Description of the illustration GUID-CABEFD97-7FE1-46B2-BC74-01396CC8319C-default.gif -
In the center pane, click the Summarytab.
-
Scroll down to the CPU Activation Keys section.
-
Click the Add icon to add a CPU activation key.
-
In the Operation Type field, select Upload File option.
-
Click Browse to locate the activation key.
-
Click Add Key to add the key to the XSCF.
The following are other actions that you can perform:
-
Click the Search icon to view details of the selected CPU activation key.
-
Click the Delete icon to delete the selected CPU activation key from the XSCF.
-
Click the Move icon to move the selected CPU activation key to a different XSCF.
-
Click the History icon to view the CPU activation history.
CPU Activation Assignments on Fujitsu M10 servers
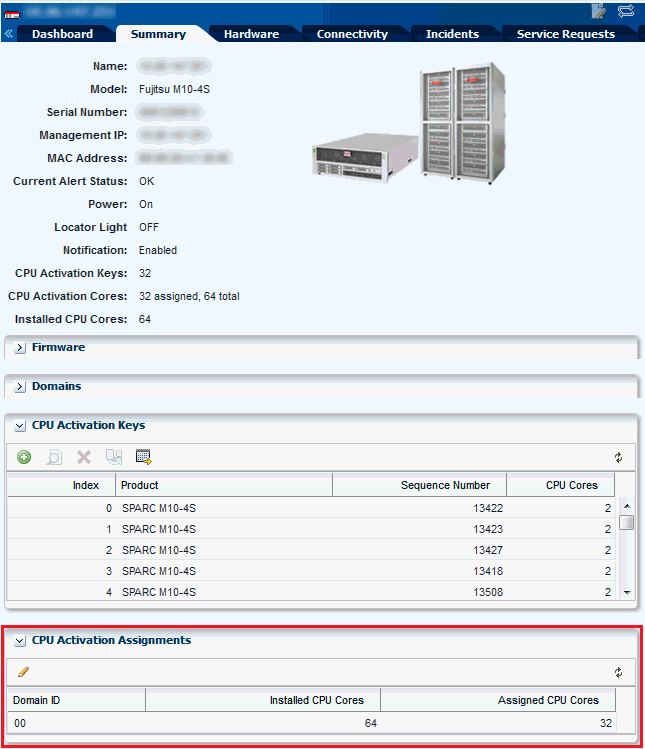
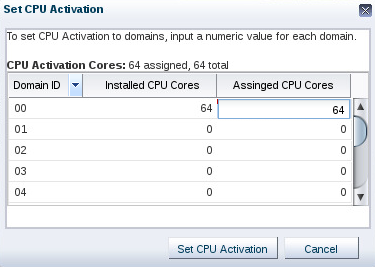
After you have added CPU activation keys to Fujitsu M10 servers, you can assign additional CPU resources to dynamic system domains.
In the Summary tab of the M Series server, the CPU Activation Assignment section is displayed. CPU Activation Assignments section is displayed only for the Fujitsu M10 servers.
To add additional CPU Cores, perform the following steps:
Switch Details
Oracle Enterprise Manager Ops Center can manage Sun Ethernet 10GbE Fabric switches and Sun Datacenter InfiniBand switches. These switches reside in the system or blade system and provide the switch fabric.
Cisco Catalyst switches are also supported.
For more information about Oracle Datacenter and Ethernet switches, see: http://www.oracle.com/technetwork/documentation/oracle-net-sec-hw-190016.html#legacysecapp.
Summary Tab: Oracle Enterprise Manager Ops Center reports hardware information on the Summary tab:
-
Name
-
Model
-
Port count
-
Serial number
-
Management Interface IP
-
MAC Address
-
Fabric Manager: true or false
-
Fabric Manager Address
-
Power state
-
Locator lights state
-
Notification state
-
Current Alert Status
-
Firmware types and versions
Hardware Tab: At the System level, the Hardware tab includes:
-
Model
-
Server Name
-
Serial Number
-
State
-
Power
-
Firmware versions
-
Sensors: temperature and voltage
You change the display to show information about each component of the switch:
-
Network Adaptors: Name or each, MAC Address, IP Address, Description
-
Power Supply: Name, Manufacturer, Part number, Serial Number For Sensors: Description, Type, Status
-
Fan Sensors: Description, Type, Value, Status, Warning Threshold (Lower), Warning Threshold (Upper), Critical Threshold (Lower), Critical Threshold (Upper), Non-Recoverable Threshold (Lower), Non-Recoverable Threshold (Upper)
The Actions pane displays the set of available actions to manage a switch. It includes the Launch Switch UI for accessing and managing the switch directly from its Web UI. For the Cisco Catalyst switch, the Launch Switch UI action will be disabled if the HTTP server is not enabled in the switch.
Rack Details
Displays the details of the rack.
The rack's Dashboard displays the following information:
-
Name
-
Rack ID
-
Description
-
Number of Slots
-
Tags
-
Support
The Details tab shows the configuration of each slot in the rack. For each component in the rack, this tab displays the position, name, description, type, model and health status. The Power Distribution Units are included and their current status is displayed.
The Firmware tab displays the name, description, and version of the firmware for each component and the slot for each component:
-
Compute Nodes
-
Switches
-
Storage Appliances
-
Power Distribution Units
The rack's Charts tab displays the following plots, as described in Charts Tab:
-
Aggregate Power Usage
-
Power Usage
-
Average Fan Speed
The rack's Energy tab displays the information described in Energy Tab.
PDU Details
Displays the PDU details.
The Dashboard tab shows:
-
Name and Description
-
Model and serial number
-
Management IP address and MAC address, if any
The Details tab reports the same information and adds whether SNMP and HTTP is enabled and the version of the firmware.
Oracle Solaris Cluster Details
The Dashboard, Network, and Quorum tabs display details of the Oracle Solaris Cluster.
The Dashboard tab shows:
-
Name, description, and ID
-
Number of possible quorum votes and the current quorum votes
The Network tab shows the public and private interconnects used by the cluster.
The Quorum tab shows the status of each member of the quorum and the number of quorum votes for each member.

