Introduction to Operating System Management
Oracle Enterprise Manager Ops Center provides comprehensive lifecycle management for Oracle Solaris and Linux operating systems in your datacenter. The software also enables you to patch, or update, Microsoft Windows operating systems.
The discovery feature makes adding operating systems and other assets quick and easy. After the operating systems are added, they are considered managed and you can begin using the monitoring, analytics, OS provisioning, and update features to gather information and perform tasks.
Your managed operating systems are visible in the All Assets section of the user interface. The operating system appears under the service processor and hardware, as shown in Figure 6-1.
Figure 6-1 Managed System and Operating System

Description of "Figure 6-1 Managed System and Operating System"
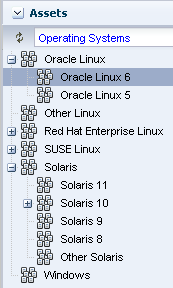
The operating system also appears in the appropriate platform-specific group in the Operating Systems view, as shown in Figure 6-2.
You can create user-defined groups and subgroups to refine your administration tasks. For example, you might want to create groups for Critical Systems, Training, Region 1 and Region 2. Groups are useful when you want to organize the systems to apply different monitoring standards, implement update requirements, or job scheduling times. You can create rules for your groups to automatically add existing and newly managed operating systems to the correct group or subgroup.
Two types of OS management are available: agent managed and agentlessly managed. In some cases, the features and actions that you can perform on an operating system are determined by the management type.
The following features are available for operating systems:
-
Monitoring: A series of monitoring rules and parameters monitor your managed assets. Alerts and incidents are raised for components that are not performing as expected.
-
Performance: Analytics provides you with a detailed view into OS performance.
-
System resource graphs, processes information, and a view of the top consumers
-
Resource usage of virtualized OS instances
-
-
Provisioning: Install Oracle Solaris or Linux operating systems onto your systems, making it easy to install one system or many servers simultaneously.
Note:
The Enterprise Controller must be installed on an Oracle Solaris operating system in order to perform the following tasks:
-
Provision Oracle Solaris 10 using JET customization.
-
Provision Oracle Solaris 11 (requires that both the Enterprise Controller and Proxy Controller are running on an Oracle Solaris 11 operating system.
-
Provision Oracle VM Server for SPARC (control domain).
-
-
Manage Oracle Solaris Boot Environments: Create and manage Oracle Solaris boot environments in a repeatable and consistent manner from a single user console.
-
OS Updates: Apply update packages to keep your operating systems up-to-date. See Update Operating Systems for information.
-
Reports and Snapshots: A variety of reports are available for your operating systems. See Create Reports for OS reports. See Update Operating Systems for information on how to use the System Catalogs to maintain snapshots of your operating system.
The monitoring feature provides extensive monitoring capabilities that are enabled as soon as you begin managing an operating system. A series of three escalating status levels notifies you when something is not operating as expected. The first level is informational, then warning, and finally a critical status. A set of default monitoring attributes and alert triggers are included with the software. You can tune the monitoring thresholds and triggers to define what you want to generate an alert and when. You can create custom monitoring rule sets and alert parameters and apply the customized monitoring rules to a specific operating system, a group of homogeneous operating systems, or a group that you define, such as critical systems or regional systems.
The Analytics feature provides extensive information about a specific operating system in one location so that you can maximize performance and utilization. The Analytics information includes process details, defined monitoring thresholds for operating systems, metrics and historical information on the top consumers, and a extensive list of metrics data. The Summary contains details on the top five consumers for CPU, memory, network, and I/O utilization. Use the graphical representation to quickly view utilization trends and high resource consumers. You can drill down to get detailed utilization and process information, and kill a process that is consuming too many resources.
