32 Managing Networks
The following information is included:
32.1 Get Started with Managing Networks
Enterprise Manager discovers and manages targets that populate Layers 1, 2, and 3 of the Open Systems Interconnection (OSI) model, shown in Figure 32-1. In the OSI model, a layer supports the layer above it and is provisioned by the layer below it. Any faults in a layer affect the layer above it.
-
Layer 1: Fabric targets are in the physical layer of the OSI model, such as network switches.
-
Layer 2: Datalink targets are in the link layer of the model. For Ethernet fabrics, datalinks are VLAN IDs. For InfiniBand fabrics, datalinks are partition keys. This layer also includes combinations of links, such as link aggregations.
-
Layer 3: Network targets are in the network layer of the model, which are network interfaces plumbed as IP addresses and IPMP groups.
Network management includes all the activities for making network resources available to targets:
-
Discover fabrics and their datalinks and networks.
-
Collect metrics for layer-related configuration and performance.
-
Detect faults at each level.
-
View the topology, a graphic view of the relationships in the fabrics and networks.
32.2 Location of Network Information in the User Interface
Table 32-1 shows where to find information.
Table 32-1 Location of Network Information in the BUI
32.3 Actions for Network Management
You can perform the following actions, depending on the requirements.
-
Discover switches, and network-connected targets. When you discover a network-connected target such as a fabric, its datalinks and networks also become discovered assets.
-
View the configuration of fabrics, datalinks, and networks.
-
Diagnose problems using incidents and performance metrics.
-
Modify how the targets are monitored and how performance is measured.
32.4 View Topology
The topology shows the relationships among assets. The network topology consists of ports, datalinks, and network interfaces.
-
Select Targets and then All Targets.
-
For a fabric, select Ethernet/InfiniBand Fabric.
For a network switch, select Systems Infrastructure Switch.
For a network, select Systems Infrastructure Network.
-
Select one of the targets.
-
On the target's landing page, click the down arrow next the type of target to display a menu.
-
For a fabric, select Fabric Topology as shown in Figure 32-2.
Figure 32-2 Menu Selections for Topology
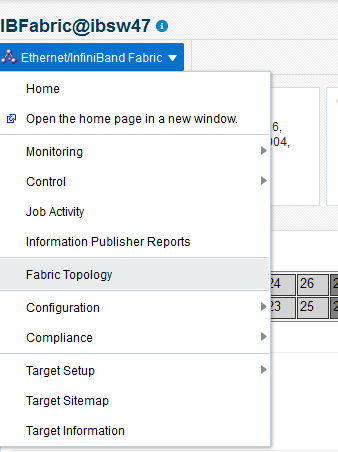
Description of ''Figure 32-2 Menu Selections for Topology''
-
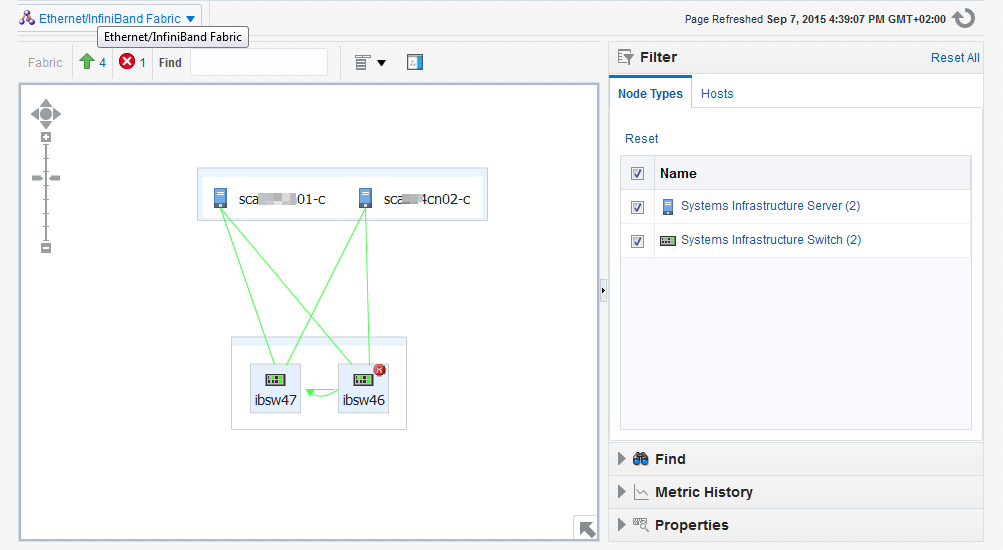
The Topology page shows the relationships of this target. You can adjust the display of the topology to learn more about the target. Figure 32-3 shows the assets that use the selected fabric because the Filter options include them.
-
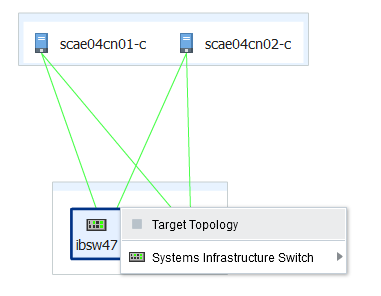
Hover on an object in the topology to display the asset's information. Figure 32-4 shows the result of hovering over a switch of a fabric.
-
To view a different target, click All Targets again and then click the Remove icon next to the target type to remove the filter.
32.5 Fabric
32.5.1 About Fabrics
A fabric represents the physical network targets including the connection between targets, that is, a port. For a switch, all ports support the fabric. For a network-enabled device such as a server or a storage appliance, its port is its connection to the fabric. As the physical layer of the OSI model, any fault in the fabric affects the datalinks and networks that rely on the fabric.
A fabric's name is based on the name of the target. For example, when you discover an InfiniBand switch named abcp01sw-ib02 , the fabric is named IBFabric@abcp01sw-ib02.us.example.com. When the switch is a component of a system, the fabric is named for the first target in the system to be discovered. A fabric with the name ETHFabric@abcp01cn02.us.example.com indicates that this Ethernet fabric followed the discovery of a compute node.
Enterprise Manager can discover and manage Ethernet fabrics and InfiniBand fabrics. For information about discovering fabrics, see Chapter 16, "Discovering, Promoting, and Adding System Infrastructure Targets". After discovery, you can view the attributes that these fabrics have in common and also their unique attributes.
32.5.2 View Information About Fabrics
To see information about a fabric:
-
Select Targets and then All Targets.
-
Select Ethernet/InfiniBand Fabric.
-
Select one of the fabrics. The landing page for the fabric shows the incidents for this fabric and the nodes that use this fabric.
-
Click the Fabric Details icon or the Fabrics Performance icon to view more information about this fabric.
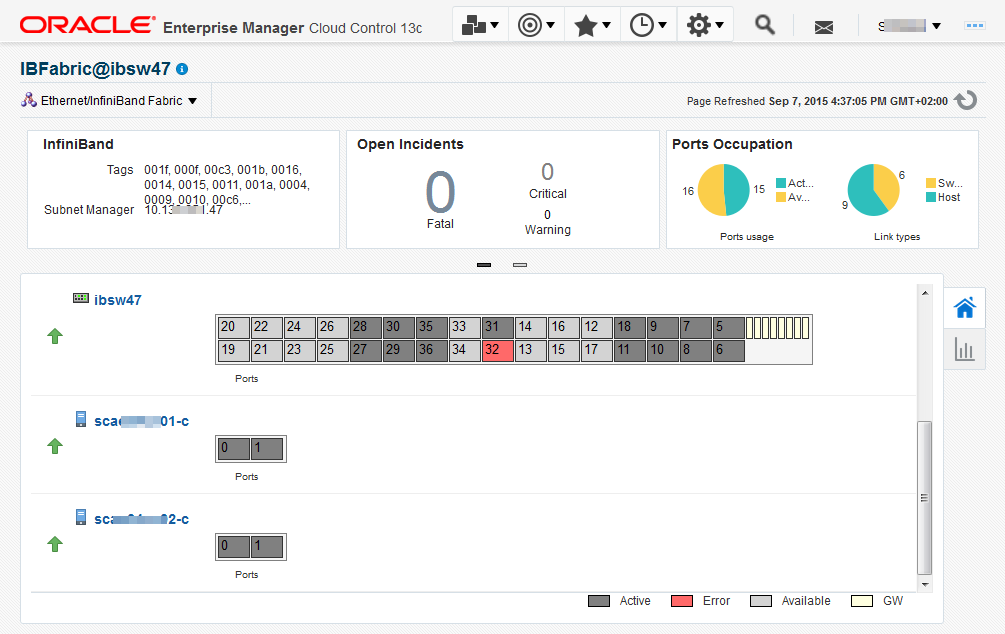
32.5.3 About Fabric Information
The Fabric dashboard's dashlets include the following information:
-
VLAN IDs or partition keys for this fabric:
-
For an Ethernet fabric with tagged VLANs, this section lists each VLAN ID. If there are no tagged VLANs, this section displays
Untagged. -
For an InfiniBand fabric, this section lists each partition key.
-
-
Open Incidents
-
Ports Occupation
-
Last Configuration time
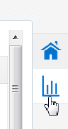
The Connected Nodes section lists every node, or network switch, in the fabric. You can also display specific information by hovering on the node, as show in Figure 32-7.
32.5.4 About Performance of Fabrics
Metrics are collected and displayed in real-time when possible. For the ILOM service processors of networks switches, the collection of metrics is not in real time. In these cases, the Last Collected metrics are displayed with a timestamp.
You can view incidents for a fabric or a network switch in the fabric and view a record of performance. If a change in performance is a concern, review recommendations for improvement:
Select Setup, then Monitoring, and then Corrective Action.
One factor that effects both performance and metric collection is the version of SNMP that you specify when you discover a network switch using the Add Using Guided Process wizard. Although all three versions of SNMP are supported, Version 3 is recommended because it is the most secure and the most efficient. Version 2c, which uses public community strings instead of credentials to get access to the network switch, is the default version and provides efficient performance. Version 1 of SNMP, which is not recommended, is not secure and collects metrics using multiple inquiries. If you require Version 1, you must increase SNMP's timeout value to at least 180 seconds. Table 32-2 summarizes the options for SNMP specification.
Table 32-2 Supported Versions of SNMP
| Version of SNMP | Level of Security | Level of Performance | Recommendation |
|---|---|---|---|
|
High: requires username and password |
High: Metrics are collected in bulk by one inquiry. |
Recommended |
|
|
Version 2 |
Not secure: Public community string |
Acceptable if Version 2c is used, which can collect metrics in bulk. Other sub-versions require extended expiration intervals. |
Performance can be acceptable, but security is poor. |
|
Version 1 |
Not secure: Public community string |
Requires expiration interval of at least 180 seconds. |
Not recommended |
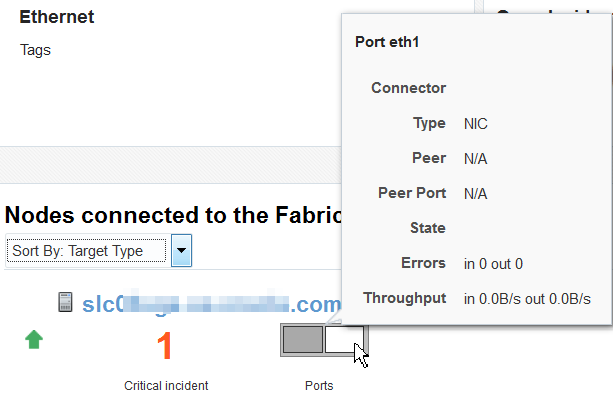
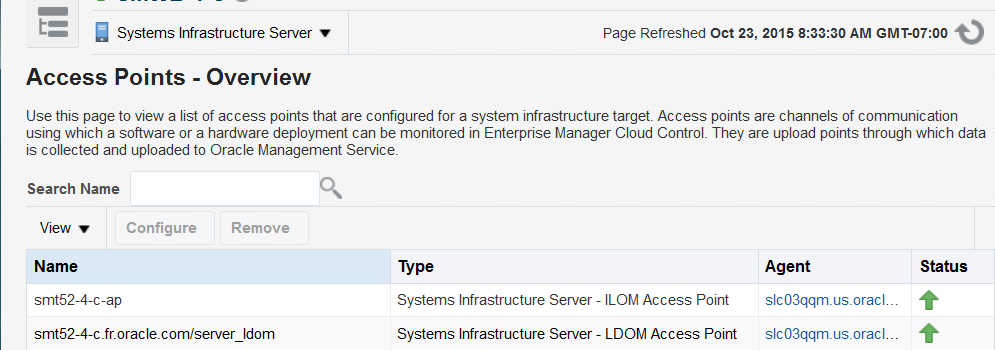
32.5.5 View Access Points
-
Select Targets and then All Targets.
-
Select Systems Infrastructure Server.
-
Select the server.
-
Click the down arrow next to the Systems Infrastructure Server group to display a menu.
-
Select Monitoring, then Access Points Overview.
-
For more information, select the menu again, select Monitoring, and then Access Points Current Capability Map.
Figure 32-9 Capability Map of Access Points
Description of ''Figure 32-9 Capability Map of Access Points''
32.5.6 Delete a Fabric
A fabric is deleted automatically when all targets connected to the fabric are removed. To remove a fabric, use the Remove Target action to remove each target. After the last target is removed, the fabric is deleted.
32.6 Datalinks
32.6.1 About Datalinks
When you discover a network switch or network-enabled device, its datalinks are discovered including:
-
Target Components
-
LAG Configuration
-
LAG Membership
-
Bonding Configuration
-
IPMP Configuration
-
IPMP Membership
The datalink layer manages networks that share resources by means VLANs (tagged and untagged VLAN IDs), InfiniBand partitions (default and assigned partition keys), and Fibre Channel zones. Datalinks can also depend on other datalinks to increase throughput or reliability.
32.7 Networks
32.7.1 About Networks
When you discover a network switch or network-enabled device, its networks are discovered. You can view the following information about a selected network:
-
Metric and Collection Settings
-
Metric Collection Errors
-
Status History
-
Incident Manager
-
Alert History
-
Blackouts and Brownouts
-
Create Blackout...
-
End Blackout...
-
All Metrics
-
Create Brownout...
-
End Brownout...
-
Job Activity
-
Information Publisher Reports
-
Last Collected
-
Comparison & Drift Management
-
Compare...
-
Search...
-
History
-
Save...
-
Saved
-
Topology
-
Compliance Results
-
Standard Associations
-
Real-time Observations
-
Monitoring Configuration
-
Administrator Access
-
Remove Target...
-
Add to Group...
-
Properties
-
Target Sitemap
-
Target Information
When you discover an operating system, you can view the following information about an OS target's network connectivity:
-
Network interfaces: MAC address, IP address, netmask and broadcast address
-
IPV4 and Ipv6
-
Routing tables
-
Open network ports
32.7.2 View Information About Networks
To see information about a network switch:
-
Select Targets and then All Targets.
-
Select Ethernet/InfiniBand Fabric.
-
Select one of the fabrics.
-
Select one of the network switches.
-
Use the tabs, such as the Performance tab, to view information about this target.
An alternative way to navigate to this page is select Systems Infrastructure Switch from the All Targets list.
-
Select Targets and then All Targets.
-
Select Systems Infrastructure Network.
-
Select a subnet.
-
Click the down arrow next to Systems Infrastructure Network to display a menu or select Target Sitemap to see the list of available actions for this target. For example, to view performance metrics, select Monitoring, then All Metrics from the drop-down menu or select All Metrics from the Target Sitemap.
32.7.3 Delete Networks
A network is deleted automatically when all targets connected to the network are removed. To remove a network, use the Remove Target action to remove each target. After the last target is removed, the network is deleted.
32.7.4 View Network Details of an OS Asset
You can select the host and then its operating system or you can select the operating system and then choose the server from the list, as described in this procedure.
-
Scroll down to the Operating System section and select the type of operating system. All servers with that operating system are listed.
-
Select a server.
-
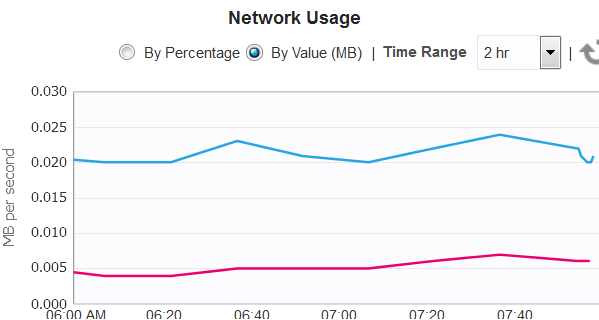
In the OS dashboard, scroll down to the Network Usage chart for an overview of network activity. You can change the values of this graph and its time interval.
-
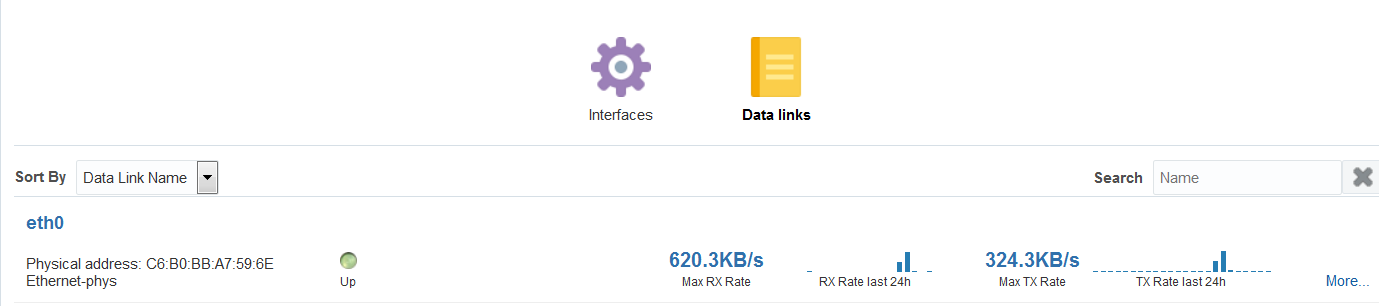
Click the Network Connectivity tab to view details. You can then click the Interfaces or the Data links options.
32.8 Related Resources for Network Management
See the following for more information: