33 Managing Storage
The following information is included in this chapter:
33.1 Get Started with Managing Storage
Oracle Enterprise Manager discovers and manages storage resources and their components, including storage pools, storage hardware, filesystems, and logical volumes.
A storage server exposes its resources as Logical Units (LUNs) or Shares. A storage client has access to these LUNs and shares, and represents them as its own filesystems or devices and also exposes these filesystems to its own clients, such as applications, databases, or virtual machines.
The System Infrastructure plug-in manages the storage resources for a Storage Appliance and for a Host.
Storage management includes all the activities for making storage resources available to operating systems and virtual assets. The following are some of the activities:
-
Discover storage targets and derive their relationship.
-
Collect configuration and performance metrics for all storage target components.
-
Detect incidents.
-
Monitor the storage target components such as, LUNs, filesystems, projects, and pools.
33.2 Location of Storage Information in the User Interface
Table 33-1 shows where to find information.
Table 33-1 Location of Storage Information in the User Interface
| Object | Location |
|---|---|
|
To view Oracle ZFS Storage Appliance target |
Select Oracle ZFS Storage Server in the All Targets selector. Click the Oracle ZFS Storage Server to display the Summary page. |
|
To view host's storage information |
Select Hosts in the All Targets selector. Click the specific host to display the Summary page. Click the Storage icon to the right. To view more details, click Disks, Filesystems, SAN Configuration, Linux LVM Volume Group(s), or ZFS Storage Pool(s) icons which appear to the left. |
|
To view storage topology |
Right-click on a storage appliance in the All Targets selector. Select Configuration and then click Topology. |
|
To view storage performance metrics |
Right-click on a storage appliance in the All Targets selector. Select Monitoring and then click All Metrics. |
|
To view storage configuration metrics |
Right-click on a storage appliance in the All Targets selector. Select Configuration and then click Last Collected. |
|
To view storage cluster membership |
Select a storage appliance cluster in the All Targets selector. Click on Target Navigation icon. |
33.3 Actions for Storage Management
You can perform the following actions, depending on the requirements:
-
Discover storage targets.
-
View the configuration of storage targets.
-
Diagnose incidents and performance metrics.
-
Modify how the targets are monitored and how performance is measured.
-
Blackout a storage appliance target which in turn, performs blackout on all of its associated automatically promoted target members.
33.4 About Storage Appliance Dashboard
The storage appliance dashboard contains basic information about the storage appliance's status, including incidents, space usage, disk I/O activity graphical representations, number of LUNs, number of shares, and last configuration details in the form of eight dashlets. See Viewing the Storage Appliance Dashboard for the steps to view the dashboard of a selected storage appliance.
The dashlets are displayed as shown in Figure 33-1. Click the icon beneath the dashboard to switch to another set of dashlets.
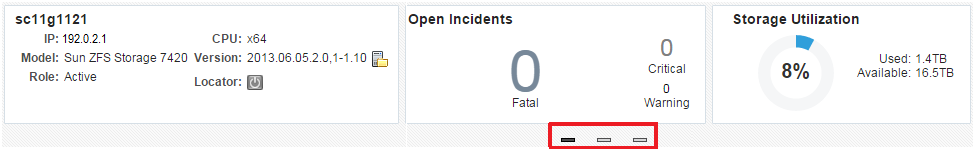
You can view the following dashlets in the storage appliance dashboard:
-
Basic Hardware Information: Displays the model name of the appliance or storage server, IP Address, CPU, Version, Role, and Locator details. It also provides information if a new appliance version is available for download.
-
Open Incidents: Displays the number of open incidents in the fatal, critical, and warning categories. Click the number displayed as the open incident in this dashlet to view detailed information about the incidents in that category.
-
Storage Utilization: Displays the percentage of used space and available space of the appliance or storage server. It displays the storage utilization at the appliance level.
-
Disk I/O Bytes/Sec (Last 24 Hour): Displays the graphical representation of overall disk I/O activity in bytes per second on the storage appliance.
-
Distribution of Logical Units Utilization: Displays the total number of LUNs used in the form of graphical representation. It also provides distribution of LUNs based on storage utilization percentage.
-
Distribution of Share Utilization: Displays the total number of shares used in the form of graphical representation. It also provides distribution of shares based on storage utilization percentage.
-
Disk I/O Ops/Sec (Last 24 Hour): Displays the graphical representation of the overall disk I/O operations per second on the storage appliance.
-
Last Configuration details: Displays the date and time information of the last configuration change and last reported incident.
33.4.1 Viewing the Storage Appliance Dashboard
To view a storage appliance's dashboard, perform the following steps:
-
From the Targets menu, select All Targets.
-
In the left navigation pane, expand Servers, Storage and Network target type.
You can view a list of appliance targets under Servers, Storage and Network.
-
Click a specific appliance target under Servers, Storage and Network.
The target name, target type, and the target status of the selected target is displayed in the right pane.
-
Click on a specific target name from the list in the right pane to view the storage appliance's dashboard.
33.4.2 Viewing Storage Appliance Cluster Dashboard
To view a storage appliance cluster's dashboard, perform the following steps:
-
From the Targets menu, select All Targets.
-
In the left navigation pane, expand Groups, Systems and Services target type.
You can view a list of cluster targets under Groups, Systems and Services.
-
Click a specific cluster target under Groups, Systems and Services.
The target name, target type, and the target status of the selected cluster target is displayed in the right pane.
-
Click on a specific cluster target name from the list in the right pane to view the storage appliance cluster's dashboard.
33.5 About Photorealistic Image
The Hardware tab in the main window of the storage appliance user interface displays a photorealistic view of the selected appliance, including the front, top, and rear as shown in Figure 33-2. See Viewing the Photorealistic Image for the steps to view the photorealistic image of a selected storage appliance.
You can hover over any component displayed in the photorealistic image to view additional information about that component.
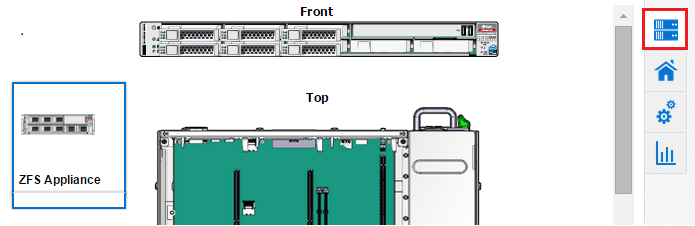
You can view the following hardware information of an appliance, if it is available and relevant to the component:
-
Component Name
-
Model Name
-
Architecture
-
Manufacturer
-
Serial Number
-
Critical incidents information
-
Part Number
-
Size of memory components
-
Total Cores of the CPU
-
Enabled Cores of the CPU
33.5.1 Viewing the Photorealistic Image
To view the Hardware tab details of an appliance, perform the following steps:
-
From the Targets menu, select All Targets.
-
In the left navigation pane, expand Servers, Storage and Network target type.
You can view a list of appliance targets under Servers, Storage and Network.
Note:
To view the cluster targets, expand Groups, Systems and Services in the left navigation pane. Select a specific cluster target in the right pane. -
Click a specific appliance target under Servers, Storage and Network.
The target name, target type, and the target status of the selected target is displayed in the right pane.
-
Click on a specific target name from the list in the right pane.
-
Click the Hardware tab which appears to the right of the storage appliance user interface to view the photorealistic image of the target selected.
33.6 About Summary
The Summary tab in the main window of the storage appliance user interface displays detailed information about the hardware components and the active Storage Services. See Viewing the Summary for the steps to view the summary of a selected storage appliance.
When you select an appliance or a storage server to view detailed information, the user interface opens with the Summary tab view, as shown is Figure 33-3.
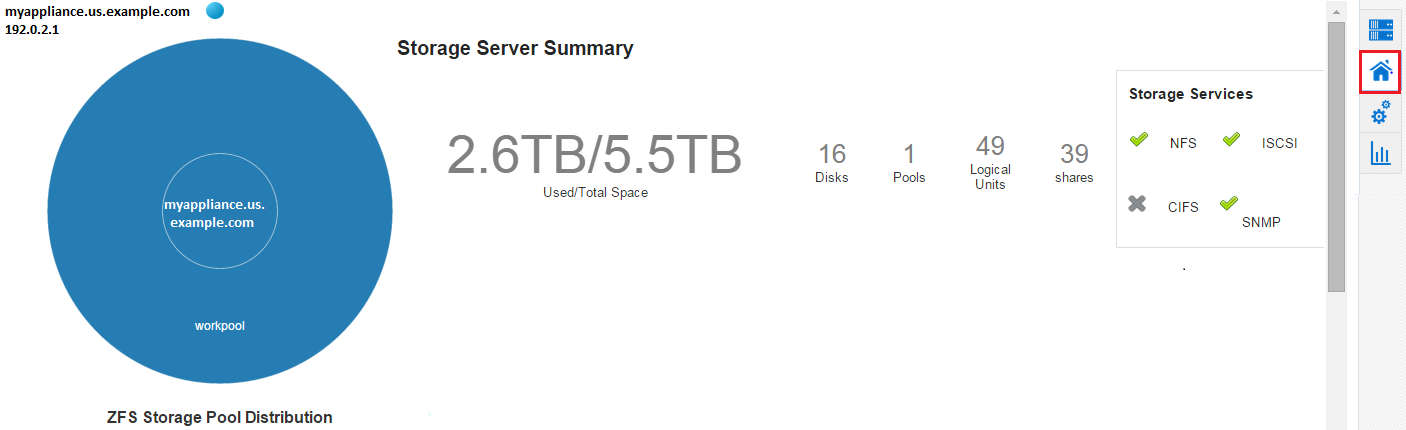
You can view the following storage summary information of an appliance in the Summary tab:
-
Appliance Name with an IP address and a locator light indicating the status of the storage resource.
-
A pie chart showing the information about storage pool distribution. You can click the center node of the pie chart to view detailed summary of storage appliance. The following details of the storage appliance are displayed:
-
Used/Total Space
-
Number of disks attached to the storage appliance
-
Number of pools in the storage appliance
-
Number of LUNs in the storage appliance
-
Number of shares in the storage appliance
-
Storage Services which are active for the storage appliance
-
Storage Usage graph indicating the storage utilization for last 5 hours, last 24 hours, and last 7 days.
-
Disks I/O ops per second graph for last 5 hours, last 24 hours, and last 7 days.
-
Disks I/O bytes per second graph for last 5 hours, last 24 hours, and last 7 days.
-
-
You can click the pool node of the appliance pie chart to view detailed summary of the storage pool. The following details of the storage pool are displayed:
-
Used/Total Space information of the pool
-
Number of projects in the pool
-
Number of LUNs in the pool
-
Number of shares in the pool
-
Status of the pool
-
ZFS Storage Pool Storage Usage graph indicating the size usage of the physical and logical group storage pools
-
ZFS Storage Pool Utilization graph for last 5 Hours, last 24 Hours, and last 7 days
-
33.6.1 Viewing the Summary
To view the Summary tab details of an appliance or a cluster, perform the following steps:
-
From the Targets menu, select All Targets.
-
In the left navigation pane, expand Servers, Storage and Network target type.
You can view a list of appliance targets under Servers, Storage and Network.
Note:
To view the cluster targets, expand Groups, Systems and Services in the left navigation pane. Select a specific cluster target in the right pane. -
Click a specific appliance target under Servers, Storage and Network.
The target name, target type, and the target status of the selected target is displayed in the right pane.
-
Click on a specific target name from the list in the right pane.
-
Click the Summary tab to view the summary details of the selected target.
33.7 About Projects
The Projects tab in the main window of the storage appliance user interface displays detailed information about the storage space used by the filesystems and LUNs as shown in Figure 33-4. It also indicates the Storage Services which are active for the particular filesystem or LUN, such as NFS, SMB, HTTP, FTP, TFTP, and SFTP. See Viewing the Projects for the steps to view the projects of a selected storage appliance.
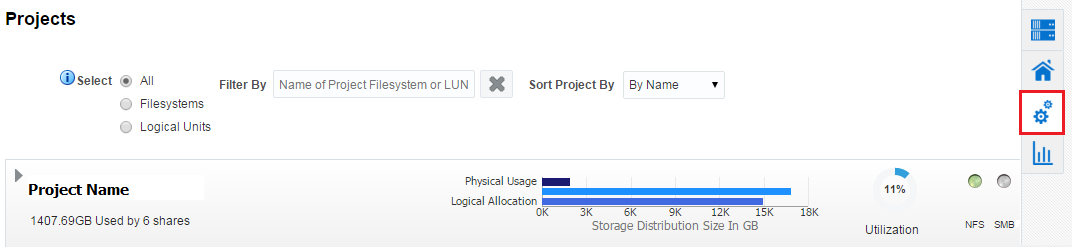
You can view the following storage project information of an appliance in the Projects tab:
-
List of filesystems and LUNs of a specific storage appliance and the storage space used by them.
-
Storage Space graph which indicates Logical Allocation, Physical Size, and Physical Usage in GB.
-
Logical Allocation bar in the graph indicates the size allocated for storage.
-
Physical Size bar above the Logical Allocation bar in the graph indicates the actual storage size.
-
Physical Usage bar indicates the space that is used by storage.
-
-
Storage Utilization in percentage.
-
Storage Services that are active are indicated in Green.
33.7.1 Viewing the Projects
To view the Projects tab details of an appliance, perform the following steps:
-
From the Targets menu, select All Targets.
-
In the left navigation pane, expand Servers, Storage and Network target type.
You can view a list of appliance targets under Servers, Storage and Network.
Note:
To view the cluster targets, expand Groups, Systems and Services in the left navigation pane. Select a specific cluster target in the right pane. -
Click a specific appliance target under Servers, Storage and Network.
The target name, target type, and the target status of the selected target is displayed in the right pane.
-
Click on a specific target name from the list in the right pane.
-
Click the Projects tab to view the storage details of the selected target.
33.8 About Charts
The Charts tab of a storage appliance user interface displays the Resources, Devices, SAN Usage, NAS Usage, and ZFS Storage Pool(s) tabs. You can select one of these tabs to view the respective graphical representation of a specific appliance.
The Charts tab appears to right of the storage appliance user interface. Click the Charts tab to view the different graphical representation tabs of the storage appliance to the left as shown in Figure 33-5.
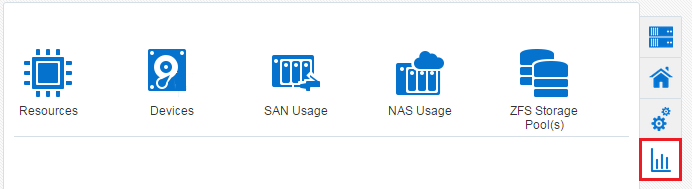
You can view the following items that displays respective graphical representation of an appliance in the Charts tab:
-
Resources: The Resources tab displays the graphical representation of CPU Utilization (%) and Memory Usage Details with respect to time.
-
Devices: The Devices tab displays the graphical representation of total disk I/O operations across all disks per second and total disk I/O bytes across all disks in bytes per second with respect to time
-
SAN Usage: The SAN Usage tab displays the graphical representation of total operations per second and total bytes per second with respect to time.
-
NAS Usage: The NAS Usage tab displays two graphical representations of total operations per second with respect to time for NAS Utilization and SMB Utilization.
-
ZFS Storage Pools: The ZFS Storage Pool(s) tab displays the graphical representation of used space and allocated space with respect to time.
33.8.1 Viewing Resources Chart
To view the Resources chart details of an appliance, perform the following steps:
-
From the Targets menu, select All Targets.
-
In the left navigation pane, expand Servers, Storage and Network target type.
You can view a list of appliance targets under Servers, Storage and Network.
Note:
To view the cluster targets, expand Groups, Systems and Services in the left navigation pane. Select a specific cluster target in the right pane. -
Click a specific appliance target under Servers, Storage and Network.
The target name, target type, and the target status of the selected target is displayed in the right pane.
-
Click on a specific target name from the list in the right pane.
-
Click the Charts tab for the different options available for viewing graphical representation of the selected target.
-
Click the Resources tab to view the respective graphical representation of a selected target.
-
(Optional): You can select a specific duration for which you need to view the graph. In the Duration menu, you can select to view the graphical representation for last 1 hour, last 24 hours, or last 5 days. By default, it displays the graph for last 1 hour duration.
-
(Optional): You can click Table View to the lower right corner of the individual graph to view the details in the form of a table.
33.8.2 Viewing Devices Chart
To view the Devices chart details of an appliance, perform the following steps:
-
From the Targets menu, select All Targets.
-
In the left navigation pane, expand Servers, Storage and Network target type.
You can view a list of appliance targets under Servers, Storage and Network.
Note:
To view the cluster targets, expand Groups, Systems and Services in the left navigation pane. Select a specific cluster target in the right pane. -
Click a specific appliance target under Servers, Storage and Network.
The target name, target type, and the target status of the selected target is displayed in the right pane.
-
Click on a specific target name from the list in the right pane.
-
Click the Charts tab for the different options available for viewing graphical representation of the selected target.
-
Click the Devices tab to view the respective graphical representation of a selected target.
-
(Optional): You can select a specific duration for which you need to view the graph. In the Duration menu, you can select to view the graphical representation for last 1 hour, last 24 hours, or last 5 days. By default, it displays the graph for last 1 hour duration.
-
(Optional): You can click Table View to the lower right corner of the individual graph to view the details in the form of a table.
33.8.3 Viewing SAN Usage Chart
To view the SAN Usage chart details of an appliance, perform the following steps:
-
From the Targets menu, select All Targets.
-
In the left navigation pane, expand Servers, Storage and Network target type.
You can view a list of appliance targets under Servers, Storage and Network.
Note:
To view the cluster targets, expand Groups, Systems and Services in the left navigation pane. Select a specific cluster target in the right pane. -
Click a specific appliance target under Servers, Storage and Network.
The target name, target type, and the target status of the selected target is displayed in the right pane.
-
Click on a specific target name from the list in the right pane.
-
Click the Charts tab for the different options available for viewing graphical representation of the selected target.
-
Click the SAN Usage tab to view the respective graphical representation of a selected target.
-
(Optional): You can select a specific duration for which you need to view the graph. In the Duration menu, you can select to view the graphical representation for last 1 hour, last 24 hours, or last 5 days. By default, it displays the graph for last 1 hour duration.
-
(Optional): You can click Table View to the lower right corner of the individual graph to view the details in the form of a table.
33.8.4 Viewing NAS Usage Chart
To view the NAS Usage chart details of an appliance, perform the following steps:
-
From the Targets menu, select All Targets.
-
In the left navigation pane, expand Servers, Storage and Network target type.
You can view a list of appliance targets under Servers, Storage and Network.
Note:
To view the cluster targets, expand Groups, Systems and Services in the left navigation pane. Select a specific cluster target in the right pane. -
Click a specific appliance target under Servers, Storage and Network.
The target name, target type, and the target status of the selected target is displayed in the right pane.
-
Click on a specific target name from the list in the right pane.
-
Click the Charts tab for the different options available for viewing graphical representation of the selected target.
-
Click the NAS Usage tab to view the NAS Utilization and SMB Utilization graphical representation of a selected target.
-
(Optional): You can select a specific duration for which you need to view the graph. In the Duration menu, you can select to view the graphical representation for last 1 hour, last 24 hours, or last 5 days. By default, it displays the graph for last 1 hour duration.
-
(Optional): You can click Table View to the lower right corner of the individual graph to view the details in the form of a table.
33.8.5 Viewing ZFS Storage Pools Chart
To view the ZFS Storage Pool(s) chart details of an appliance, perform the following steps:
-
From the Targets menu, select All Targets.
-
In the left navigation pane, expand Servers, Storage and Network target type.
You can view a list of appliance targets under Servers, Storage and Network.
Note:
To view the cluster targets, expand Groups, Systems and Services in the left navigation pane. Select a specific cluster target in the right pane. -
Click a specific appliance target under Servers, Storage and Network.
The target name, target type, and the target status of the selected target is displayed in the right pane.
-
Click on a specific target name from the list in the right pane.
-
Click the Charts tab for the different options available for viewing graphical representation of the selected target.
-
Click the ZFS Storage Pool(s) tab to view the respective graphical representation of a selected target.
-
In the ZFS Storage Pool(s) drop-down, select the specific storage pool for which you want to view the graphical representation of a selected target.
-
(Optional): You can select a specific duration for which you need to view the graph. In the Duration menu, you can select to view the graphical representation for last 1 hour, last 24 hours, or last 5 days. By default, it displays the graph for last 1 hour duration.
-
(Optional): You can click Table View to the lower right corner of the individual graph to view the details in the form of a table.
33.9 About Host Storage Information
You can view the storage information of a discovered host target. The Storage tab in the main window of the host's user interface displays the Disks, Filesystems, Linux Volume Group(s), ZFS Storage Pool(s), and SAN Configuration tabs. You can select one of these tabs to view more detailed information.
The Storage tab appears to right of the host's user interface. Select the Storage tab to view the different host storage tabs to the left as shown in Figure 33-6.
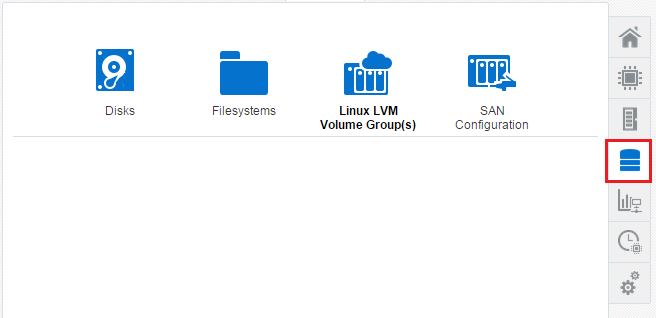
You can view the following host's storage information in the Storage tab:
-
Disks: Displays the Logical disks information and Physical disks information.
-
Filesystems: Displays the Filesystem name, their mounted location, size, incidents, and Storage Utilization.
-
Linux LVM Volume Group(s): Displays different volumes names. You can click any of the volume boxes to view the Total Space in GB, number of Incidents, number of Volumes, Storage Utilization in percentage, and the status of the volume. This tab appears for a Linux host only.
-
ZFS Storage Pool(s): Displays different storage pool volumes. You can click any of the volume boxes to view the Total Space in GB, number of Incidents, number of Volumes, Storage Utilization in percentage, and the status of the volume. This tab appears for a Oracle Solaris host only.
-
SAN Configuration: Displays the Network hardware name, number of targets connected, number of Devices connected, Session Response Time, Maximum Connection Retry Time, FC Port ID, FC Port State, and so on.
33.9.1 Disks of a Host
The Storage tab in the main window of the host lists the Disks tab. You can view the disks information of the Linux or Oracle Solaris host.
You can view the following host's disks information in the Disks tab:
-
Type of disk, such as local or remote disk
-
Name of each disk
-
Size of each disk
-
Device location of each disk
-
Number of incidents for the respective disk if incident count is greater than 0
-
Read Operations per second for last 24 hours
-
Max Read Operations per second
-
Write Operations per second for last 24 hours
-
Max Write Operations per second
-
Storage Utilization
-
SnapshotCount and SnapshotUtilization for Oracle Solaris host if the snapshot count is greater than 0
-
Vendor name
33.9.1.1 Viewing Disks of a Host
To view the host's disks information, perform the following steps:
-
From the Targets menu, select All Targets.
-
In the left navigation pane, expand the Servers, Storage, and Network target type.
You can view the host target listed.
-
Click Host.
The target name, target type, and the target status of the selected target is displayed in the right pane.
-
Click on the specific host target from the list in the right pane.
-
Click the Storage tab which appears to the right side of the user interface.
-
Click the Disks tab.
-
(Optional): You can select to view all the disks, only the local disks, or only the remote disks. Also, you can filter the list of disks by entering the Volume Name in the Filtered By field.
By default, the number of disk volumes displayed are restricted to 25 by utilization and by the volumes that have alerts. You can change this default value. After selecting Host in the left navigation pane, right click on the specific host listed in the right pane. Select Monitoring and click on Metric and Collection Settings. In the Metric and Collection Settings window, locate the Volume Statistics metric and click Edit in the Space Utilization (%) of a Volume row. Under Metric Collection Properties, the Property Names and Property Values are displayed. The value of NumberOfVolumes property is displayed as 25. You can edit this Property Value to the desired value.
33.9.2 Filesystems of a Host
The Storage tab in the main window of the host lists the Filesystems tab. You can view the filesystems information of the Linux or Oracle Solaris host.
You can view the following host's filesystem information in the Filesystems tab:
-
Type of filesystem, such as local or remote filesystem
-
Name of each filesystem
-
Size of each filesystem
-
Mounted location of each filesystem
-
Number of incidents for respective filesystem
-
Read Operations per second for last 24 hours
-
Max Read Operations per second
-
Write Operations per second for last 24 hours
-
Max Write Operations per second
-
Storage Utilization in percentage
-
Compression Ratio if enabled for Oracle Solaris host
33.9.2.1 Viewing Filesystems of a Host
To view the host's filesystems information, perform the following steps:
-
From the Targets menu, select All Targets.
-
In the left navigation pane, expand the Servers, Storage, and Network target type.
You can view the host target listed.
-
Click Host.
The target name, target type, and the target status of the selected target is displayed in the right pane.
-
Click on the specific host target from the list in the right pane.
-
Click the Storage tab which appears to the right side of the user interface.
-
Click the Filesystems tab.
-
(Optional): You can select to view all the filesystems, only the local filesystems, or only the remote filesystems. Also, you can filter the list of disks by entering the Filesystem Name in the Filtered By field.
By default, the number of filesystems displayed are restricted to 25 by utilization. You can change this default value. After selecting Host in the left navigation pane, right click on the specific host listed in the right pane. Select Monitoring and click on Metric and Collection Settings. In the Metric and Collection Settings window, locate the Filesystem Statistics metric and click Edit in the Space Utilization (%) of a filesystem row. Under Metric Collection Properties, the Property Names and Property Values are displayed. The value of NumberOfFilesystems property is displayed as 25. You can edit this Property Value to the desired value. You can also set the filesystems property to specify the filesystems that must be collected irrespective of utilization.
33.9.3 SAN Configuration of a Host
The Storage tab in the main window of the host lists the SAN Configuration tab. You can view the SAN Configuration information of the Linux or Oracle Solaris host.
You can view the following host's SAN Configuration information in the SAN Configuration tab:
-
SAN initiator type, such as, iSCSI or FC
-
IQN name for an iSCSI SAN initiator type
-
Total number of targets connected
-
Total number of devices attached
33.9.3.1 Viewing SAN Configuration of a Host
To view the host's SAN Configuration information, perform the following steps:
-
From the Targets menu, select All Targets.
-
In the left navigation pane, expand the Servers, Storage, and Network target type.
You can view the host target listed.
-
Click Host.
The target name, target type, and the target status of the selected target is displayed in the right pane.
-
Click on the specific host target from the list in the right pane.
-
Click the Storage tab which appears to the right side of the user interface.
-
Click the SAN Configuration tab.
33.9.4 Linux Volume Groups of a Host
The Storage tab in the main window of the host lists the Linux LVM Volume Group(s) tab. You can view the Linux volume group information of the Linux host.
Note:
The Linux LVM Volume Group(s) tab is only available for a Linux environment.You can view the following information of the selected volume in the Linux LVM Volume Group(s) tab:
-
Total Space in GB
-
Target Status of LVM to indicate if up or down
-
Incidents
-
Volumes
-
Storage Utilization in percentage
-
Linux LVM Volume Group Usage graph
-
Linux LVM Volume Group Hierarchy
33.9.4.1 Viewing Linux Volume Groups of a Host
To view the host's linux volume group information, perform the following steps:
-
From the Targets menu, select All Targets.
-
In the left navigation pane, expand the Servers, Storage, and Network target type.
You can view the host target listed.
-
Click Host.
The target name, target type, and the target status of the selected target is displayed in the right pane.
-
Click on the specific host target from the list in the right pane.
-
Click the Storage tab which appears to the right side of the user interface.
-
Click the Linux LVM Volume Group(s) tab. The different volumes are listed in the form of blocks to the left.
-
Click on a specific volume to view detailed information.
33.9.5 ZFS Storage Pools of a Host
The Storage tab in the main window of the host lists the ZFS Storage Pool(s) tab. You can view the detailed information of different zpools.
Note:
The ZFS Storage Pool(s) tab is only available for an Oracle Solaris environment.You can view the following information of the selected zpool in the ZFS Storage Pool(s) tab:
-
Total Space in GB
-
Target Status of the pool to indicate if up or down
-
Incidents
-
Filesystems
-
Volumes
-
Dedup Ratio
-
Storage Utilization in percentage
-
Zpool status indicating if it is online, offline, or faulted
-
ZFS Storage Pool Usage graph
-
ZFS Storage Pool Hierarchy
33.9.5.1 Viewing ZFS Storage Pools of a Host
To view the host's ZFS storage pool information, perform the following steps:
-
From the Targets menu, select All Targets.
-
In the left navigation pane, expand the Servers, Storage, and Network target type.
You can view the host target listed.
-
Click Host.
The target name, target type, and the target status of the selected target is displayed in the right pane.
-
Click on the specific host target from the list in the right pane.
-
Click the Storage tab which appears to the right side of the user interface.
-
Click the ZFS Storage Pool(s) tab. The different zpools used are listed in the form of blocks to the left.
-
Click on a specific zpool to view detailed information.
33.10 About Storage Configuration Topology
Enterprise Manager allows you to view the relationship between storage servers and storage clients. The Topology option displays the relationships between each exposed element such as LUNs or shares of the storage server and it's presence on a given host as devices and filesystems. It also shows the relationship between various applications such as database, or virtualization entities like VMs, and so on.
You can view the storage configuration topology of the storage appliance or the host. You can also view the storage configuration topology of a specific storage server element or a specific host element. Select the respective element and choose to view the topology details. See Viewing Storage Configuration Topology for the steps to view the topology of a selected storage appliance or a host.
33.10.1 Viewing Storage Configuration Topology
To view topology information of a selected target, perform the following steps:
-
From the Targets menu, select All Targets.
-
In the left navigation pane, expand Servers, Storage and Network target type.
You can view a list of appliance targets under Servers, Storage and Network.
Note:
To view the cluster targets, expand Groups, Systems and Services in the left navigation pane. Select a specific cluster target in the right pane. -
Click a specific appliance target under Servers, Storage and Network.
The target name, target type, and the target status of the selected target is displayed in the right pane.
-
You can view the storage configuration topology information by following one of these methods:
-
Right-click on a target name in the right pane to view the related options.
-
Click a specific target in the right pane, and then click the target drop-down list, which appears to the top-left of the user interface.
-
-
Select Configuration and click Topology.
33.11 About Storage Metrics
This section describes the steps to view the Storage Configuration metrics and Storage Performance metrics. It also describes the steps to change the Storage Performance metrics. Following are the items listed in this section:
33.11.1 Viewing Storage Performance Metrics
To view the storage performance metrics, perform the following steps:
-
From the Targets menu, select All Targets.
-
In the left navigation pane, expand Servers, Storage and Network target type.
You can view a list of appliance targets under Servers, Storage and Network.
Note:
To view the cluster targets, expand Groups, Systems and Services in the left navigation pane. Select a specific cluster target in the right pane. -
Click a specific appliance target under Servers, Storage and Network.
The target name, target type, and the target status of the selected target is displayed in the right pane.
-
You can view the performance metrics of the selected target by following one of these methods:
-
Right-click on a target name in the right pane to view the related options.
-
Click a specific target in the right pane, and then click the target drop-down list which appears to the top-left of the user interface.
-
-
Select Monitoring and click All Metrics.
You can view the list of metric collection overview, different metric events such as open alerts and top five altering metrics in the last 7 days, and deployed metric extension information.
33.11.2 Viewing Storage Configuration Metrics
To view a storage configuration metrics, perform the following steps:
-
From the Targets menu, select All Targets.
-
In the left navigation pane, expand Servers, Storage and Network target type.
You can view a list of appliance targets under Servers, Storage and Network.
Note:
To view the cluster targets, expand Groups, Systems and Services in the left navigation pane. Select a specific cluster target in the center pane. -
Click a specific appliance target under Servers, Storage and Network.
The target name, target type, and the target status of the selected target is displayed in the right pane.
-
You can proceed to view the storage configuration metrics by following one of these methods:
-
Right-click on a target name in the right pane to view the related options.
-
Click a specific target name in the right pane, and then click the target drop-down list which appears to the top-left of the user interface.
-
-
Select Configuration and click Last Collected.
-
Select a configuration metric from the left navigation pane to view the configuration properties of the selected metric.
33.11.3 Changing Metric Collection
Oracle Enterprise Manager monitors storage resources and collects information about them to track performance. You can change what metrics are collected and, in some cases, change how the metrics are collected, for example, the frequency.
To change the performance metrics of a selected target, perform the following steps:
-
From the Targets menu, select All Targets.
-
In the left navigation pane, expand Servers, Storage and Network target type.
You can view a list of appliance targets under Servers, Storage and Network.
Note:
To view the cluster targets, expand Groups, Systems and Services in the left navigation pane. Select a specific cluster target in the right pane. -
Click a specific appliance target under Servers, Storage and Network.
The target name, target type, and the target status of the selected target is displayed in the right pane.
-
You can proceed to view the performance metrics by following one of these methods:
-
Right-click on any of the target name in the right pane to view the related options.
-
Click a specific target name in the right pane, and then click the target drop-down list which appears to the top-left of the user interface.
-
-
Select Monitoring and click All Metrics.
You can view details of the different metrics.
-
In the left navigation pane, select a specific metric. If this metric can be changed, a Modify button appears in the right pane for Collection Schedule.
-
Click Modify.
-
In the Modify Collection Schedule window, change the value to adjust the collection of the metric, usually the frequency and how the metric is used. Make a note of the metrics that are dependent on this change, so that you can change their collection, if necessary.
-
Click OK to save the changes.
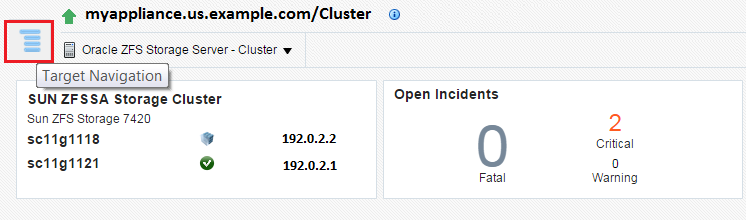
33.12 About Storage Cluster Membership
You can have a cluster configuration setup with two Oracle ZFS Storage Appliances. When such configuration is in use, you can view the cluster membership information of the two appliances.
33.12.1 Viewing Storage Cluster Membership
To view cluster membership information of the appliances which are in a cluster configuration setup, perform the following steps:
-
From the Targets menu, select All Targets.
-
In the left navigation pane, expand Groups, Systems and Services target type.
You can view a list of cluster targets under Groups, Systems and Services.
-
Click a specific cluster target under Groups, Systems and Services.
The target name, target type, and the target status of the selected target is displayed in the right pane.
-
Click on a specific cluster target name from the list in the right pane.
-
Click the Target Navigation tab which appears to the left of the cluster drop-down list, as shown in Figure 33-7.
-
Select a specific cluster to view the storage summary details of the cluster. You can view the cluster information in the dashboard, images of the storage appliance which have a cluster configuration setup, different networks and pools information.
33.13 About Storage Resource Deletion
When an appliance or a host is discovered as a target, it automatically promotes some of the target members. See Target Members of an Oracle ZFS Storage Appliance to view the list of automatically promoted target members. You can choose to either remove the target or remove its members. If you choose to remove a target, such as an appliance or a host, all the associated members are also removed. See Removing a Storage Resource for the steps to remove a storage resource.
You must start the deletion process from the target level to delete all the members.
Note:
If the target members have a proper association with an appliance or a host, the deletion of these members is successful. For example, a diskshelf target member is associated to a ZFS Storage Server. If the association of these target members are not correct, diskshelf target members are not deleted.33.13.1 Removing a Storage Resource
To remove a storage resource, perform the following steps:
-
From the Targets menu, select All Targets.
-
In the left navigation pane, expand Servers, Storage and Network target type.
You can view a list of appliance targets under Servers, Storage and Network.
Note:
To view the cluster targets, expand Groups, Systems and Services in the left navigation pane. Select a specific cluster target in the right pane. -
Click a specific appliance target under Servers, Storage and Network.
The target name, target type, and the target status of the selected target is displayed in the right pane.
-
You can proceed to delete a storage resource by following one of these methods:
-
Right-click on the target name which you want to remove in the right pane.
-
Click a specific target name in the right pane, and then click the target drop-down list which appears to the top-left of the user interface.
-
-
Select Target Setup and click Remove Target.
-
In the confirmation dialog box, click Yes to remove the specific target.
33.13.2 Removing an Oracle ZFS Storage Appliance Cluster
You can delete an Oracle ZFS Storage Appliance which is part of a cluster. See Removing a Storage Resource for steps to delete an Oracle ZFS Storage Appliance. When two Oracle ZFS Storage Servers have a cluster configuration setup, the deletion of cluster target initiates deletion of both the storage servers in the cluster and the associated target members, such as, diskshelves. The members of an Oracle ZFS Storage Appliance include the following:
-
ZFS Storage Server
-
Diskshelf
-
ZFS Storage Appliance Cluster
When you initiate deletion of one of the storage server that is a part of the cluster configuration setup, the associated cluster target is deleted. The other storage server is not deleted. The diskshelves are not deleted if there is a second storage server.
When you initiate deletion of a storage server that is not a part of the cluster configuration setup, the associated diskshelves are deleted.
33.14 Using Oracle ZFS Storage Appliance in Engineered Systems
This section describes the prerequisite for an Oracle ZFS Storage Appliance on engineered systems. A non-root user should have required privileges to view the analytic datasets. If the specific privileges are not assigned, then the analytic metrics displays an error. You can add an extra privilege to a non-root user to access datasets.
To add a privilege in the appliance's user interface, perform the following steps:
-
Login to Oracle ZFS Storage Appliance user interface.
-
Click Configuration.
-
Click USERS.
-
Select non-root user and click edit icon.
-
Click Exceptions.
-
In the Scope drop-down, select Analytics.
-
Select the read: Read a statistic with this drilldown present check box.
-
Click ADD.
You can also add an exception to a non-root user using Command Line Interface for reading analytics dataset. For example:
zfssa:> configuration users
zfssa:configuration users> select oemuser
zfssa:configuration users oemuser> exceptions
zfssa:configuration users oemuser exceptions> create
zfssa:configuration users oemuser auth (uncommitted)> set scope=stat
                         scope = stat
zfssa:configuration users oemuser auth (uncommitted)> set allow_read=true
                    allow_read = true (uncommitted)
zfssa:configuration users oemuser auth (uncommitted)> commit
zfssa:configuration users oemuser exceptions>
33.15 Related Resources for Storage
For instructions in performing actions or to learn more about the role of this feature, go to one of the following resources.
-
To view the Sun ZFS Storage 7000 System Administration Guide, log in to the Unified Storage System software interface and click Help in the top right corner of any screen. You can also access this guide at the host name or IP address of the storage system:
-
https://hostname:215/wiki -
https://ipaddress:215/wiki
-
-
See the Oracle ZFS Storage Appliance Software product information page at http://www.oracle.com/us/products/servers-storage/storage/unified-storage/sun-storage-7000-uss-103104.html for links to more information.
-
See Discovering and Promoting Oracle ZFS Storage for more information on Storage Discovery.
-
See the Discovering, Promoting, and Adding System Infrastructure Targets chapter for more information on discovering and promoting system infrastructure targets.