4 Operations
This chapter describes how to work with the Operations voice and video monitoring features of Oracle Communications Operations Monitor.
KPI/Metrics
The KPI/Metrics page provides standards of measurement by which efficiency, performance, progress or quality of the platform are assessed. Such measurements are called metrics or Key Performance Indicator (KPI).
A metric is a measurement of a numeric property on the monitored platform. Operations Monitor evaluates the metric every second, and aggregates the values into minute and hour averages, minima and maxima. Additionally, it keeps a history of the following increments: one hour, minute and hour averages, and minimum and maximum values.
Operations Monitor offers a wide range of predefined metrics, and allows you to create new ones. Thus, each realm defined in Operations Monitor can have its own personalized list of defined metrics. Operations Monitor users associated to a realm are able to see and change only the metrics defined for that realm. For more information about realms, see "Realms Definitions". Operations Monitor users can save their most used metrics into a Favorites list.
You can create an average of a metric in Operations Monitor. For example, this is useful if a provider wants to be notified when the number of active calls drops below a certain threshold, but not taking into account the low number of calls during night or weekends. In this case, an average of the active calls during the working days is useful. For information on how to configure this feature, see "Average Metrics/KPIs".
A KPI is a combination of metrics, and is usually defined as ratio of other metrics. Operations Monitor supports the IETF KPIs defined in the draft ietf-pmol-sip-perf-metrics-04.
The evolution of any metrics or KPI is presented in the chart in the upper area.
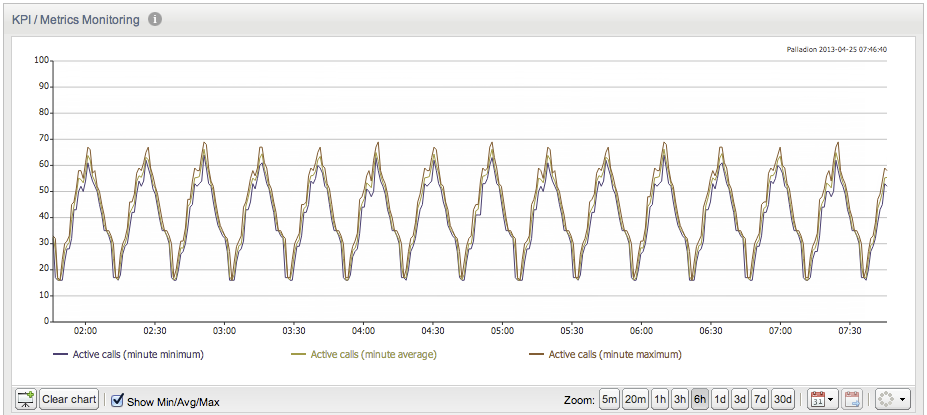
KPI/Metrics Monitoring Chart
The KPI /Metrics Monitoring chart (see Figure 4-1) displays the evolution and history of up to five measurements, including the average values as well as minimum and maximum values.
This chart operates like others in Operations Monitor: you can zoom out to see the evolution through the past, zoom in and scroll to the present, or pan to a specific time. For more information, on how to use Operations Monitor charts, see "Charts".
To display the minimum, average and maximum values of the metrics on the chart, mark the Show Min/Avg/Max box at the bottom of the panel. Note that min, average, and max only show meaningful differences when using larger temporal resolutions.
To display the KPI/Metrics in the Monitoring chart, you must mark the metric in the Library: Platform-Wide Metrics and KPIs section. For more information, see "Library: Platform-Wide Metrics and KPIs".
KPI/Metrics Monitoring Grid
The KPI/Metrics Monitoring panel contains a Favorites list created by the Operations Monitor user that displays the metrics they are most interested in (see Figure 4-2). The Library provides available metrics and KPIs to select, view, mark as favorite and customize.
Figure 4-2 KPI/Metrics Monitoring Library and Favorites
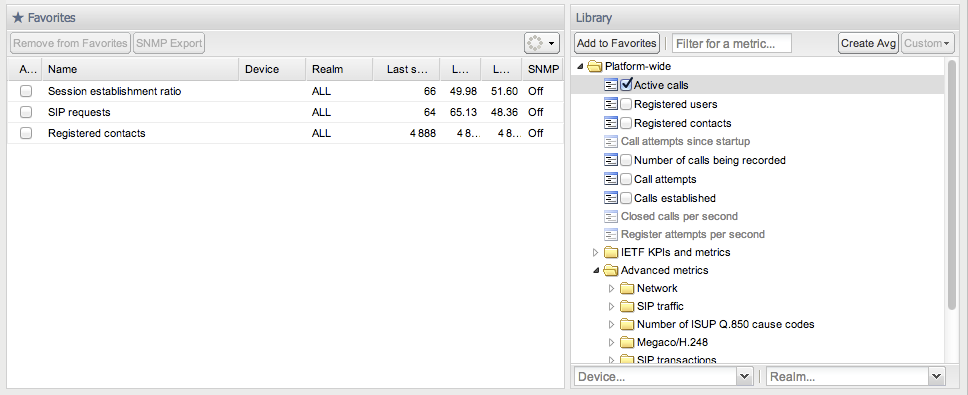
Description of ''Figure 4-2 KPI/Metrics Monitoring Library and Favorites''
Library: Platform-Wide Metrics and KPIs
The metrics measured on the entire platform are presented in the Platform-wide tree under the following three sections:
-
Defined metrics is the first, unnamed section and where the most common metrics appear.
-
IETF KPIs and metrics contains the KPIs as defined in draftietf-pmol-sip-perf-metrics-04.
-
Advanced metrics is the section where you can configure customized metrics.
Pre-Defined Metrics
Operations Monitor adds the most frequently used metrics at the top of the list:
-
Active calls.
-
Registered users.
-
Registered contacts.
-
Call attempts.
-
Call established.
-
Closed calls per second.
To view a metric from the library in the chart above, you must mark the check box. By default, the Active calls metric is displayed.
IETF KPIs and Metrics
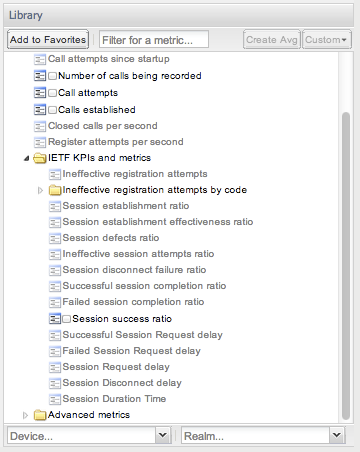
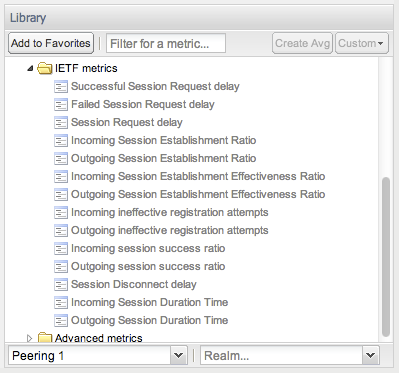
In the IETF KPIs and metrics section are the KPIs defined in the draft ietf-pmol-sip-perf-metrics-04. A list of IETF KPIs is shown in Figure 4-3.
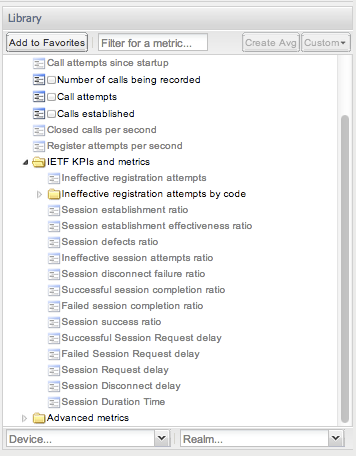
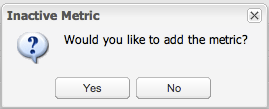
The metrics displayed in gray text are inactive. Operations Monitor measures these metrics when you activate them. To enable a metric, click on the gray metric. The Inactive Metric window appears as shown in Figure 4-4. Click Yes to confirm.
After a metric is activated, the metric text is displayed in black. This signifies that Operations Monitor is providing values for this metric, and you can view its evolution in the chart by marking its check box.
Some KPIs will not provide values for users in a realm. These KPIs are calculated on the transport level when the Ethernet frame is decoded. It is not possible to provide these values for users in a realm. These KPIs are:
-
Bandwidth of the UDP packets
-
Bandwidth of the TCP packets
-
Bandwidth of the SCTP packets
These KPIs appear as disabled. Enabling them does not provide any value to a user in a realm.
Figure 4-5 IETF KPIs with Session Success Ratio KPI Activated
Description of ''Figure 4-5 IETF KPIs with Session Success Ratio KPI Activated''
The Ineffective registration attempts by code KPI is configurable. It requires an interval of codes to be specified in order to be activated. Thus, you can customize its own KPI by adding the lower code, the upper code and the name of the new created metric as shown in Figure 4-6.
Figure 4-6 Define Ineffective Registration Attempts (IRA)KPI
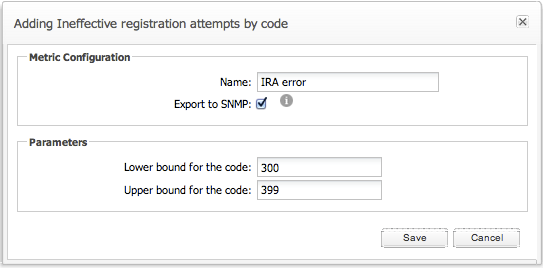
Description of ''Figure 4-6 Define Ineffective Registration Attempts (IRA)KPI''
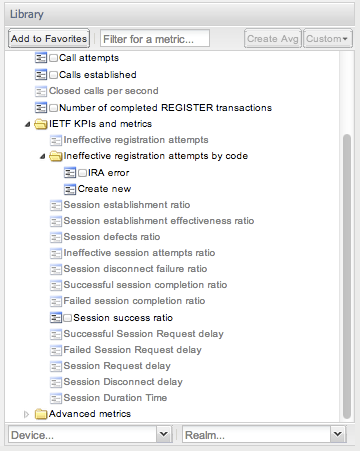
The newly defined KPI is added in the Ineffective registration attempts by code folder as shown in Figure 4-7.
The user defined metrics can be later edited or deleted by clicking on the Custom button as shown in Figure 4-8.
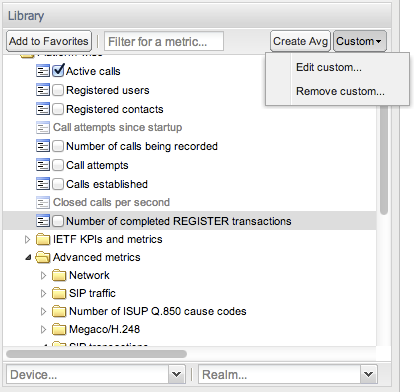
You can access each core metric through an external application via SNMP. To enable exporting to SNMP, select the metric in the library and click the Custom button. Select Edit custom and mark the Export to SNMP check box. For so-called compound metrics, an export is not possible and the check box is not available.
Advanced Metrics
Metric types are grouped into the following categories (see Figure 4-8):
-
Number of ISUP Q.850 cause codes
Measures the sniffed ISUP traffic with certain Q.850 cause codes.
-
Network
Measures transport layer properties, such as the number of TCP streams or the number of SCTP packets.
-
SIP traffic
Measures the sniffed SIP traffic, such as the number of SIP requests or the number of certain SIP replies.
-
Megaco/H.248
Measures the amount of Megaco legs that are active, created, or finished.
-
MGCP
Measures the amount of MGCP legs that are active, finished, or completed.
-
SIP transactions
Measures the SIP transactions with certain properties like the number of INVITE transactions that end with an error or the number of failed registrations.
-
Calls
Measures the calls with special properties, such as the number of calls with a call length smaller than 30 seconds.
-
Registrations
Measures the registrations with certain properties, such as the number of unauthorized registrations in the last second.
-
RTCP
Measures the amount of RTCP or RTCP-XR packets and their jitter, delay, and MoScq values.
-
RTCP Usage
Measures the RTCP or RTCP-XR streams.
Library: Per-Device Metrics and KPIs
Operations Monitor can measure metrics for a platform device or specified trunk. In order to enable this feature, you must configure the platform devices (or trunks) in the platform settings. For more information, see "Platform Devices".
In the Library section of the KPI/Metrics page, you must select the device or trunk from the Devices field below the tree of metrics as shown in Figure 4-9.
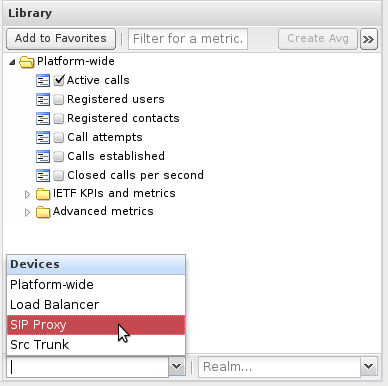
Once you select a device, the metrics are presented in the Library tree.
When you are creating a metric for a device, you must specify whether the metric represents incoming traffic, outgoing traffic, or traversing. For each of the calls metrics, three values are stored:
-
Incoming counts the call legs which have the IP address of the selected device as a destination.
-
Outgoing counts the call legs which have the IP address of the selected device as the source.
-
Traversing counts the calls that are relayed by the selected device. In other words, the calls that have one incoming and one outgoing call leg to/from the device.
If the device is a trunk, incoming is replaced by egress, and outgoing is replaced by ingress, as trunks are always viewed from the platform point of view. For more information, see "Trunks/Prefixes".
Pre-Defined Metrics
Operations Monitor adds the most commonly used metrics at the top of the list:
-
Active calls (incoming).
-
Active calls (outgoing).
-
Active calls (traversing).
-
Call attempts (incoming).
-
Call attempts (outgoing).
-
Call attempts (traversing).
-
Registered users.
-
Registered contacts.
-
Response time (msec).
-
Transit time (msec).
Click the check box from the front of metrics name to see the evolution of one of these metrics in the chart.
-
Transit time
The time difference, in milliseconds, between the first INVITE message from the incoming call leg and the first INVITE message from the outgoing call leg. Only the calls that are relayed by the selected device are counted. To represent these values over time, if more calls are relayed in the same second, the maximum transit time is saved as value for that second. The web interface can then display average and maximum values per minute and per hour.
-
Response time
The time difference, in milliseconds, between the initial request of a non-INVITE transaction and the final answer. Only the transactions, in which the destination IP address is one of the selected device's addresses, are counted.
Note:
The INVITE transactions are not considered here. The INVITE -> 100 time is always small, while the INVITE ->200 time is irrelevant, because it depends on when the callee answers.IETF Metrics
A list of per device performance metrics (KPIs) is displayed in the IETF Metrics section of the library as shown in Figure 4-10.
Advanced Metrics
The web user can customize his own metrics under the categories presented in the advanced metrics tree.
Metrics displayed in a gray color are inactive and can be activated by clicking on them to bring up a window, as shown in Figure 4-10.
Once activated, their color becomes black and Operations Monitor starts providing measurements for them.
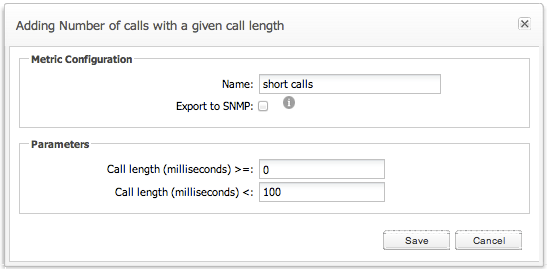
The metrics that share the same properties are grouped in folders and can be easily customized by clicking on the Create new link from the folder. An example of this group might be Number of calls with a given call length. This metric requires a couple of parameters to be configured, such as name, if it is exported via SNMP, direction of the call and the interval of the reply codes (see Figure 4-11).
The user defined metrics can be edited or deleted by clicking on the Custom button, as shown in Figure 4-8.
The same tree of metrics is displayed under the Devices page as they are configurable for a platform device (or trunk). For more information, see "Devices".
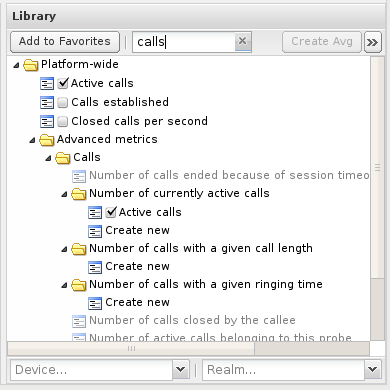
Filtering in the Metrics/KPIs List
Operations Monitor offers a search box for filtering the metrics by name. For example, if you want to filter the metrics for those that contain 'calls', enter calls into the search box as shown in Figure 4-12.
Restricting the Scope of Metrics/KPIs
You can restrict metrics/KPIs to a subset of the subscriber base using Realms. Operations Monitor users defined in the same realm share the same metrics, but another Operations Monitor user from a different realm is not able to see the metrics defined for other realms. The user associated with a realm can see metrics for any defined sub-realms. For more information, see "Realms Definitions".
The exception to this rule is the admin user who is able to see all metrics defined for each realm. The admin user can select a realm from the Realms list below the metrics tree, as shown in Figure 4-13.
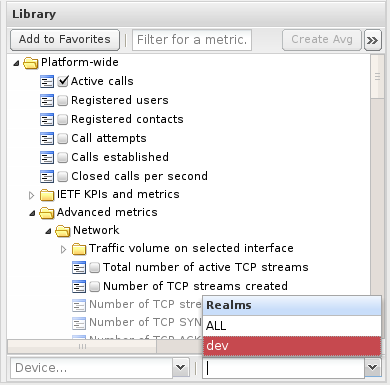
After choosing a realm, the admin user is able to see the metrics tree defined for that realm in the Library panel.
Note:
The default Metrics/KPIs for a realm is created first when a user belonging to that realm logs in. For example, a realm bound user that logs in for the first time might be able to see old calls, but the Active calls metric only has data from the time the user first logged in and onwards.Average Metrics/KPIs
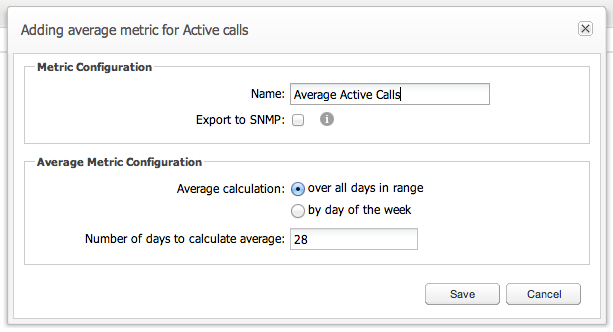
An average metric or KPI can be created from any metric or KPI from the Library panel. In order to generate the average metric, first select the metric or KPI in the Library panel and then click on the Create Avg button (see Figure 4-2).
Average metrics require some configuration parameters such as a name, specifying if it is exported as SNMP, and the period it is calculated (see Figure 4-14).
Figure 4-14 Configure an Average Metric/KPI
Description of ''Figure 4-14 Configure an Average Metric/KPI''
As the traffic during the weekends might be significantly lower than during the working days, Operations Monitor offers the ability to calculate the average only for working days as Figure 4-14 shows. The period of time for which the average has been calculated is given in number of days.
After the average metric/KPI is created, it is added under the metric or KPI to which it belongs.
Adding Metrics to All Trunks
It is possible to specify a device-specific metric to be added to all existing trunks and to all trunks that will be defined in the future. This is done by selecting any trunk, right-clicking the metric in question, and checking Add to all TRUNK devices.
Metrics that have been added to all trunks may still be removed manually from individual trunks.
Deselecting Add to all TRUNK devices removes the metric from trunks it has been added to using this functionality, but not from trunks it has been added to manually, whether this happened before or after the functionality was invoked. Editing a metric on a trunk also prevents it from being removed from the trunk in this manner.
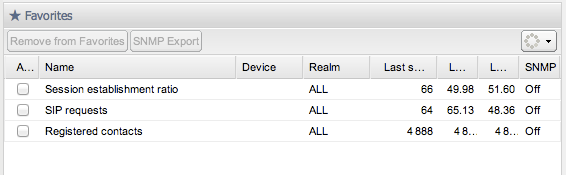
Favorite Metrics/KPIs
Any metric or KPI from the Library can be dragged to the favorites list for an at-a-glance view of a small set of metrics. Each Operations Monitor user has their own personalized Favorites list as it is saved by user, as shown in Figure 4-15.
Figure 4-15 Favorite List of Metrics/KPIs
Description of ''Figure 4-15 Favorite List of Metrics/KPIs''
Metrics in the Favorites list are displayed with the following information:
-
Name, which is the name of the metric.
-
Device, which is the device it is measured on.
-
Realm, which is the realm it belongs to.
-
Last second, which is its value in the last second.
-
Last minute avg, which is its average on the last minute.
-
Last hour avg, which is its average on the last hour.
-
SNMP, which is On if the metric is exported via SNMP. Else it is Off.
Note:
In case of a platform-wide metric, the Device field is empty.To remove a metric/KPI from the favorites list, first select the metric/KPI, and then click on the Remove from Favorites button. In case you want to enable/disable exporting the selected metric/KPI via SNMP click on the Enable SNMP Export or Disable SNMP Export button.
Bulk KPI/Metrics Creation and Removal
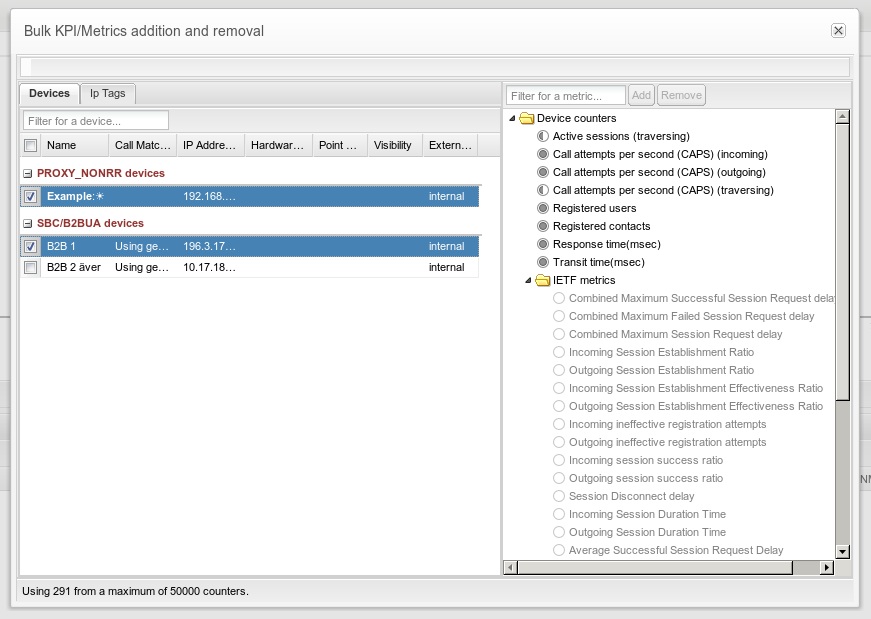
Operations Monitor provides the functionality for simplifying the addition and removal of multiple metrics in the Bulk KPI/Metrics dialog box. Using this tool, users can add and remove counters for multiple devices and IP Tags in a single operation. It is also useful for providing information about current KPI/counters usage.
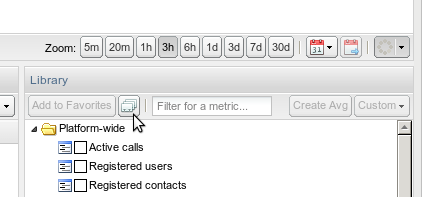
Invocation
To invoke it, press the corresponding button you will find on the top of the Library toolbar on the KPI/Metrics page.
The following dialog will appear:
Figure 4-17 Bulk KPI/Metrics Addition and Removal Invocation
Description of ''Figure 4-17 Bulk KPI/Metrics Addition and Removal Invocation''
Information Shown
The Bulk KPI/Metrics addition and removal dialog window is composed with the following elements:
-
Devices and Ip Tags
This panel contains two tabs, Devices and the Ip Tags. Each tab allows users to select different devices/iptags, which are show in their corresponding groups. The same operations can be performed on both tabs.
-
Counters
Shows a tree with the counters, as in the single device/IPtag widget but showing a symbol notation and a tooltip explains its meaning. These symbols have the following legend:
-
Light gray: not existing counter.
-
Half dark gray: counter exists for a subset of the selected devices.
-
Full dark gray: counter exists for all the selected devices.
-
Lock: counter cannot be added or removed.
The top toolbar filter lets users filter by counter name.
-
-
Progress Bar
In the top of the dialog, it will show the progress of the bulk action. The process runs in background mode, so other actions can be performed in parallel.
-
Bottom Toolbar
Shows the current number of counters created and the limit enforced for the bulk counters operations. These limits are not enforced for single counter operations.
Usage
Select one or more devices/IPtags on the device and then select a counter definition in the KPIs/counters panel. Adding or removing counters for those devices is implemented using the Add and Remove buttons on top of the counters tree panel.
Depending on the number of existent enabled counters, the following behavior applies:
-
Fully disabled counters are only allowed to be enabled.
-
Fully enabled counters (when counter is present for all selected devices) are only allowed to be removed.
-
Half enabled counters will be offered two options:
-
Add the ones that are not present in some devices.
-
Remove all the existing ones from all the devices.
-
Limitations
Some device counters are created by Operations Monitor and cannot be added or removed. They are shown with a lock icon. The user is not allowed to add or remove them.
Bulk operations cannot be performed in some critical counters. Those counters will not be shown in the bulk KPIs/counters dialog box but they appear in the single device Library widget, in the parent KPI/counters page. They cannot be removed.
Once the limit for the counters amount is surpassed, users will only be able to perform removal operations.
Calls
The Calls page is the central repository for call analysis in Operations Monitor. You can analyze call information by traversing the platform in real-time or historically. This data can be inspected as a high-level overview of all active calls, or a single call and its messages in detail. Operations Monitor can display SIP or ISUP calls together with MEGACO, MGCP, ENUM, and Diameter Cx.
This page contains two panels: the Calls Chart displaying the number of calls currently in progress, and Recent Calls showing details about recent calls. For more information, see "Active Calls Chart" and "Recent Calls".
Call Legs
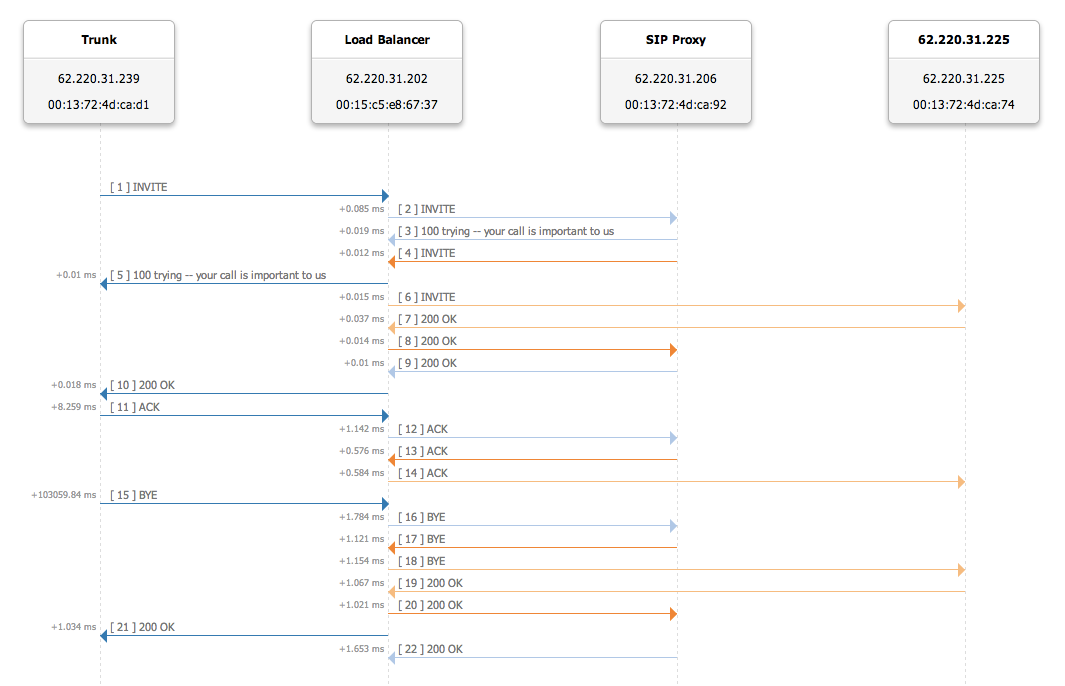
A call leg is the portion of the call between two platform devices. Operations Monitor gathers messages from multiple points on the network, correlates them into call legs and merges them into calls. For example, the call from Figure 4-18 contains four call legs:
-
From the Trunk to the Load Balancer device.
-
From the Load Balancer to the SIP Proxy.
-
From the SIP Proxy back to the Load Balancer.
-
From the Load Balancer to the callee.
Merging call legs into call flows is important for network troubleshooting and gathering accurate statistics. For call merging to work properly, you need to configure the platform devices in the Platform Devices section. For more information about configuring platform devices, see "Initial Configuration".
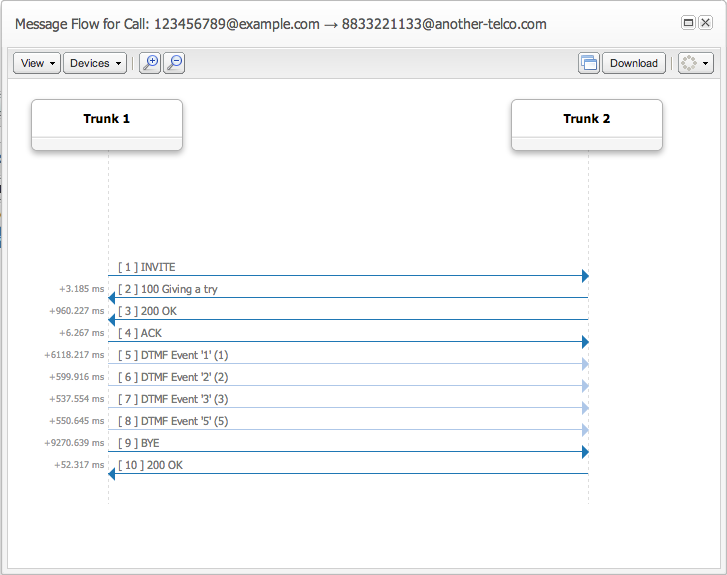
DTMF Tones in Call Flow
The call flow shows the DTMF tones (see Figure 4-19). This is subject to certain user permissions.
Call States
Table 4-1 lists the call states:
| Call States | Description |
|---|---|
|
Unauthorized |
The call was answered with '401' or '407'. The UAC typically sends another INVITE containing the credentials. If these are accepted by the UAS, the state will change to Proceeding or Established. |
|
Proceeding |
The call enters this state immediately after the first INVITE is received, and stays in it until an answer changes the state. The State details column may provide extra information (INVITE seen, ACK seen but no final response yet). |
|
Ringing |
The call enters this state when the first '180 Ringing' answer is seen. |
|
Established |
The call enters this state when the first successful 2xx answer is seen. The State details column mentions if the ACK is not yet received (200 OK seen, waiting for ACK). |
|
Finished |
An Established call enters this state when the first BYE message is seen. The State details column mentions if the related 200 OK message is not yet received (BYE seen, waiting for confirmation). |
|
Timed out |
An Established call enters this state if it lasts longer than the configured session timeout limit. This limit can be changed from the Session-timeout For Calls system option. For more information, see "Session-Timeout For Calls". |
|
Error |
A call enters this state if Operations Monitor is unable to follow the call, due to an unexpected sequence of message. |
|
Failed |
A Proceeding call enters this state if a non-successful final response is seen or the 'INVITE' transaction times out. In the latter case, the State details column shows the 'Timeout during call setup' message. |
|
Not Found |
A Proceeding call enters this state if the 404 response code is seen. |
|
Moved |
A Proceeding call enters this state if the 301 or the 302 response code is seen. |
|
Off-line |
A Proceeding call enters this state if the 480 response code is seen. |
|
Busy |
A Proceeding call enters this state if the 486 or the 600 response code is seen. |
|
Canceled |
A Proceeding call enters this state if the 487response code is seen. |
If a call has multiple call legs, the call state is computed from the call legs' individual states.
Active Calls Chart
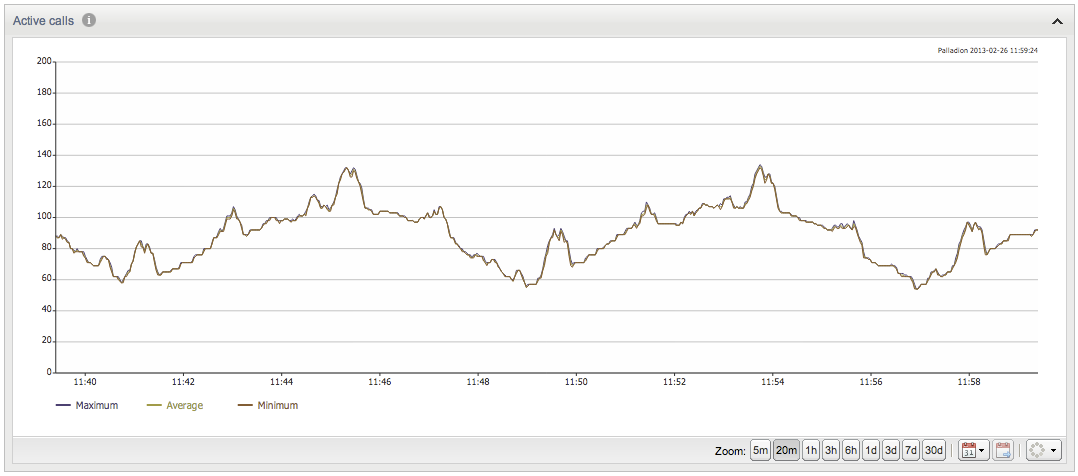
The Active calls chart represents the number of established calls at the time of the measure. The minimum, maximum, and average for the sample period are displayed. Zooming and panning are available in this chart. For more information, see "Charts".
By default, the Auto Refresh is set to 30 seconds for this graph. For more information, see "Refresh Button".
Figure 4-20 depicts a typical view for one day of the Active Calls graph. The number of established calls decreases at night and increases during peak hours.
Figure 4-20 Evolution of Active Calls Over 20 Minutes
Description of ''Figure 4-20 Evolution of Active Calls Over 20 Minutes''
Figure 4-21 shows a view for 3 days.
Figure 4-21 Evolution of 'Active calls' Over 3 days
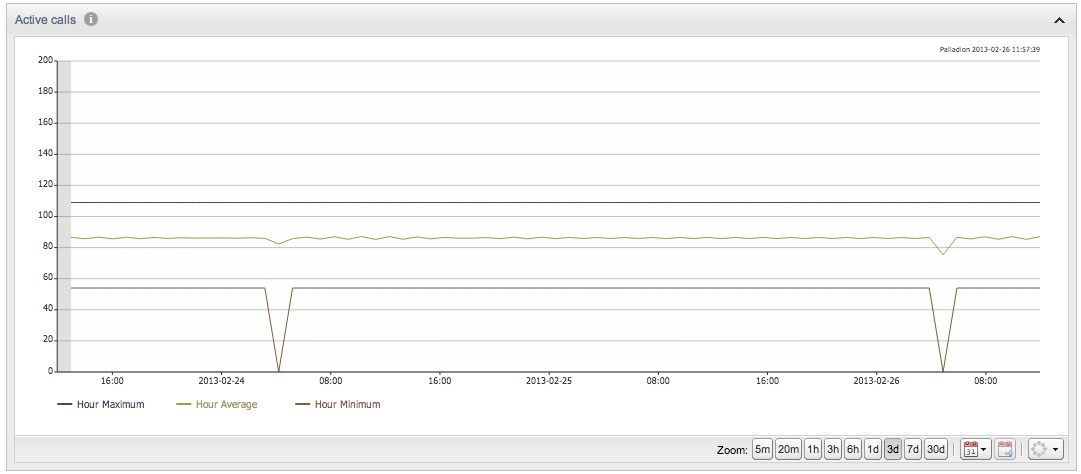
Description of ''Figure 4-21 Evolution of 'Active calls' Over 3 days''
Recent Calls
The Recent Calls table displays recent and historical information for calls made in the last few days. The calls from this table are updated in real-time as their state changes.
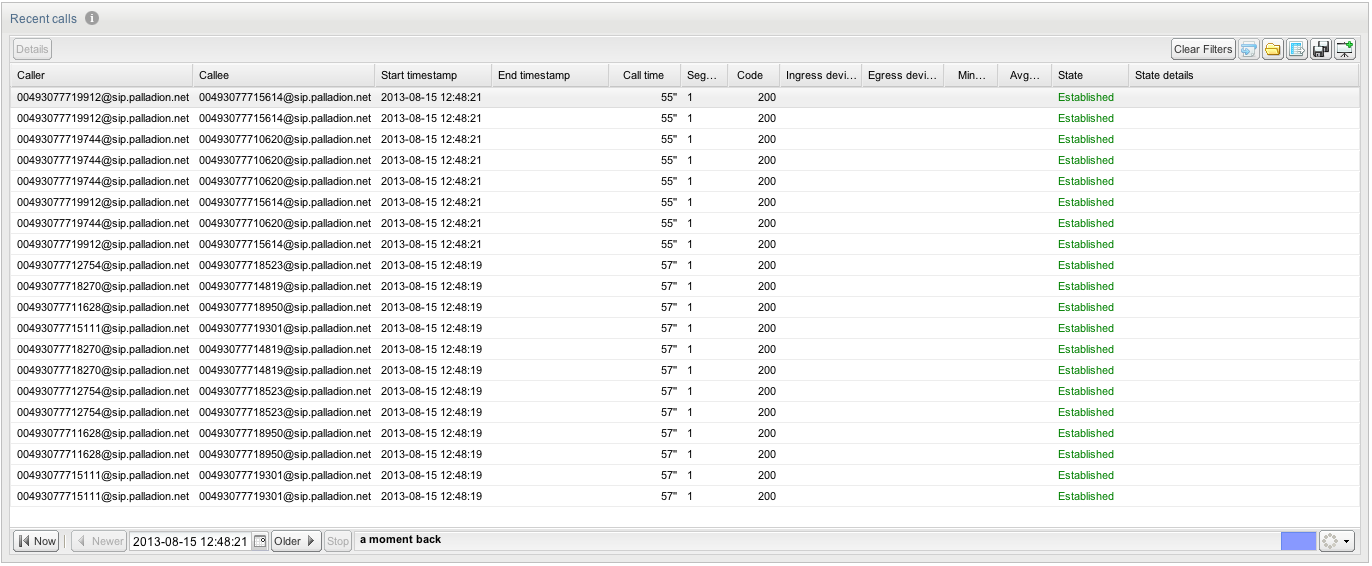
Recent Calls Table
Table 4-2 describes the columns of the Recent Calls table:
Table 4-2 Recent Calls Table Columns
| Column | Description |
|---|---|
|
Avg. MOS |
The voice quality estimation for Finished calls. If Operations Monitor does not receive RTP traffic, or the RTP module is not loaded, this field is empty. The value is displayed in green, orange, or red depending on the thresholds set in the system options High Threshold for MOS and Low Threshold for MOS. For more information about how Operations Monitor estimates the MOS value of a call, see "Voice Quality". |
|
Avg RTCP delay |
The average round-trip delay time reported by RTCP. |
|
Call time |
If the call is Finished, this field represents the call length, measured from the 200 OK message of the INVITE transaction until the first BYE message. If the call is Established, this field represents the time elapsed since the call establishment (the arrival of the 200 OK message of the INVITE transaction) and it is updated on each refresh. If the call is not yet Established, this field is empty. This field has a precision of milliseconds but cannot be filtered for unless the call is Finished. |
|
Call-Transfer |
True if this call has been transferred using the call transfer capabilities in SIP. |
|
Callee |
The user to which the call is addressed. This is usually taken from the To header field of the first call leg. |
|
Callee codecs |
The comma delineated list of codecs proposed in the SDP body by the UAS. Usually this appears in the responses from INVITE transactions and the UAS includes a single codec in the answer, and this is the codec used in the call. On each re-INVITE from inside the dialog, this field is updated to the last proposed list of codecs. By default, this column is hidden. |
|
Callee Initial codecs |
The comma delineated list of codecs proposed in the SDP body by the UAS, usually in the first response from the 'INVITE' transaction. Unlike the Callee codecs, this field is not updated on re-INVITEs. By default, this column is hidden. |
|
Callee IP Address |
IP address of the called user that connected first. It is possible to filter this column by IP address or IP address mask. By default this column is hidden. |
|
Callee User Agent |
The User-Agent string advertised in the 200 OK message of the last call leg. This string usually contains the brand and the firmware version of the SIP device answering the call. If the User-Agent header is not present, the string is taken from the 'Server' header if present. By default, this column is hidden. |
|
Caller |
The user making the call. This is usually taken from the From header field of the first call leg. |
|
Caller codecs |
The comma delineated list of codecs proposed in the SDP body by the UAC, usually in the 'INVITE' message. On each re-INVITE from inside the dialog, this field is updated to the last proposed list of codecs. For example, this is useful for detecting T.38 calls. By default, this column is hidden. |
|
Caller Initial codecs |
The comma delineated list of codecs proposed in the SDP body by the UAS, usually in the first 'INVITE' message. Unlike the Caller codecs, this field is not updated on re- INVITEs. This is useful for gathering statistics about the supported codecs. By default, this column is hidden. |
|
Caller IP Address |
IP address of the device initiating the call. It is possible to filter this column by IP address or IP address mask. By default this column is hidden. |
|
Caller User Agent |
The User-Agent string advertised in the 'INVITE' message from the first call leg. This string usually contains the brand and firmware version of the SIP device making the call. By default, this column is hidden. |
|
Code |
The SIP response code of the last received message from the 'INVITE' transaction. For Failed calls, this represents the SIP error code. |
|
Diversion |
Diversion URI of first Diversion header in call. |
|
Diversion Type |
Diversion type of first Diversion header in call. Possible values are:
|
|
DPC |
Destination Point Codes (DPC) contains the address of the destination for the ISUP call. This is always taken from the first ISUP leg seen by Operations Monitor. |
|
DTMF |
Displays 'Yes' if the there is DTMF information available for this call. Unless the user has the correct rights this field will not be available. |
|
Egress device(s) |
This field contains a comma delineated list of the egress devices for the call, that is through which the call leaves the platform. |
|
End timestamp |
The timestamp of the message that closes the main leg of the call (usually the first BYE message). |
|
Gateway Devices |
As the MEGACO Gateway column contains the IP address of the MEGACO Gate- way, the Gateway Devices column contains its name. |
|
Ingress device(s) |
This field contains a comma delineated list of the ingress devices for the call, that is through which the call enters the platform. |
|
Initiator device |
If the call was started from a SIP device of the platform (for example, a media server), this field contains the name of this device. The call must not be relayed by this device, but actually created by it. Otherwise, the field is empty. By default, this column is hidden. |
|
Max RTCP delay |
The maximum round-trip delay time reported by RTCP. |
|
Media |
Indicates if RTP recordings were requested for this call. |
|
Media types |
Indicates the media types that were negotiated in the call. Multiple media types are separated by a comma (for example: audio, video). |
|
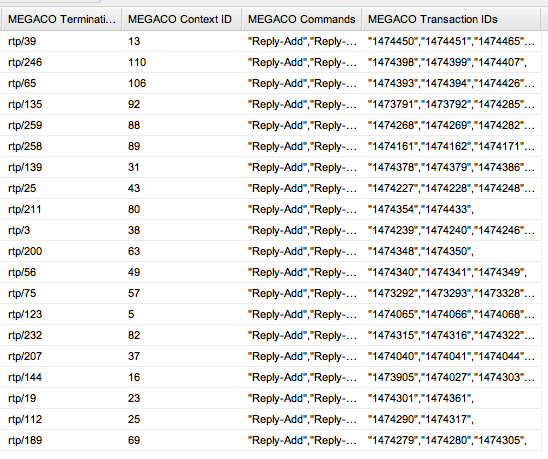
MEGACO Commands |
Commands placed by the MEGACO Gateway Controller to the MEGACO Gateway in a transaction. For example, Commands exist to add/modify/subtract Terminations from the Context. See Figure 4-23. |
|
MEGACO Context ID |
Defines an identifier for each MEGACO connection. See Figure 4-23. |
|
MEGACO Gateway |
IP address of the MEGACO Gateway. |
|
MEGACO Gateway Controller |
IP address of the MEGACO Gateway Controller. |
|
MEGACO Termination ID |
A MEGACO TerminationID is defined for a PSTN line, a channel in a Trunk or rtp stream. Their format is a string like: line/1 or rtp/1 for RTP streams. See Figure 4-23. |
|
MEGACO Transaction IDs |
A MEGACO Transaction is identified by a Transaction ID. See Figure 4-23. |
|
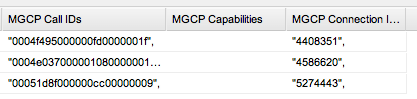
MGCP Call IDs |
Hexadecimal strings of maximum of 32 characters that identify uniquely a call. See Figure 4-24. |
|
MGCP Capabilities |
Defines the capabilities of the endpoints. See Figure 4-24. |
|
MGCP Connection IDs |
The connection identifier is encoded as a hexadecimal string, at most 32 characters in length. See Figure 4-24. |
|
MGCP Gateway IP |
IP address of the MGCP Gateway. |
|
Min. MOS |
The minimum value of the voice quality estimation for Finished calls. If Operations Monitor does not receive RTP traffic, or the RTP module is not loaded, this field is empty. The value is displayed in green, orange, or red depending on the thresholds set in the system options High Threshold for MOS and Low Threshold for MOS. For more information on how Operations Monitor estimates the MOS value of a call, see "Voice Quality". |
|
OPC |
Originating Point Codes (OPC) contains the address of the originator for the ISUP call. This is always taken from the first ISUP leg seen by Operations Monitor. |
|
P-Asserted-ID |
The content of the P-Asserted-ID header from the initial INVITE SIP request. |
|
Preferred Callee Number? |
The number of the callee determined by the configurable number determination mechanism, if available. |
|
Preferred Caller Number? |
The number of the caller determined by the configurable number determination mechanism, if available. |
|
Prefix Group |
Prefix Tags matching this call (0 to n tags). |
|
Q.850 Code |
Q.850 cause code for the ISUP call. |
|
Q.850 Details |
Q.850 Details for the ISUP call. |
|
Q.850 State |
Q.850 State for the ISUP call. |
|
Reason |
The content of the Reason header from the BYE, CANCEL, SIP request or from a failure SIP reply. |
|
Remote-Party-ID |
The content of the Remote-Party-ID or P-Preferred-Identity header from the initial INVITE SIP request. |
|
RTCP streams |
The number of RTCP streams belonging to the call. |
|
Segments |
The number of call legs in this call. By default, this column is hidden. |
|
Setup Delay |
This field represents the time elapsed between the initial' INVITE' message and the first valid network response, like '180 Ringing', '183 Session in progress', '480 Temporarily Unavailable', etc. It fulfills Session Request Delay for RFC6076. If the call contains ISUP, Setup Delay is computed on the first SIP leg. This field has a precision of milliseconds. By default, this column is hidden. |
|
Setup Delay Type |
Shows the type of Setup Delay computed. Can be 'Successful Session Request Delay' or 'Failed Session Request Delay'. By default, this column is hidden. |
|
Setup time |
If the call is Established or Finished, this field represents the time elapsed between the initial INVITE message and the call establishment, marked by the 200 OK answer in the INVITE transaction. If the call is not yet Established, this field is empty. This field has a precision of milliseconds. By default, this column is hidden. |
|
Start timestamp |
The timestamp of the first INVITE or IAM message from the call. |
|
State |
A short text representation of the call state. For more information on the possible values for this field, see "Call States". |
|
State details |
Extra details about the call state. For example, the state of a call can be Proceeding, and this field adds the information: ACK seen, but no final answer. For more information on the possible values for this field, see "Call States". |
|
Terminator device |
If the call was ended by a SIP device (for example a media server), this field contains the name of the device. The call must not be relayed by this device, but actually terminated by it. Otherwise, the field is empty. By default, this column is hidden. |
Figure 4-23 shows examples of MEGACO call details in the Recent Calls panel.
Figure 4-23 MEGACO Details in the Calls Panel
Description of ''Figure 4-23 MEGACO Details in the Calls Panel''
Figure 4-24 shows examples of MGCP call details in the Recent Calls panel.
Figure 4-24 MGCP Details in the Calls Panel
Description of ''Figure 4-24 MGCP Details in the Calls Panel''
Note:
To save horizontal space, several columns are hidden by default. To enable the hidden columns, click the drop-down menu of any column header and select the columns menu sub-menu. For more information, see "Tables".Filtering
You can filter the columns of the Recent calls table for specific criteria. When you apply a single filter, the Filters toolbar displays the label SIMPLE.
Use a simple filter to filter the Recent calls table for one specific criteria.
To apply a simple filter:
-
From the navigation list, select Calls.
-
On the Recent calls table, select the list of options on a desired column.
-
Select the Filters option.
-
Enter or select the filter criteria for the filter.
The table is filtered for the criteria and the toolbar displays the label SIMPLE.
Figure 4-25 shows an example of a filter applied to the Call time column of the Recent calls table. In the example, a filter value has been entered as criteria.
Changing a Simple Filter to an Advanced Filter
To change a simple filter to an advanced filter:
-
On the Filters toolbar, click Edit Advanced.
The (Unnamed Filter) dialog box appears.
-
Click +.
A list of filter fields appears.
-
Select the fields to include in the advanced filter.
-
Click Save.
The Save filters dialog box appears.
-
Enter a name for the filter.
-
Click Save.
The dialog box now displays the name you assigned the advanced filter.
-
Click Hide which closes the dialog box.
Some text-based filter fields can accept queries. In text-based filter fields, you can enter REGEX pattern matching or SQL pattern matching to filter recent calls. REGEX filtering provides slower search times than SQL filtering.
To enter REGEX pattern matching to filter calls, enter the .* character combination before the search values.
When regular expressions are filtered, expressions supported are the same as MySQL 5.5.
The following example uses the REGEX filter:
.*[0049]
To enter SQL pattern matching to filter calls, there are two methods. SQL filtering is faster and more efficient than the REGEX pattern matching. SQL pattern matching is triggered as follows:
-
Entering the SQL wildcard character % into the search field. It can be placed in front of or following the filter value.
-
Entering ^ at the beginning of a string.
Table 4-3 describes the SQL search filters and provides examples of usage.
Table 4-3 SQL Filter Conditions
| Search Filter | Search Example | Description |
|---|---|---|
|
(none) |
|
Filters for strings that contain 0049. |
|
^ |
^ |
Filters for strings that begin with 0049. |
|
% |
or % |
Filters for strings that begin with 0049. Filters for strings that end with 0049. |
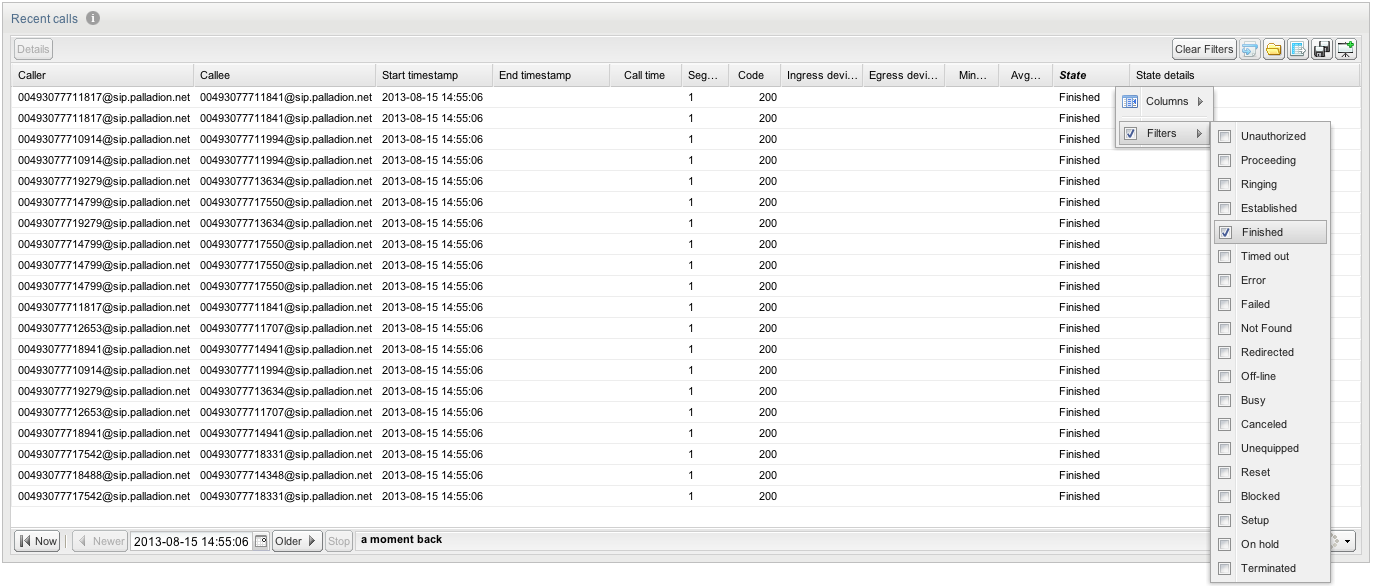
Figure 4-26 shows an example of filtering that selects all finished calls. After the filter is set and the view is refreshed, the total number of finished calls is displayed in the bottom-right corner.
The filtered columns can also be combined to provide more precise answers. For example, to limit the table to all finished calls initiated by SuperTrunk, set the following filters:
-
State to Finished.
-
Ingress device to SuperTrunk.
-
Start timestamp to after 11:00.
-
End timestamp to before 12:00.
See also Figure 4-27.
In this table, filtering can be set from the right-click menu. For more information, see "Right-Click Menu".
Figure 4-27 Filter Finished Calls Initiated by SuperTrunk Between 11:00 and 12:00
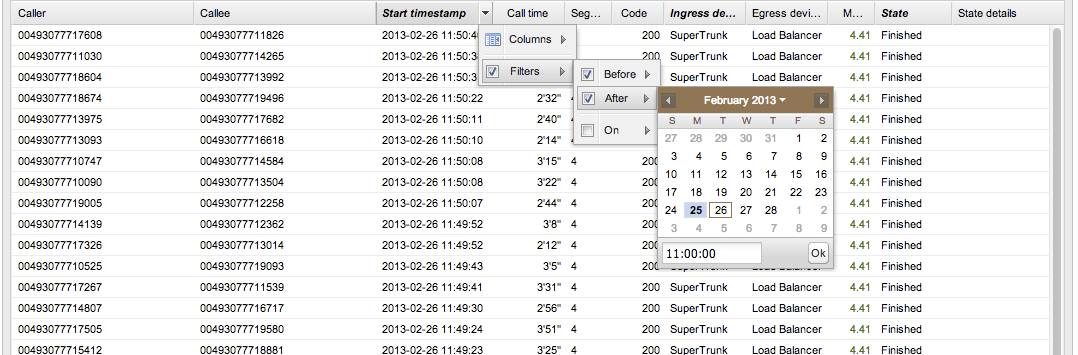
Description of ''Figure 4-27 Filter Finished Calls Initiated by SuperTrunk Between 11:00 and 12:00''
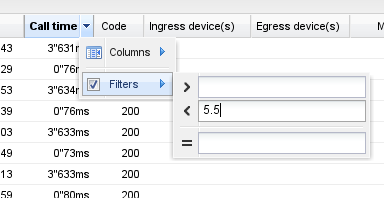
Filtering for this field is done in seconds.For example, in Figure 4-28, all calls that lasted less than 5.5 seconds are selected.
Note:
When filtering for call length, only the finished calls are considered. Thus, it is not possible to filter for all the established calls with a certain call length.To filter the calls list for calls that contain RTP streams, use Media types filter. You can set the Media types filter to list the calls that contain audio, video, text, image, application, message, or other media type.
When Media types filter is used, any call that contains any of the media types is listed. For instance, when the filter is set to audio, any call where audio is one of the media types that was negotiated in the call is listed, for example, a call containing audio and video.
When multiple media types are set in the filter, for example image and video, any call where image or video is one of the media types that was negotiated in the call is listed, for example, a call containing image and audio.
Advanced Filtering
You can create advanced filters to filter the Recent calls table for specific combinations of results. Advanced filters enable you to select a specific combination of columns from the Recent calls table, then enter criteria against which to filter for matching calls.
See Table 4-2 for details on the metrics available in the Recent calls table columns.
Some filter types require that you customize the logic that is applied in the filter. You can customize the logic by toggling options or entering specific criteria to be matched in each advanced filter you create. The logic that can be customized depends on the combination of filters selected.
When an advanced filter has been created, the Filters toolbar displays the label ADVANCED.
Note:
Advanced filtering requires higher resource consumption. Complex advanced filters utilize more system resources and may impact overall system performance.Working with advanced filters involves the following tasks:
To create an advanced filter:
-
From the navigation list, select Calls.
-
On the Filters toolbar, click Clear which removes any applied filters.
-
On the Filters toolbar, click Edit Advanced.
The (Unnamed Filter) dialog box appears.
-
Click +.
A list of filter fields appears.
-
Select fields to include in the advanced filter.
-
Click Save.
The Save filters dialog box appears.
-
In the Name field, enter a name for the filter.
-
Click Save.
The (Unnamed Filter) dialog box is now named the title you assigned the advanced filter.
-
Click Hide which closes the dialog box.
Adding Criteria to an Advanced Filter
To add criteria to an advanced filter:
-
From the Filters list, select an advanced filter.
-
Click Edit Advanced.
A filter dialog box appears.
-
Click +.
-
Select fields to include in the advanced filter.
Repeat this step to add additional fields.
Tip:
You can drag column headings from the Recent calls table into the dialog box. -
In the filter dialog box, customize the logic of the filter you choose by entering or selecting logic values to filter for.
-
Click Save.
-
Do one of the following:
-
Click Apply Now which applies the filter to the Recent calls table.
-
Close the dialog box and apply the saved filter at a later time.
-
Adding Scope to an Advanced Filter
You could create an expression with criteria a, b, and c. You can include brackets in the filter criteria to isolate terms that are dependent on each other, such as:
(a = 2 AND b = 4) OR c = 10
or
a = 2 AND (b = 4 OR c = 10)
To add scope to an advanced filter:
-
From the Filters list, select an advanced filter.
-
Click Edit Advanced.
The filter dialog box appears.
-
Click () in the row you want to add scope to.
-
Click + in the same row and insert filter conditions.
Note:
You can move filter criteria within a dialog box by dragging it to a new area.Tip:
You can drag criteria in to or out of bracketed statements. -
Click Save.
-
Do one of the following:
-
Click Apply Now to apply the filter to the Recent calls table.
-
Close the dialog box and apply the saved filter at a later time.
-
To edit and advanced filter:
-
From the Recent calls window, select an advanced filter.
-
Click Edit Advanced.
The filter dialog box appears.
-
Edit the filter criteria.
-
Click Save.
-
Do one of the following:
-
Click Apply Now to apply the filter to the Recent calls table.
-
Close the dialog box and apply the saved filter at a later time.
-
To apply an advanced filter:
-
From the Recent calls window, select an advanced filter.
-
Click Edit Advanced.
A filter dialog box appears.
-
Click Apply Now and close the dialog box.
To clear advanced filters:
-
From the Filters toolbar, select Clear.
Toolbar
The Recent calls table has, in order, the actions as listed in Table 4-4.
Table 4-4 Recent Calls Table Actions
| Actions | Description |
|---|---|
|
Details |
Opens the Call Details window for the selected call. See Figure 4-33. |
|
Filters: |
Select from the list of advanced filters. |
|
Edit Advanced... |
Opens the selected filter for editing. |
|
Save |
Saves the changes to the advanced filter. |
|
Clear |
Resets any selected filters. |
|
Message flow |
Shows the message flow diagram for the selected calls. You can select multiple calls in the call grid and show a combined message flow diagram. Use the Ctrl key on Windows/Oracle Linux machines and the Cmd key on Macintosh machines. For more information, see "Working with Message Flows". |
|
Bulk export |
Exports the current calls grid contents (with the current set of filters applied) as a zip archive. The archive contains one .csv file which is similar to the one generated with the normal CSV export (see above), but with an additional column named pcap_filename. This references one of the pcap files included in the archive, which contains both SIP and RTP data for the call. If column filters are set, they are also applied to the exported CSV file. It is recommended to filter the calls list to the set of interest before exporting the CSV file. |
|
CSV export |
Exports the calls data content in CSV format, for post-processing purposes. If column filters are set, they are also applied to the exported CSV file. The CSV files are truncated to 50 thousand records. It is recommended to filter the calls list to the set of interest before exporting the CSV file. |
|
View saved calls |
Shows the list of already saved calls in Operations Monitor. In order to save a call, the Save option from the calls details page must be used. |
|
Show in Dashboard |
Adds a reduced version of the Recent calls table to the Dashboard. |
|
Auto-Refresher |
From the Refresh menu, the table can be set to auto-update, in order to display the most recent calls and their state changes in real-time. You can set the table to auto-update from the Refresh menu in order to display the most recent calls. The state changes in real-time. For more information, see "Refresh Button". The default auto-refresh interval for this table is 5 seconds. |
Right-Click Menu
Right-clicking a row in the Recent calls table shows the following contextual options:
-
Track caller and Track callee
Choosing one of these two options opens the User Tracking page, pre-filled with the caller or the callee user of the selected call. For more information, see "User Tracking".
-
Create trace with
Choosing this option opens the Traces page, pre-filled with the caller or the callee user of the selected call. For more information, see "Traces".
-
Record media of caller and Record media of callee
Choosing one of these two options opens the Record media for a new user window. For more information, see "Media Recording".
-
Call details window
Choosing this option opens the Call Details Window. For more information, see "Call Details Window".
-
Message Flow
Shows the message flow diagram for the selected call. For more information, see "Working with Message Flows".
-
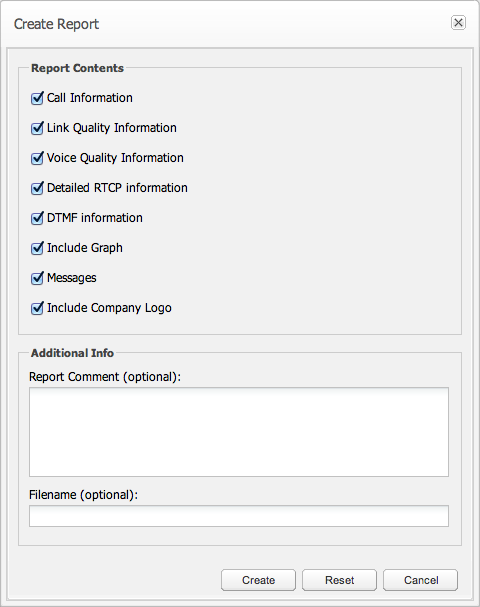
PDF report
Creates a PDF report for the selected call. A dialog appears that allows the user to select the information to include, and to provide a comment to add to the report (see Figure 4-29).
-
Filter table for ...
Shortcut to column filters. This gives a convenient way of finding calls that are similar with the one selected. See Figure 4-30.
Figure 4-30 Filter Using the Right-Click Menu
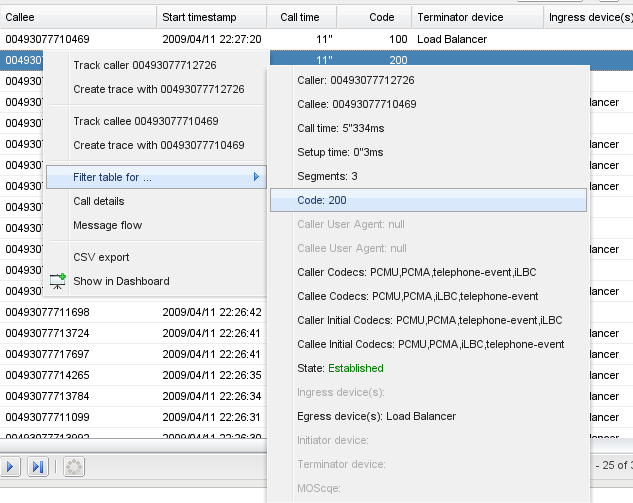
Description of ''Figure 4-30 Filter Using the Right-Click Menu''
Paging
The paging bar allows you to navigate the entries. With the Newer and Older buttons you can step to the next page of newer respective older entries (see Figure 4-31).
The Now button takes you to the first page, showing the newest entries. The date picker allows you to chose an arbitrary first date and time of the time period you want to view (see Figure 4-32).
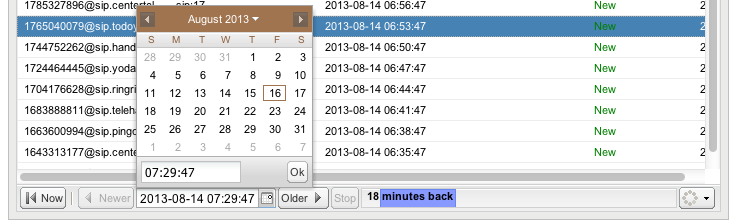
The loading bar will show when entries are being fetched. To fill up a page while applying filters, this might require several calls to the server and might take some time. The blue bar in the loading bar shows the range that has been searched.
The refresh button to the right reloads the current entries and shows their updated states.
You can also set the refresh button to auto-refresh mode.
Note:
The auto-refresh mode in combination with filtering of a grid can lead to longer refresh times than selected.Call Details Window
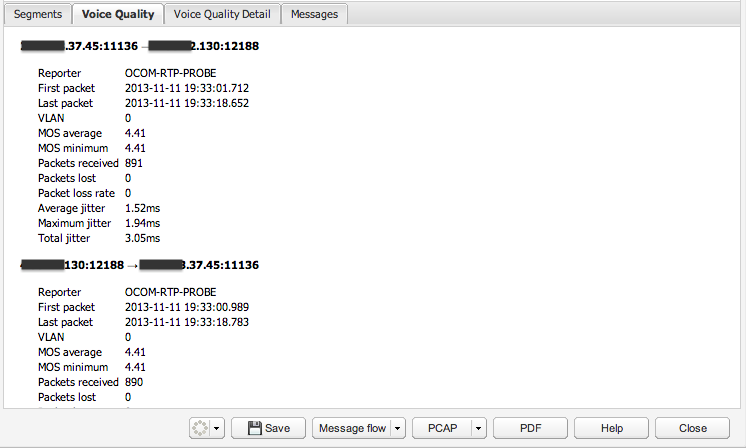
To open the call details panel (see Figure 4-33), double-click on a row from the Recent Calls table or click the Details button from the toolbar. You can also access the call details panel from the Voice Quality page. For more information, see "Voice Quality".
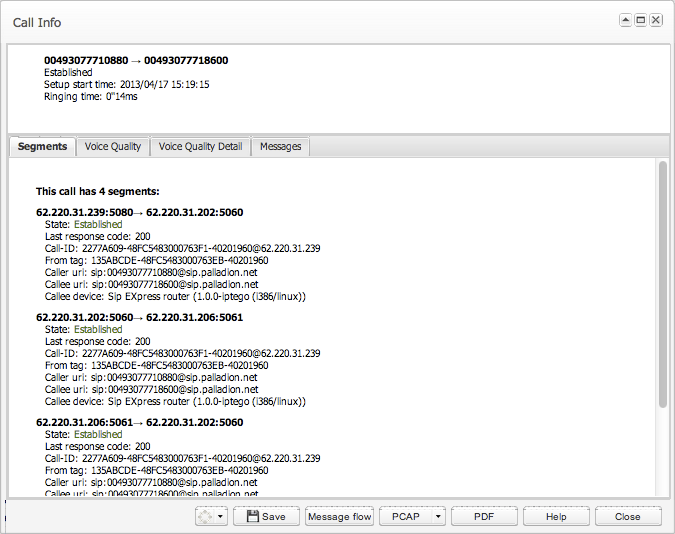
The top section contains a brief identification of the call: the numbers involved, current state, starting time, ringing, and call duration. Right-clicking on the numbers or user names shows a contextual menu, as shown in Figure 4-34. For more information on these options, see "User Tracking".
Figure 4-34 Right-Click Menu for the Caller and Callee
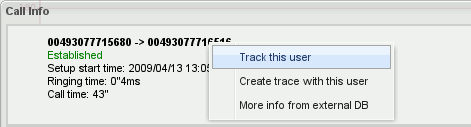
Description of ''Figure 4-34 Right-Click Menu for the Caller and Callee''
The bottom section contains four tabs: Segments, Voice Quality, Voice Quality Detail and Messages.
Segments
The Segments tab (see Figure 4-33) shows details about each call leg within the call, including:
-
State, per call leg.
-
Call-ID.
-
From and To tags.
-
Request-URI.
-
Caller and callee devices.
-
Source and destination devices set with Platform Devices. For more information, see "Platform Devices".
Voice Quality
The Voice Quality and Voice Quality Details tabs display the voice quality summary of the finished calls. It displays source and destination devices when set in Platform Devices. For more information, see "Voice Quality" and "Platform Devices".
Figure 4-35 Call Details Voice Quality Tab
Description of ''Figure 4-35 Call Details Voice Quality Tab''
Messages
The Messages tab shows a table representation of the messages from the call (see Figure 4-36).
Table 4-5 lists the table columns:
| Column | Description |
|---|---|
|
Date and Time |
The absolute time when this message was seen by Operations Monitor. |
|
Details |
In case of SIP messages, it is equal to Request-URI for SIP requests, or the reason phrase for SIP replies. In case of ISUP messages, it is equal to point codes. In case of ENUM messages, an example might be 8.4.1.1.7.7.9.7.9.7.4.4.e164.arpa. In case of MEGACO messages, an example might be Add or Modify. |
|
Dst IP |
The destination IP address and port number. |
|
Dst MAC |
The destination hardware address. This column is hidden by default. |
|
Dst PC |
The destination PC address. This column is hidden by default. |
|
Message |
In case of SIP messages, it is equal to the SIP method for SIP requests, or the response code for SIP replies. In case of ISUP messages, it is equal to one of the ISUP method types: IAM, ACM, RLC, etc. In case of MEGACO messages, it is equal to either MEGACO Request or MEGACO Reply. In case of ENUM messages, it is equal to either ENUM Query or ENUM Answer. |
|
Proto |
The transport layer protocol. The supported transport protocols are UDP and TCP. |
|
Src IP |
The source IP address and port number. |
|
Src MAC |
The source hardware address. This column is hidden by default. |
|
Src PC |
The source PC address. This column is hidden by default. |
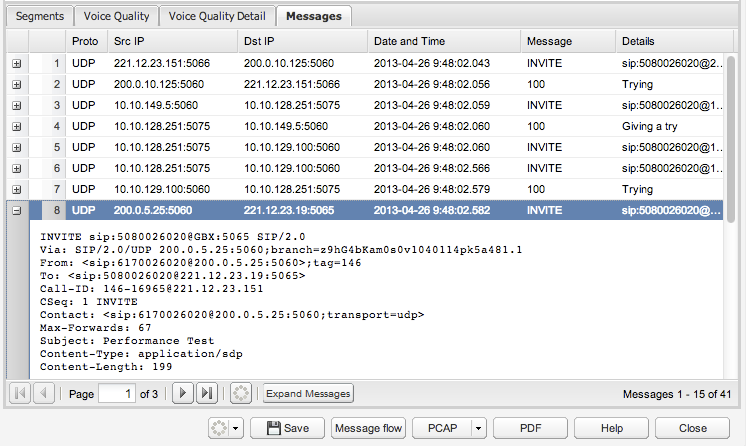
Click the Expand Messages button to view the raw messages as seen on the network. The raw messages can be also viewed in context in the message flow diagram.
Call Details Toolbar
You can save the call details for debugging later.
Click the Save button to save all the call details, including the raw messages and voice quality information.
Click the PCAP button to download the raw signaling messages and the media streams of a call into PCAP file format. See "Downloading Call Details to a PCAP File" for more information.
Click the PDF button to create a PDF report for the call with details about segments, raw messages and voice quality information.
Click the Message flow button to open the message flow diagram.
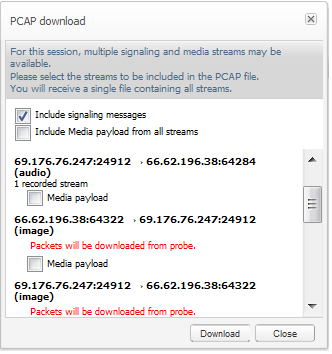
Downloading Call Details to a PCAP File
You can save the raw signaling messages and the media streams of a call to a PCAP file. When a call has multiple media streams, a single PCAP file is created containing all the streams.
To save the call details to a PCAP file:
-
In the call details panel, click the PCAP button.
The PCAP download dialog box appears, as shown in Figure 4-37.
If the media stream is not already saved on the Operations Monitor system, it is downloaded from the Probe.
Note:
If the media packets are no longer available on the Probe, the PCAP file will not contain the packets of those streams. -
Select the media streams you want to save. The content available for downloading depends on your user permissions.
Note:
Downloading media streams from the Probe generally takes more time than downloading from the Operations Monitor system. -
Click the Download button.
The Export status dialog box appears, which contains a link to the PCAP file that is generated for the call.
-
Click the PCAP file link.
-
Select the option to save the file, and click OK.
Device Visibility in Realms
Device visibility in a realm works as a whitelist for visible devices and a blacklist for hidden devices. By default (if no visibility is set for device), users can see all information for every device.
If the user belongs to a realm which has limited device visibility (only some devices are visible to the realm):
-
Information about call segments between visible devices are shown.
-
Information about call segments between visible devices and hidden devices are not shown.
-
Information about call segments between visible devices and unknown hosts are shown. An unknown host is a host that does not belong to any device. To hide this information from the realm, create a new device for the respective unknown host and set it as hidden for this realm.
This behavior affects the call information on the Segments and Messages tabs, in the message flow diagram, PCAP, and PDF generation.
Voice Quality
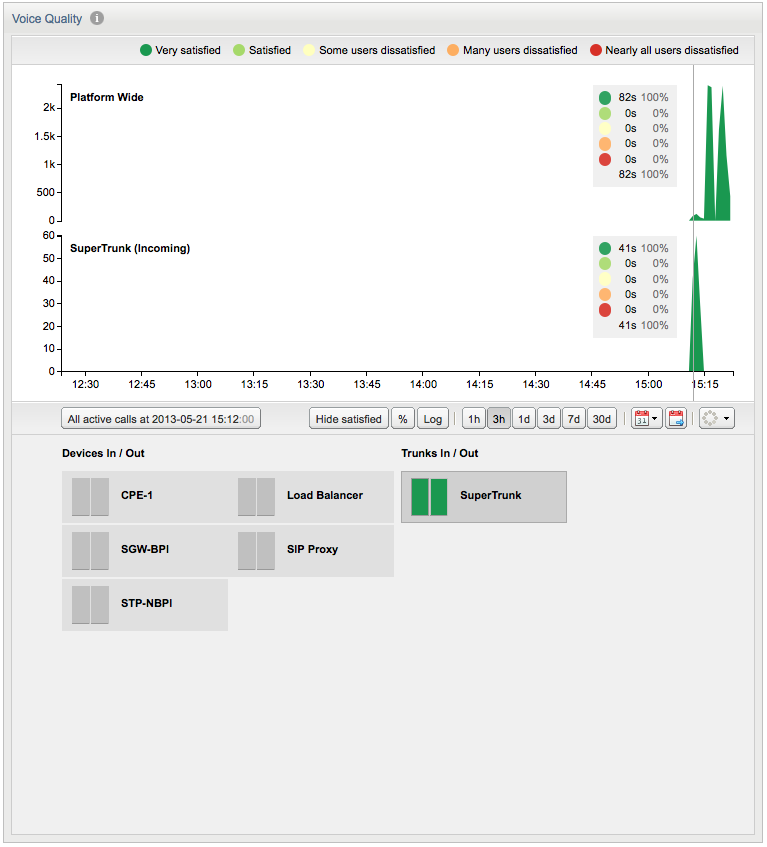
Under Operations of the main menu, the Voice Quality page allows you to analyze the transmission effects of the network on the voice quality as perceived by the users of the VoIP platform. It provides a graphical overview for both platform-wide calls and device specific calls.
Voice Quality Source
Operations Monitor gathers voice quality information from four sources:
Operations Monitor RTP Probes
Probes monitor the traffic in passive mode and record several measures for each RTP stream:
-
The number of lost packets.
-
The variance of delays between the received packets (jitter).
-
The distribution of lost packets inside the stream.
-
The codec used.
Based on these values, Operations Monitor uses the ITU E-Model to estimate the MOS.
The following restrictions apply:
-
MOS is calculated for blocks of 10 seconds (chunks), if a chunk contains more than eight seconds of RTP data and contains only packets of a single supported codec.
-
No MOS is calculated if a chunk contains multiple payload types other than the telephone- event (DTMF). That is a change in audio codec or comfort noise packets will prevent MOS computation.
Supported codecs for MOS calculation:
-
AMR-NB
-
AMR-WB
-
G.711 A-law (PCMA)
-
G.711 u-law (PCMU)
-
G.723.1
-
G.726
-
G.728
-
G.729
-
iLBC
-
OPUS
-
Speex
User Agent Statistics
Some SIP devices have the capability to include RTP statistics in a BYE message header, or in the reply to the BYE message. In general, the information provided is not enough to estimate the MOS, with the exception of the 'X-RTP-Stats' version 3 header.
Table 4-6 User Agent Headers Providing RTP Stats
| Header Name | Devices | Data Provided |
|---|---|---|
|
X-RTP-Stats (v2) |
AVM |
packet loss, jitter, burst lost, codecs. |
|
X-RTP-Stats (v3) |
AVM |
packet loss, jitter, burst lost, gaps, codecs. |
|
P-RTP-Stats |
Cisco, Linksys, Sipura |
packet loss, end-to-end latency, burst lost, codecs. |
|
RTP-RxStats |
Snom |
packet loss. |
SIP Voice Quality Events (application/vq-rtcpxr)
Some SIP devices (like: Polycom and Snom) are able to send voice quality information derived from RTCP-XR messages to Operations Monitor's voice quality collector, configurable under VQ Collector Configuration. Operations Monitor gets the values of jitter, packet loss, burst loss, and MOS from the voice quality collector to display them under the Call details info page.
Operations Monitor only reports data for end of stream statistics (CallTerm marker, refer to RFC 6035).
RTCP reports may be generated by endpoints. Such data may not be present or may not be trustworthy. Due to this we do not consider RTCP quality information for our own voice quality metrics. Nonetheless we display RTCP information to complete the view on the voice quality experienced by the users.
Other Voice Quality Monitors
Oracle Communications SBCs can be configured to forward Voice Quality data to Operations Monitor. Operations Monitor relays this information through its intuitive UI.
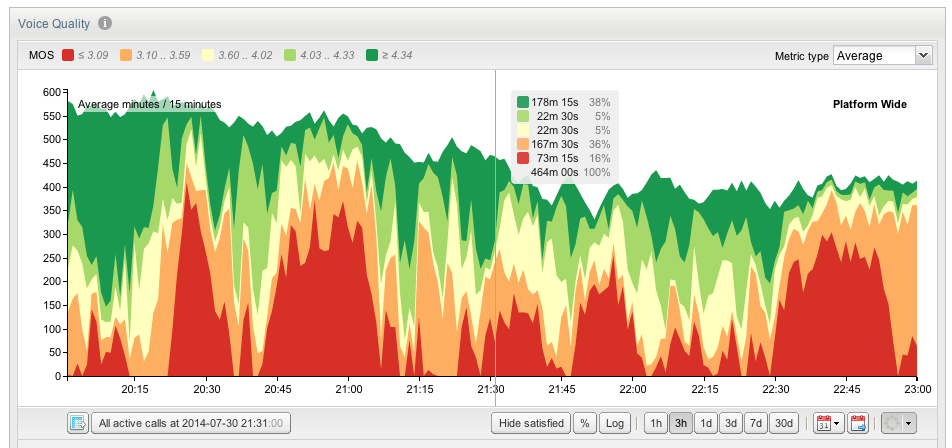
Voice Quality Chart
The Voice Quality page shows a stacked area chart. Five series are displayed, each based the levels of user satisfaction as specified by ITU recommendation G.107.
-
Very satisfied: MOS >= 4.34
-
Satisfied: 4.03 <= MOS <= 4.33
-
Some users dissatisfied: 3.60 <= MOS <= 4.02
-
Many users dissatisfied: 3.10 <= MOS <= 3.59
-
Nearly all users dissatisfied: MOS <= 3.09
We analyze the quality of a media stream over a time interval of either one or 15 minutes (determined by the Voice Quality Chart Scale in Minutes/Minute system setting) and determine how many minutes and seconds were spent in each of the above MOS ranges. For more information, see "Voice Quality Chart Scale in Minutes/Minute".
Over a minute a stream may have had 40 seconds with a MOS of >= 4.34, 10s between 4.34 and 4.03, and another 10s between 3.60 and 3.10. If using a 15 minute interval, the values are normalized accordingly to project the average minute and seconds over a 15 minute time period.
In this case, with 40 seconds over one minute of MOS of >= 4.34 is 00:40 minutes, but normalized over a 15 minute interval it is 10:00 minutes.
We sum up all the minutes of MOS >= 4.34 across all active media streams. This determines the height of the area labeled >= 4.34 at T=12:01.
The chart's resolution and range can be controlled with the toolbar directly below it (see Figure 4-38).
The toolbar offers couple of more options:
-
Display the active calls during a period of bad voice quality.
-
Hide statistics about streams with satisfactory quality (do not show the two best categories).
-
Switch to a percentage scale.
-
Switch to a logarithmic scale.
Additionally, you can select metric with the drop-down in the upper-right corner of the diagram. The metrics are Average (default) and Maximum.
The reason for using the Maximum metric is that for older data only hour resolution is available. A peak that happened during a couple of minutes will then be flattened out when calculating the average over one hour. By preserving the maximum value over a time period, the peaks can still be detected in old data.
When aggregating maximum values from minute to hour resolution, the sum of minutes of all voice quality levels will most likely be greater (at least equal) than that of the minute resolution. This is because the maximum value for each voice quality level over 60 minutes will be chosen.
Note:
Only voice quality measurements calculated by the Operations Monitor probes are shown in this chart. This monitoring has certain limitations:-
Voice quality (MOS) is calculated for blocks of 10 seconds (chunks), if a chunk contains more than eight seconds of RTP data of a single supported codec. For more information, see "Operations Monitor RTP Probes".
-
Chunks shorter than one second or with less than 50 packets are normally not shown.
-
Streams containing larger gaps (that is due to comfort noise) might be shown as two separate streams.
-
Streams that are not matched to calls (no correlation between SDP record received in a SIP message and RTP IP/ports) are not included in Operations Monitor's KPIs.
CSV Export
You can export voice quality data for the displayed period by pressing the CSV export button. The CSV export dialog will open, and when ready provide you with a downloadable CSV file.
Table 4-7 lists the fields that are exported:
| Name | Format | Example |
|---|---|---|
|
Local timestamps |
human readable |
2014-07-25 13:42:00 |
|
UTC timestamps |
ISO 8601 |
2014-07-25T11:42:00Z |
|
Interval |
integer |
60 |
|
MOS: 0 .. 3.09 |
integer |
300 |
|
MOS: 3.10 .. 3.59 |
integer |
329 |
|
MOS: 3.60 .. 4.02 |
integer |
28 |
|
MOS: 4.03 .. 4.33 |
integer |
255 |
|
MOS: 4.34 .. 5 |
integer |
212 |
The MOS fields contain the number of seconds of each voice quality level, for the time period given in seconds in the Interval field. The interval depends on the available resolution for the time period: either minute or hours. If minute resolution values are available, Interval is typically 60, otherwise 3600. The Interval can in rare cases be less than 60 or 3600, if the machine was rebooted or was down when the measurement period started.
Minute values are only available for the last couple of days.
Active Calls During a Period of Bad Quality
Selecting a time on the main chart will update the Active calls button below the chart. This button navigates to the calls page, appropriately filtered to display only calls active at that time.
Device Voice Quality Charts
To help diagnose areas of particularly bad MOS, clicking on the main chart at time T loads the Voice Quality data for all platform devices at that time. The MOS stats for a device are displayed next to it. The devices are sorted by MOS quality, those with bad quality at the selected time are listed first.
Clicking on a device augments the main chart with a second chart displaying the Voice Quality for the currently active time resolution and range (see Figure 4-39).
Media Summary
You can see the media summary information of any call listed in the Calls table.
To view the media summary details:
-
Double-click a row in the Calls Table.
The Call Info window opens.
-
Click the Media Summary tab which opens a textual report of the voice quality data for the call.
Table 4-8 describes the fields in the Media Summary tab.
Table 4-8 Media Summary Fields
| Field | Description |
|---|---|
|
Average jitter |
The average of the measured jitter values of the 10 seconds intervals |
|
Average MOS |
The average of the estimated MOS values of the 10 seconds intervals |
|
First packet |
The time stamp of the first RTP packet from the stream |
|
Last packet |
The time stamp of the last RTP packet from the stream |
|
Maximum jitter |
The maximum of the measured jitter values of the 10 seconds intervals |
|
Minimum MOS |
The minimum of the estimated MOS values of the 10 seconds intervals |
|
Packet loss rate |
The number of received RTP packets divided by the number of expected RTP packets |
|
Packets lost |
The total number of RTP packets that were lost for this stream. This can have multiple causes:
|
|
Packets received |
The total number of RTP packets that were received in the stream |
|
Reporter |
The source of the report:
|
|
Total jitter |
The sum of the measured jitter values of the 10 seconds intervals |
|
VLAN |
The VLAN tag of the RTP packets |
Media Details
The Media Details tab displays an estimation of the MOS value for each RTP stream. This data is collected by Operations Monitor RTP probes or may be provided by SBCs in interim media QoS reports. The data is arranged on a grid in 10 second intervals.
You can see the media details grid for any call listed in the Calls table.
To view the media details grid:
-
Double-click a row in the Calls table.
The Call Info window opens.
-
Click the Media Details tab which opens a grid report of the media details for the call.
-
Hover over any block on the grid; a tooltip displays data for the interval.
Note:
Voice quality report intervals may align differently on the grid, depending on the data source. Intervals reported by Session Monitor probes are aligned to a global grid at 10-second boundaries. Intervals reported by SBCs may not be aligned to this grid because they are provided every 10 seconds after the stream began.Media Recording
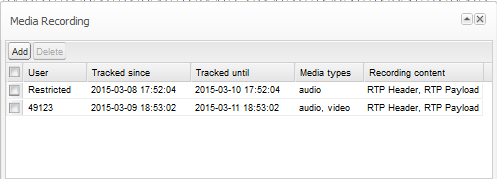
The Media Recording feature allows you to capture RTP (including DTMF) and RTCP streams of calls, in addition to the signaling messages, to track particular user's calls. You can then download the RTP and RTCP streams to a PCAP file for further analysis in protocol analyzer tools. This is helpful for analyzing voice quality issues and for complying with regulations.
Figure 4-40 illustrates the Media Recording table, which lists the users that are currently tracked.
Figure 4-40 Users Tracked in Media Recording
Description of ''Figure 4-40 Users Tracked in Media Recording''
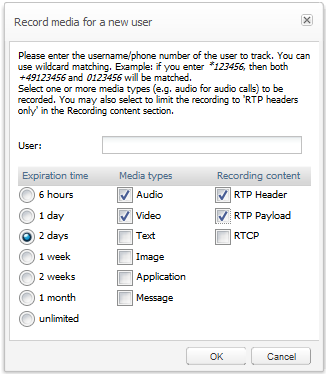
To start capturing RTP and RTCP streams, you set up recording rules. A recording rule specifies the subscriber to track, how long to track the subscriber's calls, the media types to record, and the contents to record.
Figure 4-41 shows the dialog box for specifying a media-recording rule.
Figure 4-41 Media Recording Rule Configuration
Description of ''Figure 4-41 Media Recording Rule Configuration''
Media Recording allows you to record calls with multiple media types, for example, a call containing audio and video or audio and image.
Note:
To record audio using Media Recording, you must enable the RTP Recording feature on both the Mediation Engine and the Probe. To record all other media types, including video and image, you must enable the Packet Inspector extension on both the Mediation Engine and Probe. All media types will display even when Packet Inspector extension is not enabled. Packet Inspector is not required for recording audio. See Session Monitor Installation Guide for more information about enabling these features.The content that is available for recording depends on the user permissions. For example, the user may have permissions to download RTP header but not RTP payload.
When the recording content is restricted to RTP Headers only, the system records the following:
-
RTP headers for RTP traffic (audio, video, text, T.38 over RTP)
-
UDP headers plus the first two bytes (sequence number) for T.38 over UDPTL
-
TCP headers only for TCP-based media
Operations Monitor saves the RTP and RTCP packets for all calls made or received by the subscribers that are tracked in Media Recording. For example, if the expiration time is 2 days, then for two days the system tracks all calls made or received by the subscriber and records the calls that match the rule.
The Tracked until column in the Media Recording table shows the expiration time. After the expiration time, the recording rule is deleted. This prevents the recording rules list from becoming too long.
All users with the same realm assigned can share a recording job. Users in the realm ALL can view all the recordings in the system.
Recording RTP Streams
To start recording the RTP streams for a subscriber:
-
In the Recent calls panel of the Calls page, click the speaker icon in the menu bar:
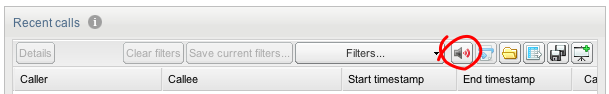
Description of the illustration ''rtp_record_calls_grid.png''
The Media Recording table appears. The table shows the subscribers that are currently tracked.
-
Click the Add button.
The Record media for a new user dialog box appears.
-
In the User field, enter the phone number or the SIP user name to track.
Operations Monitor records for all the SIP user names that match the given pattern as a suffix. This is useful when the same subscriber uses various prefixes. For example, if a subscriber uses both 0123456 and +49123456 phone numbers, enter 0123456, so that both numbers are matched.
-
In the Expiration time section, select the time interval until when the subscriber is tracked.
-
In the Media types section, select one or more media types to record.
-
In the Recording content section, select one or more content to record.
The content available for recording depends on the user permissions.
-
Click OK.
To stop the recording for a particular subscriber, select the user in the Media Recording table and click Delete.
Downloading Recorded RTP Streams
RTP streams are downloaded in the industry-standard PCAP file format. When a call has multiple media streams, you can select the media streams that you want to download. The content available for downloading depends on the user permissions. A single PCAP file is created containing all the streams.
Figure 4-42 shows a call with multiple signaling and media streams.
Figure 4-42 Download the Signaling and Recorded Media Streams
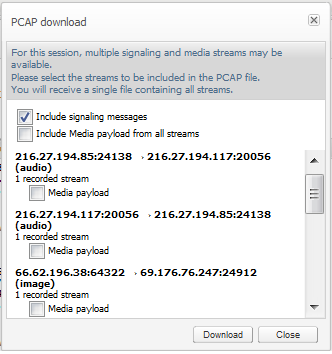
Description of ''Figure 4-42 Download the Signaling and Recorded Media Streams''
To download the recorded RTP streams for a call:
-
In the Recent calls panel on the Calls page, double-click a call that is made or received by the tracked user.
The Call Info dialog box appears.
-
In the Call Info dialog box, click the PCAP button.
The PCAP download dialog box appears.
-
Select the recorded streams you want to save.
-
Click the Download button.
The Export status dialog box appears, which contains a link to the PCAP file that is generated for the call.
-
Click the PCAP file link.
-
Select the option to save the file, and click OK.
Registrations
The Registrations page allows you to examine the registration events detected on the monitored platform. Examples of these events are: a SIP device tries to publish itself as an on-line entity willing to engage itself in communication with other devices, changes this status to off-line, or queries a central authority about this status. Registration events are generated using the SIP protocol method 'REGISTER'.
The Registrations page contains two panels: the first is the Registered Users panel, which provides an overview of the number of registered devices and the fluctuation over time, and the Registrations Table, which groups the events for one subscriber (one AOR in SIP terminology) and gives more details.
Registered Users Panel
The top panel contains a chart that traces the total number of registered users over time. The sampling interval is 1 minute for drawing the sample's minimum, maximum, and average values.
By default, a window of three hours is presented. The time frame can be adjusted and the chart allows for panning. For more information on using charts, see "Charts".
Figure 4-43 Registered Users Panel While Dragging Time Window
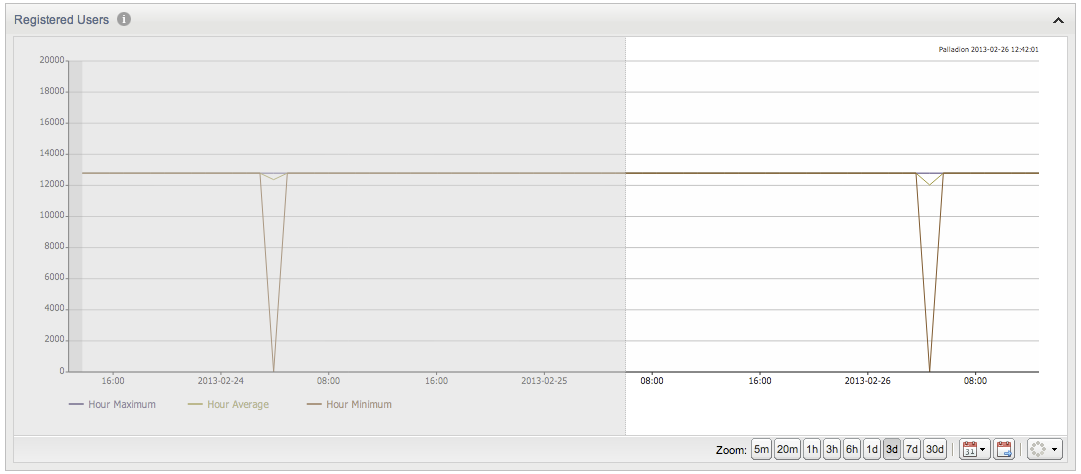
Description of ''Figure 4-43 Registered Users Panel While Dragging Time Window''
Note:
If Operations Monitor has no registration information over a period of time (due to factors like recent start up, downtime, or lack of traffic), that interval is indicated in the chart by a gray area (as seen on the left side of Figure 4-43).Registrations Table
The Registrations panel contains a table of the registrations events, grouped by SIP user. The list is ordered chronologically, presenting the latest event as the first entry by default. The table can be resorted and/or filtered. For more information, see "Filtering".
Note:
If the system setting Group New Registrations from the Same User is true, duplicate registration events in state 'New' from the same users are grouped together. However, since the grouping is done on each requested chunk, duplication removal over different chunks does not work.Table 4-9 lists the column descriptions for the Registrations table:
| Column | Description |
|---|---|
|
User |
Contains the user part of the AOR; if the system setting Use users domains is enabled, the domain part is also included in this field. When specifying a filtering token, all users that contain that token (position independent) will be shown. |
|
Contacts |
Filtering is done by matching a given string. All the contacts provided by the registering device are listed here, each as a SIP URI. |
|
Source IP address |
The IP address of the network device that initiated the registration event. Filtering is done by matching a given string. |
|
Destination IP address |
The IP address of the network server targeted by the registering device. Filtering is done by matching a given string. |
|
Timestamp |
The moment in time when the event occurred. Filter by specifying an interval (between Before and After) or a Date (the On date selector). |
|
Device |
The device configured in Settings/Platform Devices that was targeted by the subscriber's device when registering. When trying to filter by a certain device, a list of configured devices is presented out of which one or more can be selected. |
|
Event |
The type of registration event; the table below is detailed on each defined type. For filtering one can choose to filter the presented list to only include some of the possible events. |
|
Code |
The SIP code that the registration message exchange finished with. Filter by specifying any valid SIP reply code. |
Registration Event Categories
Registration events are categorized as follows:
-
Failed
Final response code is bigger than 299.
-
Unauthorized
Two consecutive transactions are answered with 401, or when one 401 transaction is not followed by another REGISTER request in the next 5 seconds.
-
New
Anew contact binding was created for this user.
-
Gone
Another registration request was answered by the registrar, and the binding was not found in the response.
-
Expired
A binding is considered expired when the time interval specified in the 'expires' parameter from the registrar's answer is over. No messages are associated with this type of event.
Registrations Table Actions
The Registrations table provides a few action buttons.
-
Click the Registration details button when a row is selected in the table, and a window appears containing more details for individual registration events; this window can be also opened by simply double-clicking on the selected row in the table.
-
Click the Message flow button to open a SIP message flow diagram window that depicts the network entities involved and message exchange of the registration event.
-
The CSV export button allows to have all table entries exported into a CSV file. If the contents of the table have been filtered, the contents of the exported CSV file will only contain the filtered results.
Note:
Many of these actions are available by right-clicking (see Table 4-9).Right-Click Contextual Menu
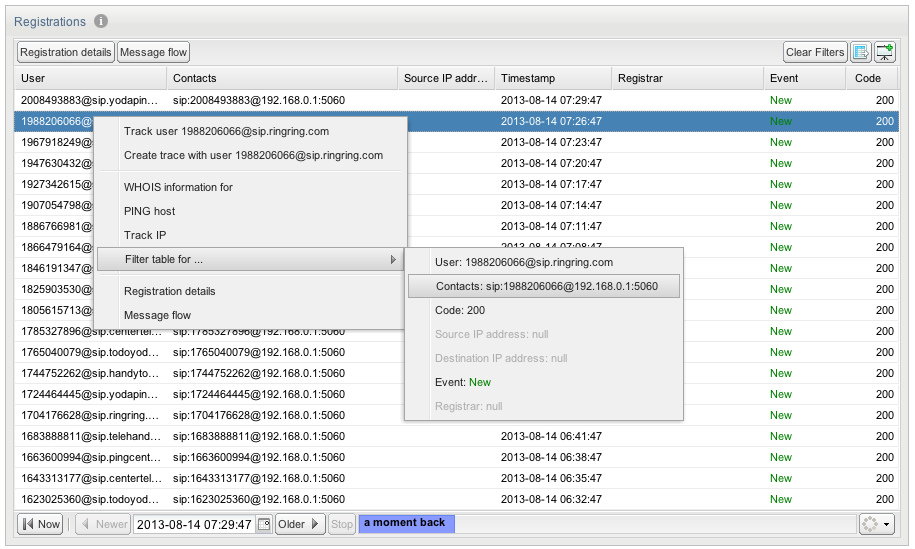
Right-click menu actions are as follows:
-
Filter table for ... allows you to filter for:
-
Other registration events of the same user or contact.
-
The same code or event type.
-
All registrations involving the same address or device.
-
-
WHOIS information for ... allows you to inquire who is the owner of the IP used as the source of the registration. A window appears that contains the record stored into the WHOIS database for the given address.
-
Create trace with user ... loads the Traces page with the User field pre-filled with the value taken from the corresponding registration event.
-
Track user ... loads the User Tracking page with the User field pre-filled in the search panel taken from the event.
Paging
The paging bar allows you to navigate the entries. With the Newer and Older buttons you can step to the next page of newer respective older entries (see Figure 4-45).
The Now button takes you to the first page, showing the newest entries. The date picker (see Figure 4-46) allows you to choose an arbitrary first date and time period.
The loading bar will show when entries are being fetched. To fill up a page while applying filters, this might require several calls to the server and might take some time. The blue bar in the loading bar shows the range that has been searched.
The Refresh button to the right reloads the current entries and shows their updated states.
You can also set the Refresh button to auto-refresh mode. Please note that auto-refresh mode in combination with filtering of a grid can lead to longer refresh times than selected.
Registration Details
The details window for a registration event contains the following information:
-
The user of full AOR (subjected to settings).
-
The timestamp when the event occurred.
-
The network entity of the platform having received the registration request (the ingress device).
-
The IP address used to originate the requests.
-
The type of registration event.
-
A table that contains details about the exchanged messages in this event, listed in chronological order.
Table 4-10 lists the columns in Registration Details window.
Table 4-10 Registration Details Window
| Column | Description |
|---|---|
|
Proto |
The network transport protocol used to carry the SIP messages from client to the platform. This field can be either UDP or TCP. |
|
Source |
The IP address of the device that generated the message; can be either the client's or one of platform boxes, depending on the direction. |
|
Source Hwaddr |
The Ethernet address of the device that relayed the network packet just before being mirrored to Operations Monitor. |
|
Destination |
The IP address of the device that received the message; just as with Source, it can be either the client's or platform's. |
|
Destination Hwaddr |
The Ethernet address of the device that received the network packet just before being mirrored to Operations Monitor. |
|
Date and Time |
The moment in time when the mirrored network packet was received by Operations Monitor. |
|
Method/Code |
The type of SIP request or code returned in reply. |
|
RURI/Reason |
The SIP Request-URI the request was targeted to (for requests) or the reason phrase (contained in replies). |
Registration Details Actions
Click the Raw messages button to view the raw SIP message as seen on the network. You can click the button again to display brief messages.
Note:
You can view one raw message at a time by double-clicking on any of the table's entries, as shown in Figure 4-47.Figure 4-47 Registration Details Window with One Expanded Raw Message
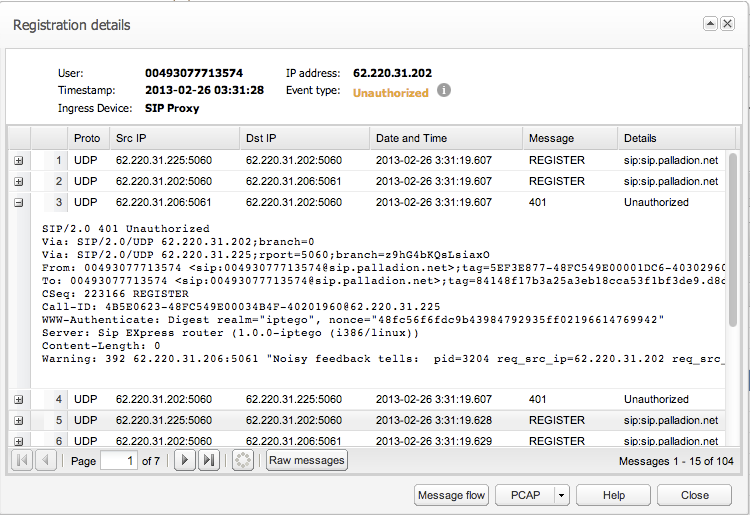
Description of ''Figure 4-47 Registration Details Window with One Expanded Raw Message''
Beside the Help and Close buttons, the details window contains a Message flow button and a PCAP button. The Message flow button creates a SIP message flow diagram, and the PCAP button allows you to save the shown network packets into a PCAP file.
User Devices
Operations Monitor provides statistics for user agents (user devices) registered on the monitored platform. These statistics are based on the User-Agent header of the REGISTER request. Alternatively, Operations Monitor can also evaluate the User-Agent headers of INVITE requests and replies in order to provide statistics about the callers and callees of the user device.
The User Devices page is located under the Voice/Video Operation section of the main menu. The User Devices panel displays a pie chart of the found user agents. The Devices List table contains detailed information about each user device in the lower area.
User Devices Chart
The User Devices chart displays the relative frequency of user agents as shown in Figure 4-48.
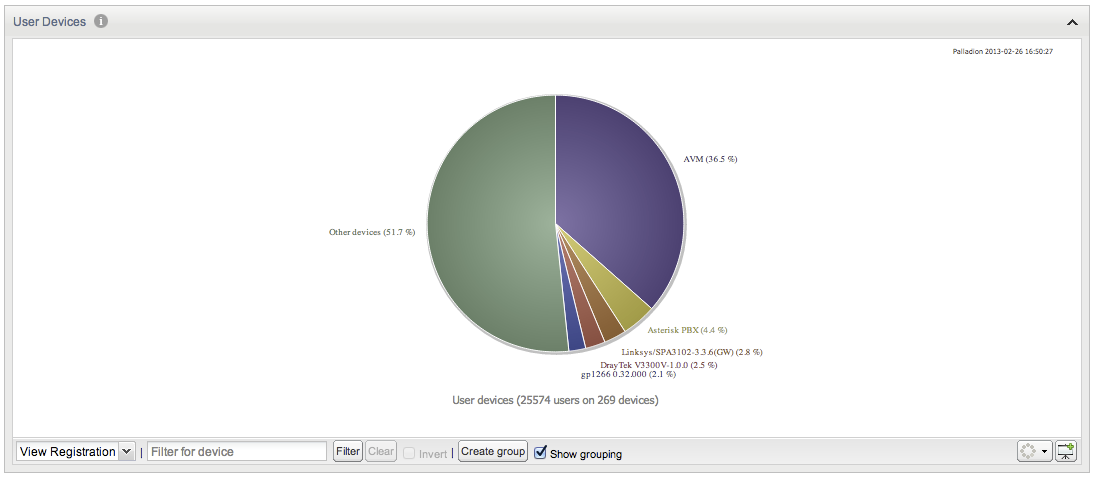
Operations on User Devices
You can filter and group user devices with the following actions in the User Devices chart:
-
Select data source
You can select whether the statistics displayed on the User Devices page is based on registrations, callers, or callees. To choose a display, select one of View Registrations, View Callers, and View Callees from the drop-down menu to the left below the chart. The information stored for callers and callees is based on the list of calls that Operations Monitor keeps in memory.
-
Restrict the User Devices page
You can specify the statistics on the User Devices page to match or not match a certain regular expression. Enter a regular expression into the text field to the left of the filter button below the chart. Click Filter. If you want to invert the match, mark the Invert check box below the chart.
-
Group devices
To create a new group of user devices, enter a regular expression in the Filter for device field and click the Create group button. The new group rule is applied to the Device List panel (below the chart). If the Show grouping check box below the chart is marked, the groupings are also applied to the pie chart (see Figure 4-49).

Note:
When you create filter or group user devices, this is applied to the User Devices chart and the Devices list.The User Devices chart also contains the Show in Dashboard icon button in the bottom-right corner. Click this button to add the panel, with the current filter settings applied, to the dashboard. For more information, see "Dashboard".
Devices List Panel
The Devices List panel (see Figure 4-50) contains two tables. The left table lists the devices by group, and the right table displays callers and callees for any device that is selected in the devices table.
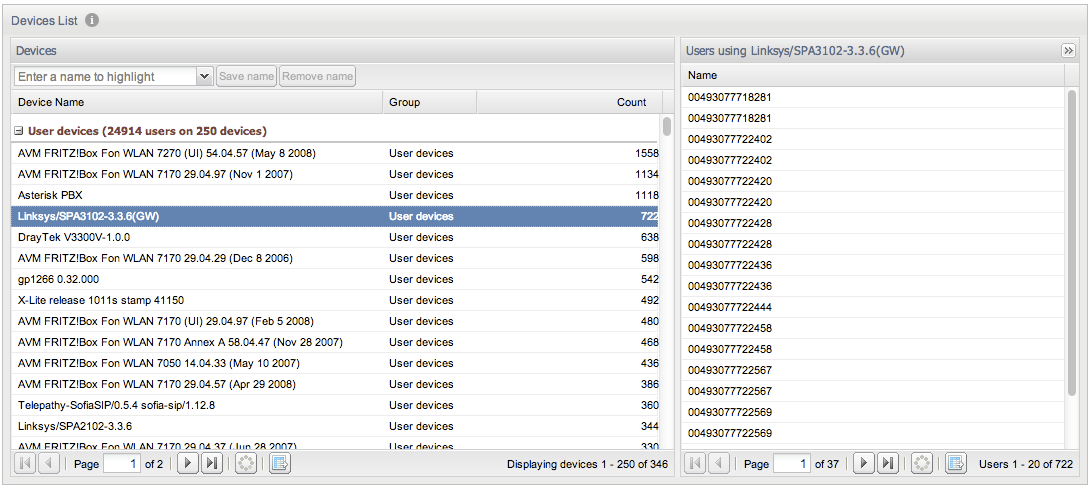
Table 4-11 lists the user devices table columns:
| Column | Description |
|---|---|
|
Device name |
Displays the full user agent string for each device. |
|
Group |
Indicates the group to which the device belongs. |
|
Count |
Shows the number of users per device. |
Right-Click Menu
Right clicking on any of the user devices provides the following options (see Figure 4-51):
-
Delete a group
Removes a group definition from the system. This only effects the User Devices page.
-
Highlight a group
Highlights all the devices from a group.
-
Highlight a user device name
Highlights all the user devices with a specific name.
-
Filter by a user device name
Filters the statistics displayed on the page by the selected user device name.
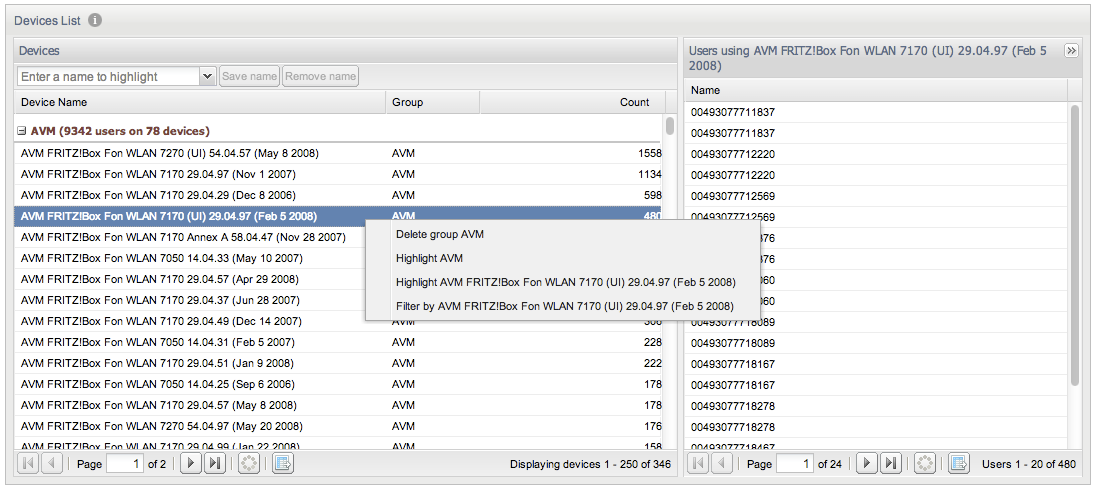
Users Using a Specific User Device
The right-side table only contains the Name column. An identifier is displayed for each user. If you right-click on a row in the Users table, a context menu appears with the following actions:
-
Track
Brings you to the User Tracking page with the selected user entered.
-
Trace
Brings you to the Traces page, where a new trace is started and filtered for the selected user.
Trunks/Prefixes
The Trunks/Prefixes page presents an overview of the status of all configured trunks and prefixes on the monitored platform. The Active sessions chart displays the number of inbound (ingress) and outbound (egress) sessions for each trunk or prefix (see Figure 4-52).
Figure 4-52 Trunks/Prefixes Page Overview
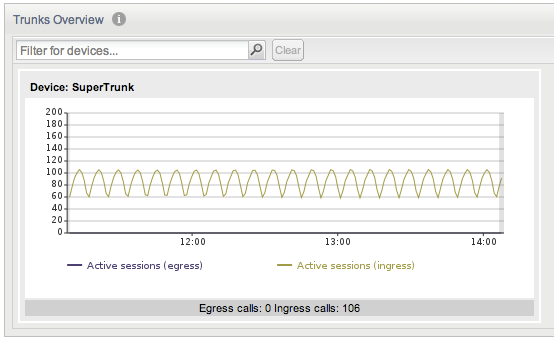
Description of ''Figure 4-52 Trunks/Prefixes Page Overview''
The metric displayed in the chart can be configured in the Device page. To change the metric to display for a trunk, select the metric from the Metric Library and click Save selection, as shown in Figure 4-53.
Figure 4-53 Configuring the Metric to Display for a Trunk
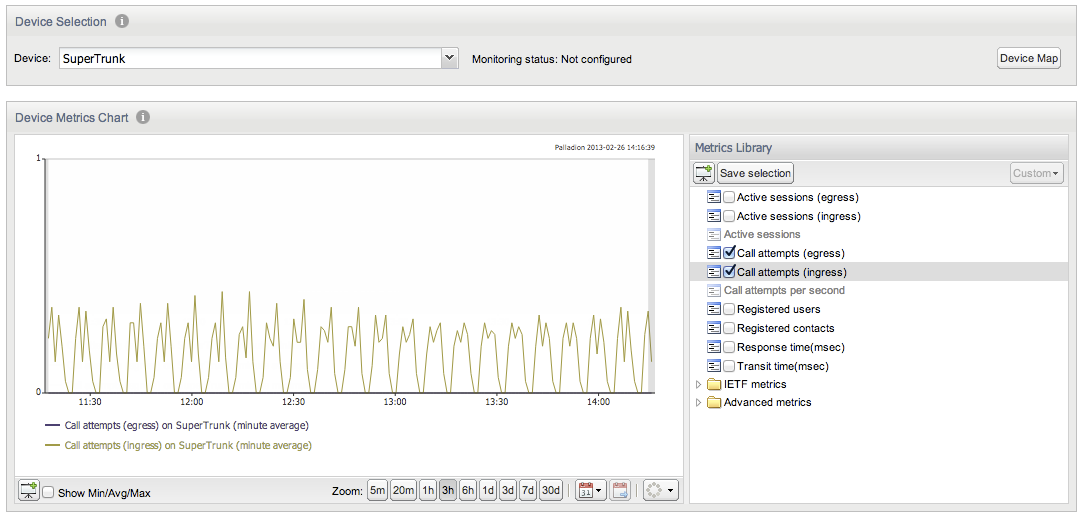
Description of ''Figure 4-53 Configuring the Metric to Display for a Trunk''
After the change, the Call attempts chart is displayed for the SuperTrunk (see Figure 4-54).
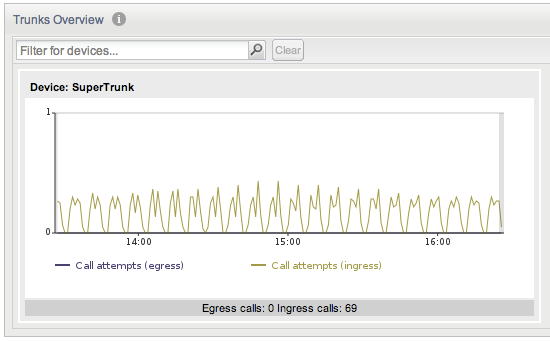
When you click on a trunk (outlined in white as illustrated in Figure 4-54), you are taken to the Devices page for this trunk. Clicking on a prefix has no effect. The Trunks/Prefixes page also features a Refresh button, which can be used to control the update interval for the textual information contained on the page.
Devices
The Devices page (see Figure 4-55) shows not only an overview of all configured platform devices, but it also aggregates information about each individual platform device. To use it, the platform devices (or trunks) have to be configured in the platform settings. For more information, see "Platform Devices". This page contains a device selection drop-down menu, a device metrics chart, and a tab panel providing details about calls, registrations, and voice quality for the selected device.
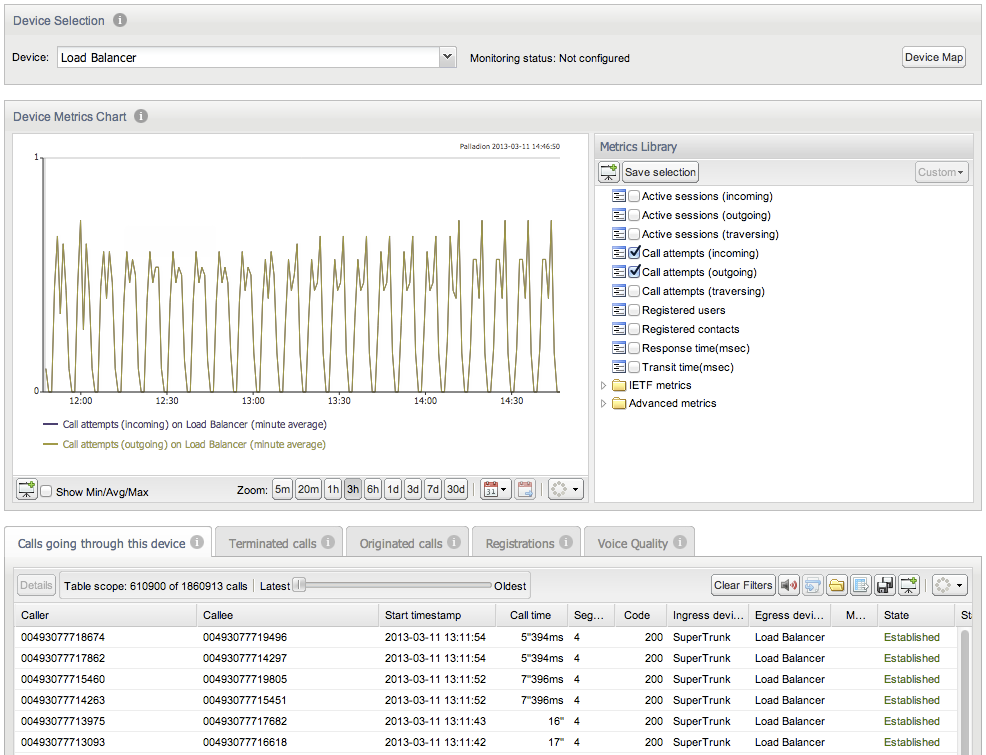
Device Map
You can display a map of devices by clicking on Device Map button. It shows an overview of the status and activity for all configured devices on the monitored platform (see Figure 4-56). They are displayed as nodes on a topological graph; activity between nodes is shown in the lines connecting them. From this page it is easy to monitor platform activity and status.
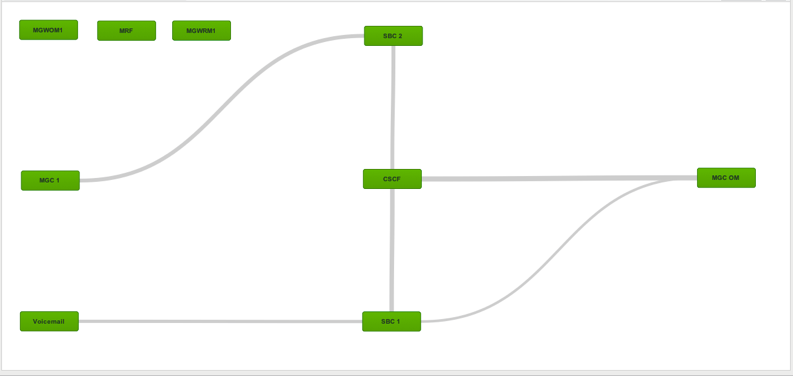
Once added, you can drag and drop devices around the page to best represent the local network topology. There is a Reset Layout button on the toolbar to reset the page.
Hover over the node with the mouse cursor to show the inbound and outbound value of the displayed metric of a node, as shown in Figure 4-57.
Figure 4-57 Hovering Over a Device to Display the Active Metric
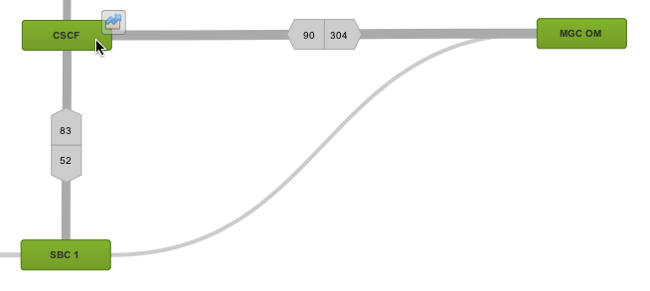
Description of ''Figure 4-57 Hovering Over a Device to Display the Active Metric''
Note:
By default, Operations Monitor displays a map in real-time of the configured platform devices and the interactions between them. Please note that due to browser and backend performance reasons, the map cannot work for a large number of configured devices. This is due to the high number of counters that need to be updated in real-time. Therefore, for more than 20 platform devices, we recommend you to disable the map through the 'Enabled Device Map' system setting.Device Map Toolbar
The Devices page has view display options, which are configurable through controls on the toolbar.
Figure 4-58 shows the display options that are available on the Device page toolbar.

The display options are as follows:
-
Metric selection dropdown
The metric displayed can be configured in the metric selection drop- down.
-
Always show counters
Select the Always show counters check box to change the above device hovering behavior so that Operations Monitor always shows metric data.
-
Hide inactive
Select the Hide inactive check box to hide devices that are not interacting with others. This can often help de-clutter the display. When the page data is refreshed all devices are checked to see whether they have become active.
-
Reset layout
Applies the default layout if the configuration by the user via dragging and dropping becomes unmanageable.
-
Refresher
The Devices page features a Refresh button to control the update interval for the metric data contained in the page. For more information, see "Refresh Button".
More detailed information about the selected metric (see Figure 4-59) can be displayed per-device by clicking on the Details button that appears overlaid on a device while hovering:
Figure 4-59 Click on a Device to Display Detail Information About the Active Metric
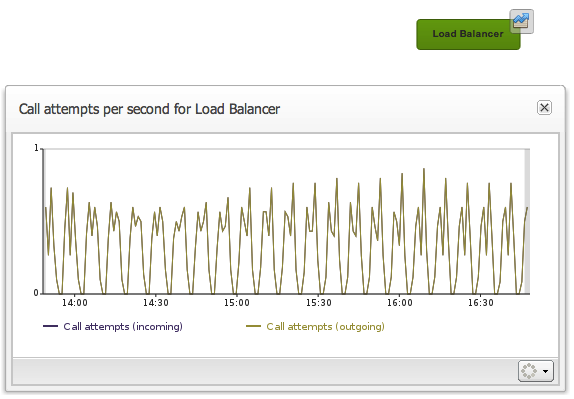
Description of ''Figure 4-59 Click on a Device to Display Detail Information About the Active Metric''
Device Selection Panel
The Device Selection panel illustrated in Figure 4-60 determines the device whose details are displayed on the page. Select a device from the drop-down menu.
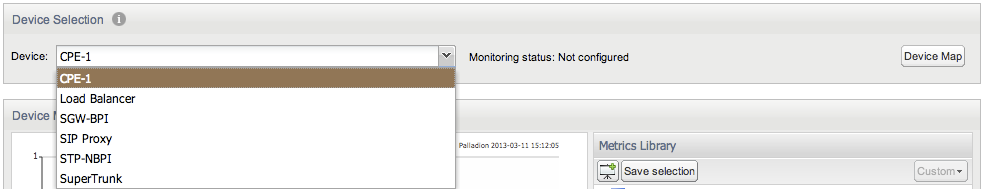
Device Monitoring Status
The Device Selection panel displays the monitoring status for the current device (see Figure 4-61). This information is available only if device monitoring is configured for that specific platform device.
To configure device monitoring, refer to "Platform Devices" and "Device Monitoring".

Device Metrics Chart
The Device Metrics Chart, illustrated in Figure 4-62, displays the evolution of the selected device metrics from the Metrics Library. For more information about the Metrics Library, see "KPI/Metrics". Device metrics are special in that they measure properties connected to a certain platform device.
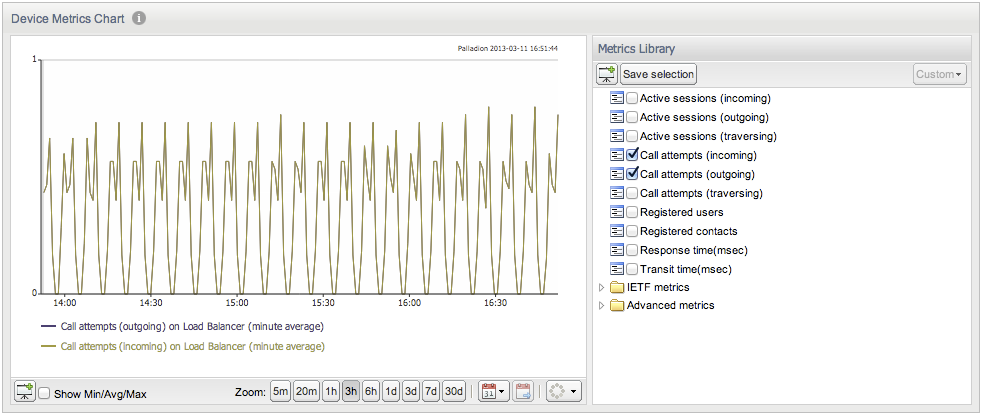
Note:
You can select up to five metrics by marking the check box of the desired metric.The Save Selection button saves the current set of metrics for the specified device in the Device Metrics chart.
You can add the Device Metrics Chart to the Dashboard by clicking the Show in Dashboard icon button.
At the bottom of the chart, the Show Min/Avg/Max check box controls whether minute or hour minima and maxima are displayed for each selected metric. The other controls are described in the section on chart panels. For more information, see "Charts".
Calls Going Through This Device Tab
The Calls going through this device tab, as illustrated in Figure 4-63, is similar to the Recent calls panel described in the "Calls" section. The table displays only the calls that have an inbound leg to the current device and an outbound leg from the current device.
Figure 4-63 Calls Going Through This Device Tab
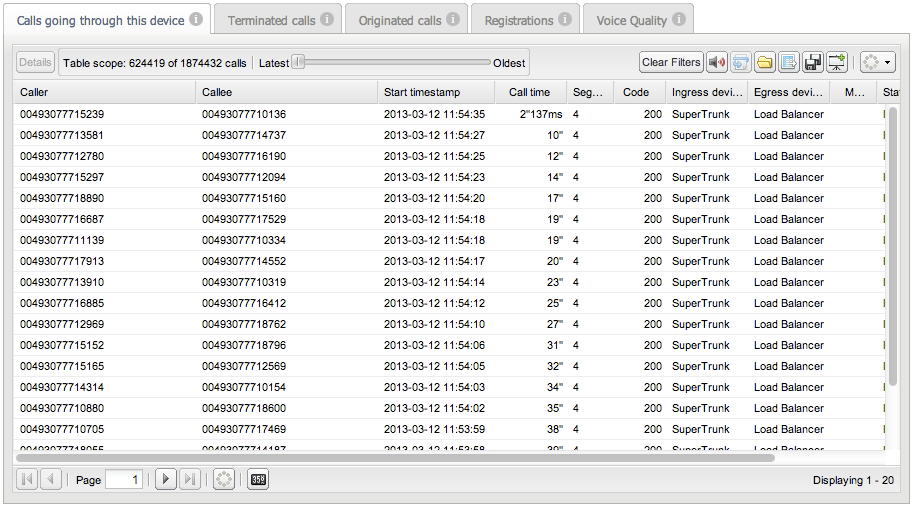
Description of ''Figure 4-63 Calls Going Through This Device Tab''
Terminated Calls Tab
The Terminated calls tab, as illustrated in Figure 4-64, is exactly like the Recent calls panel described in "Calls". The table displays only the calls which have an inbound leg to the current device. Terminated calls do not have an outbound leg from the current device.
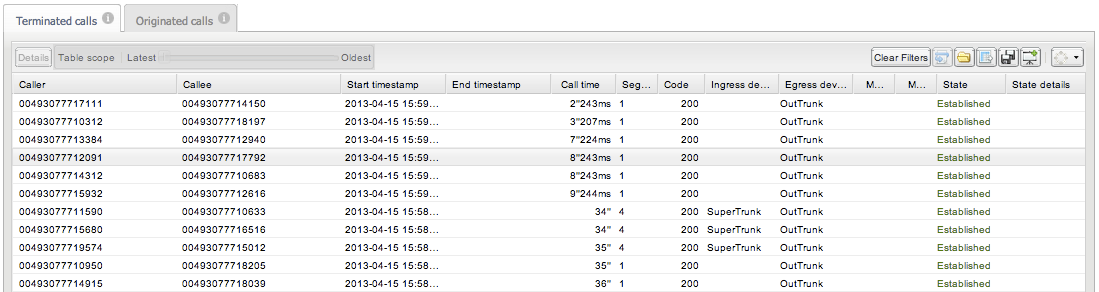
Originated Calls Tab
The Originated calls tab, as illustrated in Figure 4-65, is exactly like the Recent calls panel described in "Calls". The table displays only the calls which have an outbound leg from the current device. Originated calls do not have an inbound leg to the current device.
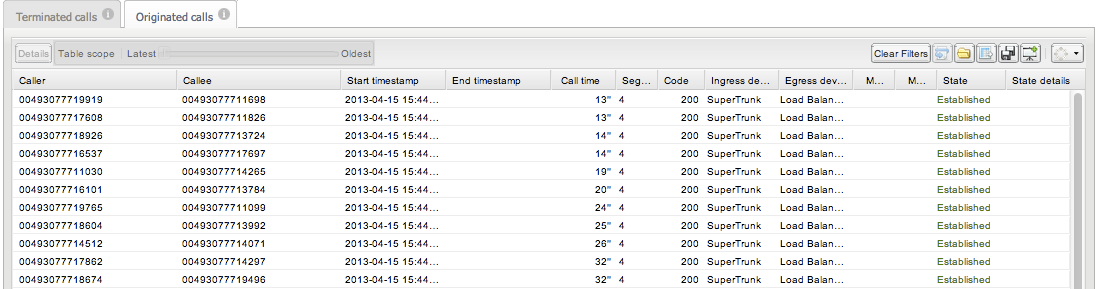
Registrations Tab
The Registrations tab, as illustrated in Figure 4-66, is similar to the Registrations panel described in "Registrations". However, it only displays registrations which are handled by the current device.
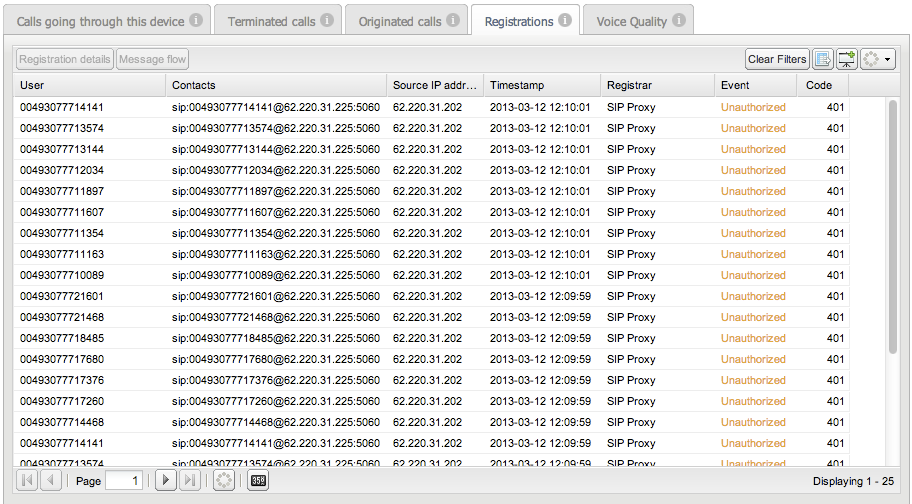
Note:
The Registrations tab is not available for gateway devices and trunks.