7 Settings
This chapter describes how to work with the Settings features of Oracle Communications Operations Monitor.
General Settings
The General Settings section of the Operations Monitor Settings dialog box allows you to view the status of the Operations Monitor server, configure date and time, update the Operations Monitor software or license, view properties of the currently installed license and execute some system-wide actions.
Status
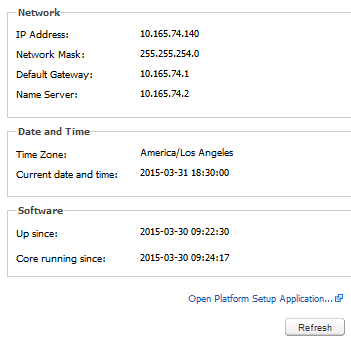
The Status page allows you to view some important information about the Operations Monitor server at a glance. To access the Status page, from the Settings menu, select General Settings, and then select Status. The Status page has three text boxes, Network, Date and Time, and Software, as shown in Figure 7-1
The Network text box displays information about the configuration of the primary network interface (IP Address, Network Mask, Default Gateway, and Name server). The Date and Time text box displays information about the configured Time Zone and the Current date and time settings on the Operations Monitor server. Finally, the Software text box displays the time since the Operations Monitor software has been up and the time since core has been running.
Actions
The Actions page allows you to block alerts and reset the browser UI state. To access the Actions page, from the Settings menu, select General Settings, and then select Actions. To execute one of these actions, click the corresponding button on the Actions page (see Figure 7-2). A confirmation dialog box appears. Click OK to continue.
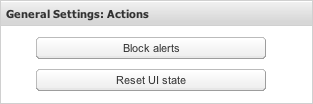
Table 7-1 lists the Action Page fields.
| Field | Description |
|---|---|
|
Block alerts |
Blocks the sending of alerts configured on the alerts page. |
|
Reset UI state |
For the user's convenience, Operations Monitor stores state information about the tables in HTTP cookies. The state information contains the hidden columns and the filtering criteria. This way the filters are kept even if the web page is refreshed or the browser is restarted. You can drop this UI state by using this action. It will delete all HTTP cookies used for state persistence. |
External IP/hostname
The External IP/hostname is used as base for deep links in alerting emails. Typically, this is the hostname you see in the address field of your browser.
This page allows you to view and update the External IP/hostname. To access the page, from the Settings menu, select General Settings, and then select External IP/hostname. The External IP/hostname page contains one field in which you can enter new text. Enter text in the field and click Update to save the External IP/hostname.
Network
The Probes page helps you define the remote agents that are pushing the data to the Mediation Engine of Operations Monitor. To access the Probes page, from the Settings menu, select Network, and then select Probes.
Probes
If your Operations Monitor installation has been configured to use probes on remote machines for traffic sniffing, you may view or edit those probes via this panel. By default, Operations Monitor will treat the local machine as its one and only probe (see Figure 7-3).
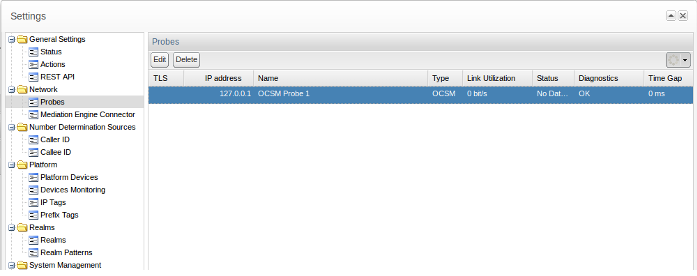
SBC probes are not configured using Operations Monitor, but it is possible to edit their names and IP addresses using the Probes panel. Users can remove probes using the Remove button in the probes list dialog box, but if a probe still exists, it will eventually reappear in the list of probes. Use the column Status to verify if your settings are correct and Operations Monitor can connect to the probes.
There is a process that searches for new probes at a given time interval. If they are correctly configured they will appear in the Probes configuration panel. When a probe is removed from the network, it should also be removed from the list.
Table 7-2 lists the columns in the Probes panel and the information that is shown for each probe:
| Column | Description |
|---|---|
|
TLS |
A lock appears if the connection with this machine is encrypted. |
|
IP address |
The IP address of the probe that will be used. |
|
Name |
A name to identify the probe. Can be edited by the user. |
|
Type |
Two types of probes are shown:
|
|
Link Utilization |
This column shows the traffic volume in bits per second if the probe is reachable. |
|
Status |
The value of this cell depends of the data received. If no received data is shown, that may indicate a potential problem. |
|
Diagnostics |
Shows information about possible errors that can appear in probes configuration, such as IP conflicts and counters mis-configuration. In the latter case, a button will let the Administrators manually create the missing counters. |
|
Time Gap |
Absolute time difference between the Operations Monitor instance and the probe in milliseconds. If the difference is bigger than the established maximum value, the value will appear in red color and an alert symbol will appear in the dashboard, noticing that there is a significative time difference. The setting name for the time difference probe value alert is vsp.probes.time_alert. |
There are two KPIs that are associated with each added probe:
-
Bandwidth, which is the amount of traffic, both forwarded by the probe in bits/second. Includes signal and also voice if it was recorded and forwarded to the Mediation Engine (ME).
-
Impairment, which is a Boolean value. Has the value of 1 for each minute that a problem has been detected with the probe. For more information on the problem the system log should be consulted.
Probe metrics are shown in the KPI/Metrics page, inside its own folder, as shown in Figure 7-4.
Figure 7-4 Library View of the Probe metrics Folder
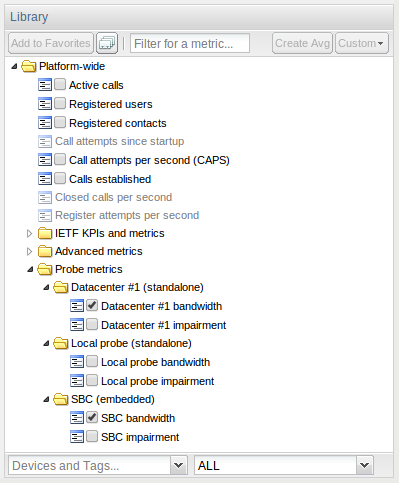
Description of ''Figure 7-4 Library View of the Probe metrics Folder''
Mediation Engine Connector
If your Operations Monitor installation has been configured to use a Mediation Engine Connector, the authentication token, which this Mediation Engine uses to authenticate itself to the Mediation Engine Connector, can be configured on this page as shown in Figure 7-5.
Figure 7-5 Authentication Token Configuration
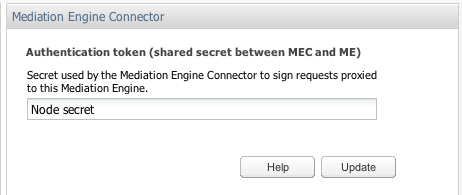
Description of ''Figure 7-5 Authentication Token Configuration''
Platform
The Platform section of the Settings window contains configuration options for defining the monitored SIP network. Operations Monitor requires this information for accurately mirroring SIP messages.
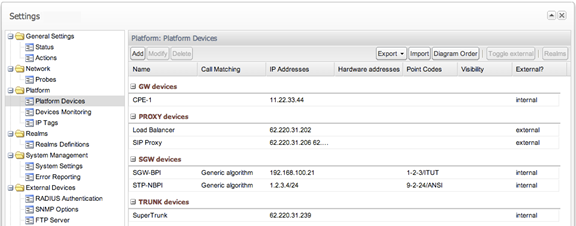
Platform Devices
The Platform Devices section is used to define the topology of the monitored network. This section defines the SIP devices and how they behave in order for Operations Monitor to properly merge calls and provide accurate overall and per-device statistics (see Figure 7-6).
To add, modify, or delete a device:
-
To add a new device, click the Add button from the upper toolbar. A wizard guides you through the device options.
-
To edit a device, double click its table row, or select the device and click the Edit button. A wizard dialog box opens, pre-filled with the current values for the selected device.
-
To delete a device, select it and click the Delete button. A confirmation window opens. Click OK.
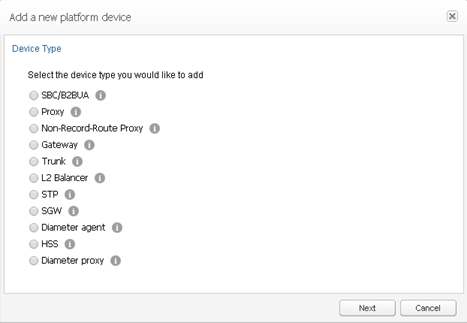
Device Types
Operations Monitor supports the device types shown in Figure 7-7 and described in Table 7-3:
| Device Type | Description |
|---|---|
|
SBC/B2BUA |
Select this option for devices that terminate an incoming leg and originate one or more independent outgoing legs from the same call (creating at least two SIP sessions). Examples include, session border controllers (SBCs), application servers (AS), and private branch exchanges (PBX). Because a B2BUA works by accepting the incoming call leg as a UAS, and creating a new leg as a UAC, it is difficult to determine whether two call legs are part of the same call. Therefore, on selecting this option, the wizard displays more configuration options for merging the call legs. For more information, see "SBC/B2BUA Call Merging". |
|
Proxy |
Select this option for devices that route calls without creating a new SIP dialog. The Call-ID in the outgoing call leg is usually left unchanged and SIP soft-switches and SIP layer load balancers are usually implemented as proxies. |
|
Non-Record-Route Proxy |
Select this option for devices that route INVITE messages but are skipped by the next messages in the dialog. These devices usually keep the Call-ID and the tag in the From SIP header field, as well as the URIs in the From and To headers unchanged. |
|
Gateway |
A SIP gateway is a device that connects the SIP platform to other types of networks (for example, PSTN, H.323). Operations Monitor only monitors the calls terminated and created by the gateway on the SIP side. Call merging is not created for gateway devices. If you need multi-protocol call merging, use an SGW (Signaling Gateway) device. |
|
Trunk |
This is not a physical device, but a peering with other carriers in which the peering IP addresses are known. Operations Monitor can display the calls going to and from this peer, as well as statistics about them. In addition to static IP addresses, the trunks can be defined using the OTG and DTG URI parameters. |
|
L2 Balancer |
A SIP load balancer acts at Layer 2 (of the OSI stack), keeping the IP addresses untouched and only modifying the hardware addresses. Operations Monitor supports these setups by identifying the devices by their hardware addresses in addition to the IP addresses. |
|
STP |
A Signaling Transfer Point (STP) monitors SS7/Sigtran routers and supports call merging for these protocols. For more information, see "SBC/B2BUA Call Merging". |
|
SGW |
A Signaling Gateway (SGW) transfers between different types of protocols. These multi-protocol signaling routers convert between ISUP and SIP and allow call merging between different protocols. For more information, see "SBC/B2BUA Call Merging". Note: A simple (or SIP) GATEWAY is always seen as a terminating device. |
|
Diameter agent |
Select this option if you are monitoring Diameter devices in Control Plane Monitor. For example, Mobile Management Entity (MME). |
|
HSS |
Select this option if you are monitoring Diameter messages exchanged with a Home Subscriber Server (HSS) in Control Plane Monitor. |
|
Diameter proxy |
Select this option if you are using an intermediate device to monitor a proxy that relays Diameter transactions in Control Plane Monitor. |
If the device you want to create is not an SBC or B2BUA, go to "Device Identification".
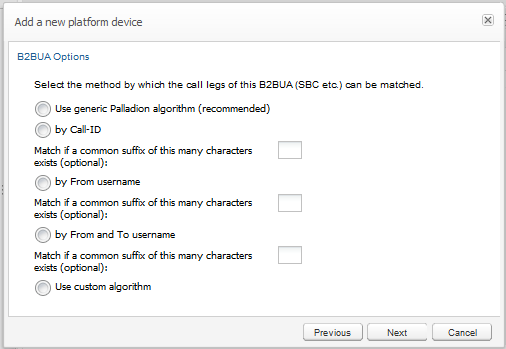
SBC/B2BUA Call Merging
Call merging across B2BUA devices is a crucial point for SIP troubleshooting. Operations Monitor can use a large set of criteria for matching the calls, has several easy-to-use presets, and can also combine the criteria in a very flexible way by using custom algorithm expressions.
For STP devices, a similar choice of options applies. For SGW devices, the only options are the default or custom matching algorithm.
The wizard panel offers the high-level options shown in Figure 7-8 and described in Table 7-4:
Figure 7-8 Choosing the Call Matching Type for a B2BUA Device
Description of ''Figure 7-8 Choosing the Call Matching Type for a B2BUA Device''
Table 7-4 B2BUA Device Options
| Option | Description |
|---|---|
|
Use generic OCOM/EOM algorithm |
The algorithm was developed to accurately detect which call legs belong to the same call for the most common SBC/B2BUA configurations. The algorithm takes into account the time difference between the calls, the session-id from the SDP, the From and To users, the P-Asserted-Identity header, the Diversion header, etc. Oracle recommends using this option and to adjust if necessary. For more information about the generic algorithm, see "Call Merging Algorithms". |
|
by Call-ID |
To be used if the SBC/B2BUA is configured to copy the Call-ID header from the incoming call leg to the outgoing call leg. If the suffix parameter is given, then only the last suffix characters are compared. This is useful, for example, if the SBC/B2BUA only prepends a string to the Call-ID to make it unique. |
|
by From username |
To be used if the SBC/B2BUA is configured to keep the same From user between call legs, and this does not lead to false positives in most cases. If the suffix parameter is given, only the last suffix characters are compared. This is useful if the SBC/B2BUA only changes the prefix of the numbers (for example, from +49 to 0049). |
|
by From and To username |
To be used if the SBC/B2BUA is configured to keep the same From user and To user between call legs. If the suffix parameter is given, only the last suffix characters are compared. This is useful if the SBC/B2BUA only changes the prefix of the numbers (for example, from +49 to 0049). |
|
Use custom algorithm |
This allows flexible combining available criteria for matching, ordered tests, and nested tests, as well as matching on arbitrary SIP headers. For more information on how to write a custom algorithm, see "Call Merging Algorithms". If this is selected, another wizard panel will be shown for entering the algorithm (see Figure 7-9). The Operations Monitor generic algorithm is pre-filled as a starting point. |
Figure 7-9 Entering a Custom Match Algorithm
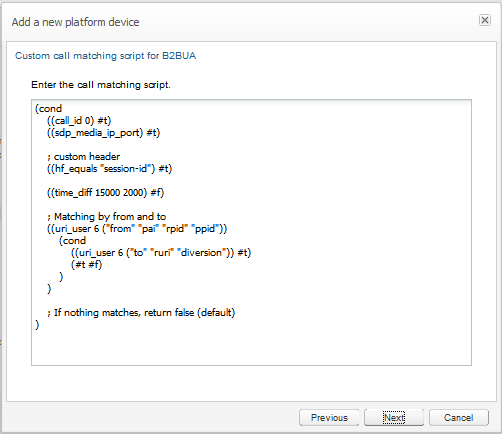
Description of ''Figure 7-9 Entering a Custom Match Algorithm''
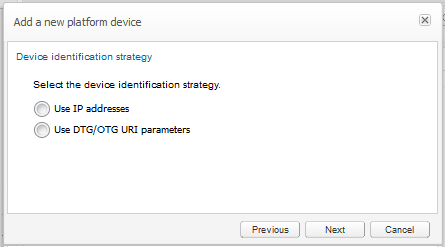
Device Identification
The devices are usually identified by only their IP addresses. Exceptions are the trunk devices, which can be also identified by the OTG and DTG parameters, and the set-ups in which the hardware addresses are significant. Either IPv4 or IPv6 addresses may be supplied. IP ranges with bitmasks smaller than 24 (for IPv4) or 120 (for IPv6) might impact performance significantly.
In the Device identification by address wizard panel, specify the identification addresses for the device you create. Enter the IPs used by the device in a list separated by spaces. If multiple devices share an IP address, but are in different VLANs, you can also specify the VLAN IDs.
You can specify VLAN IDs in multiple ways. You can enter:
-
IP(VLAN=x) with x>=0, which matches packets with VLAN ID x.
-
IP without a specified VLAN. The IP matches any packets, with or without a VLAN.
-
IP(VLAN=0) or IP(VLAN=off) which only matches packets with no VLAN. This restricts the IP to only non-VLAN packets.
Figure 7-10 Device Identification Settings
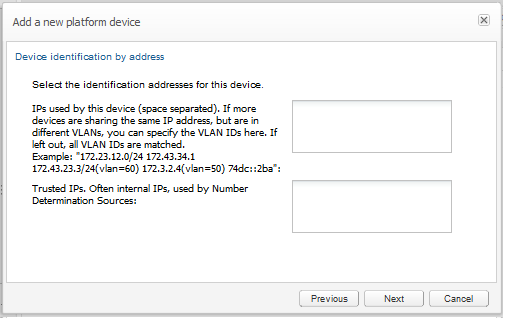
Description of ''Figure 7-10 Device Identification Settings''
For trunk devices, there is also the option of identifying by using the OTG and DTG parameters, offered by an extra wizard panel (see Figure 7-11).
Figure 7-11 Trunk Identification Settings
Description of ''Figure 7-11 Trunk Identification Settings''
The parameters OTG and DTG are the originating and destination trunk identifiers found in the From header field of the URI, respectively, Request-URI.
For the Number Determination algorithm, only these IPs (or point codes) on each device are considered when identifying a call. Set this field to the source IPs for messages that you wish to take number information from.
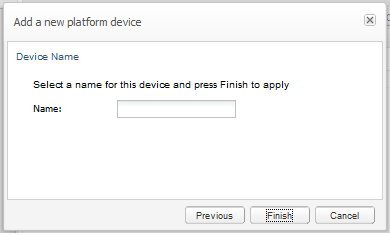
Providing a Name
The last step in the creation wizard is to set a name for the device. The name may contain spaces, but it is recommended to keep the name short in order to fit in the table columns and SIP diagrams.
Visibility Configuration
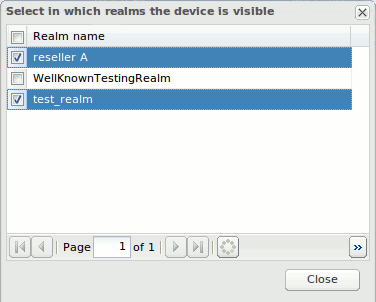
You can configure a device or trunk to be visible or hidden for each realm. Click the Realms button in the toolbar to list the current defined realms as illustrated in Figure 7-13. If one or more realms are checked, the device/trunk will be visible only to the users belonging to those realms.
Configuring Devices for the Mediation Engine Connector
A Mediation Engine Connector allows a user to monitor multiple Mediation Engines that are located in separate geographic locations.
If a call is sent through a device monitored by two Mediation Engines, the Mediation Engine Connector sees the call flow through both Mediation Engines. In order for the Mediation Engine Connector to correlate the call, you must designate one Mediation Engine as internal, and the second Mediation Engine as external. The Mediation Engine Connector consolidates the data from both Mediation Engines and presents the single call flow.
The Toggle external button allows you to select a device and determine if the device is visible to the associated "internal" Mediation Engine, or visible to other "external" Mediation Engines in the Mediation Engine Connector platform.
For more information on correlation, see "Understanding Call Correlation" in "Configuring Mediation Engines" in Mediation Engine Connector User's Guide.
For more information regarding the Mediation Engine Connector, consult your Oracle representative.
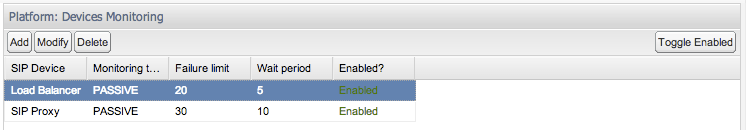
Device Monitoring
The Device Monitoring page is used for starting monitoring a device defined in "Platform Devices". Monitoring is realized by counting the number of requests that remain unanswered.
Operations Monitor uses the following algorithm for monitoring SIP devices:
-
A counter is kept with the number of incoming SIP requests to the monitored device, which have received no answer. These requests are not sent by Operations Monitor, but are regular requests from the SIP network.
-
Whenever the monitored device sends a message (regardless of what type of message), the counter is set to zero, because the device must be up.
-
If the counter exceeds a configurable threshold, a timer is started to fire after a configurable time interval.
-
If the monitored device sends a message before the timer fires, the timer is canceled and the counter is set to zero again.
-
If the timer fires, the monitored device is marked as down.
Enabling Device Monitoring
In the Device Monitoring table (see Figure 7-14), each line represents a device being monitored. To enable or disable the monitoring of any device, select the device in the table and click the Toggle Enabled button in the toolbar. The Enabled? column from the table shows the current status.
Adding and Editing Monitored Devices
Before you add a device to be monitored, you must configure the device in the Platform Devices settings section.
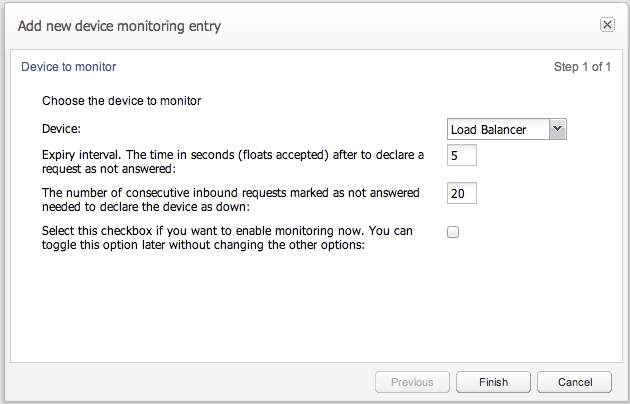
To add a new monitoring configuration, click the Add button from the upper toolbar. A wizard dialog guides you through the monitoring options.
To edit an existing monitoring configuration line, select the device and click the Modify button in the toolbar. A wizard dialog opens pre-filled with the current values for this monitoring configuration. If you want to permanently delete a configuration type for a device, select it from the table and click Delete.
Note:
Device monitoring does not affect the performance or stability of the monitored device. It is immune to connectivity problems between the monitoring and the monitored device, reducing false positives.Device Monitoring Parameters
To configure a device monitoring, a couple of parameters are requested (see Figure 7-15):
-
Device name to be monitored.
-
Expiry interval of the timer.
-
Number of unanswered requests needed to start the timer.
Additionally, you can enable device monitoring immediately, or leave it disabled until toggled from the list of monitored devices.
Figure 7-15 Device Monitoring Parameters
Description of ''Figure 7-15 Device Monitoring Parameters''
Realms Definitions
You configure Realms Definitions under the Realms section of the Settings menu. Each realm can have one or more realm patterns associated with it.
Realms can be used for limiting the visibility of Operations Monitor's web interface users. They are useful in scenarios such as:
-
You have a set of resellers of the SIP service, and you want to give each of them the monitoring abilities of Operations Monitor, but at the same time restrict their view only to the SIP users served by them.
-
You have a set of support workers, and you want to give them the fast troubleshooting abilities of Operations Monitor, but in the same time restrict their view to a certain set of users, for privacy reasons.
A realm can be defined as a set of telephone numbers or as a set of domains. The set of rules defining a realm are called realm patterns. Additionally, a custom header in SIP can contain a realm identifier.
Note:
Realms do not need to be disjoint. For example, you can have a single telephone number in multiple realms, and you can have one realm containing the union of other two realms.If a user has his or her visibility restricted to one realm:
-
The user only sees the registered subscribers that are part of the realm. The User tracking feature is restricted as well.
-
The user only sees calls in which the caller or the callee are part of the realm.
-
Statistics are adjusted to reflect only the Realm section, not the whole platform. For example, the Active Calls chart counts only the active calls in which one of the participants is part of the realm.
Note:
Voice quality statistics are an exception. Realm separation does not apply to voice quality statistics. Users assigned to realms see platform wide voice quality values. -
If the user creates a trace, it will only contain the messages that are from or to subscribers of the realm.
-
Alerts are only sent to the user if the cause of the alert is part of his realm.
In other words, realms are segments of the subscriber base, and if an Operations Monitor user's view is restricted to a realm, Operations Monitor will only show information about that segment.
Note:
Realm names cannot be deleted, only the realm patterns.Realms are not the only way to limit the view of the web interface users. You can also restrict features by using user rights. For more information, see "User Management".
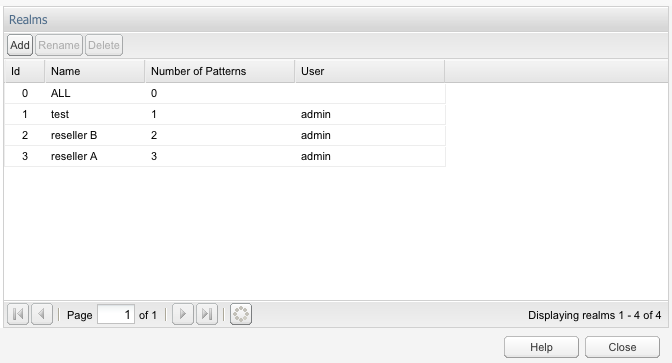
Realms Table
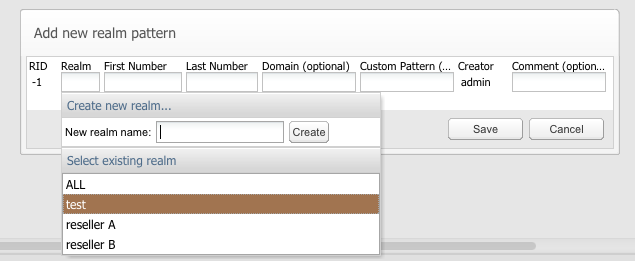
Figure 7-16 shows the panel used for adding, editing and deleting realms. Realms can also be created from the Realm Patterns Table edit window (see Figure 7-17). Deleting a realm will also delete all its associated patterns.
Realm Patterns Table
Figure 7-18 shows the panel used for defining realm patterns. Selecting a realm pattern and then clicking the toolbar Edit button, or double-clicking an entry opens an editing window. For an example, see Figure 7-17.
Table 7-5 describes the fields found in the Add new realm pattern table:
Table 7-5 Add a New Realm Pattern Fields
| Field | Description |
|---|---|
|
Rid |
The ID of the realm. |
|
Name |
The name of the realm. The edit select menu of the field offers the previous used realms, but also allows entering a new name. By entering a new name and pressing the Create button, a realm with that name is created immediately. |
|
First number |
The first phone number from a number range realm. If this is specified, then the Last number must also be specified. The realm will contain all numbers from the range. |
|
Last number |
The last phone number from a number range realm. If this is specified, then the First number must also be specified. The realm will contain all numbers from the range. |
|
Domain |
The domain from a domain restricted realm. The realm will contain all the users from the given domain. This can be combined with the First number and Last number options in which case all restrictions apply. |
|
Custom Pattern |
Give a custom header pattern for matching of calls to this pattern. If a call's invite contains this header pattern then it is counted in the realm. For more information, see "Realms Header Specification". |
|
Creator |
The user who created this realm. |
|
Comment |
(Optional) Comment line, only for convenience. |
Important:
In order for the domain restricted realms to work, Operations Monitor needs to be configured to consider the domains in the user identifiers. Set the Use User Domains to true. For more information, see "Use User Domains".Note:
Configuring a large number of realm patterns will affect the performance of the server.Figure 7-17 The Add or Edit Realm Pattern Window
Description of ''Figure 7-17 The Add or Edit Realm Pattern Window''
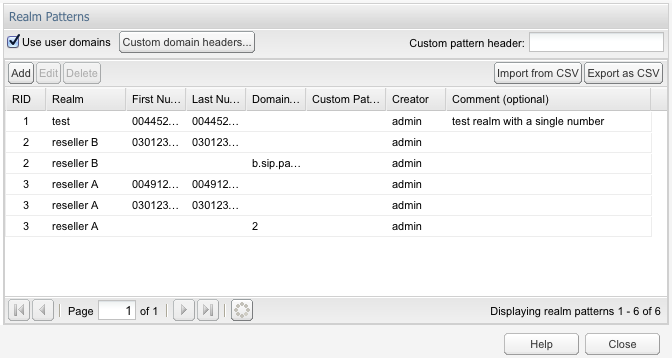
For example, the configuration from Figure 7-18 defines the realm reseller A to contain:
-
The phone number range 00491234000 to 00491234999, regardless of the domain name.
-
The phone number range 0301234000 to 0301234555, regardless of the domain name.
-
All users that have a.sip.palladion.net as their domain name.
The realms configuration can be exported to and imported from CSV files. This simplifies the realms maintenance in case of many realms patterns. For example, the configuration in Figure 7-18 would be exported to:
name,min,max,domain,comments
reseller A,00491234000,00491234999,,
reseller A,0301234000,0301234555,,
reseller B,0301234556,0301234999,,
reseller B,,,b.sip.palladion.net,
reseller A,,,a.sip.palladion.net,
test,00445213000,00445213500,,Test realm with a single number.
The realms patterns can also be provisioned automatically by uploading a similar CSV file via FTP.
Realms Header Specification
There are two System Settings that modify the way Operations Monitor assigns realms to calls. By default Operations Monitor checks the To: and From: header for each SIP invite message associated with a call and associates this call with all matching realms ("or").
Specify additional header fields in the System Setting named Headers in which to look for realm URIs. Diversion or P-Asserted-Identity could be useful values, depending on the configuration. Operations Monitor generally checks all the occurrences of each of these fields in each SIP Invite message. Exceptions are possible for header fields whose repetition is forbidden by the SIP standard.
Further customization is possible by matching a custom pattern against an arbitrary header field. Use the Custom header for realm definition System setting to specify which header to search for; use the Custom Header Pattern (optional) column on the Realms Definitions page to specify a pattern for each realm. The pattern matching works similar to the number matching.
Be aware that each additional header and the custom header matching are affecting Operations Monitor's performance.
Automatic Realm Pattern Import
You can create an external list of realm patterns and import the list into Operations Monitor. You can compose a list as a CSV file, upload the file by using FTP, and configure Operations Monitor to have the CSV file processed at a defined interval to import the realm patterns.
This is an alternate method of adding realms to Operations Monitor. Importing realm patterns from an external CSV file may be preferable if you have a large number of entries to add or if you make frequent changes to the realm definitions See Realms Definitions for more information on adding realms using the Operations Monitor interface.
Caution:
Importing new realm patterns overwrites existing realm patterns. The import feature is not additive; rather, all numbers for all realms should always be present in the CSV file.About Formatting the CSV File
Each line in the CSV file contains the realm name and the number pattern separated by a comma.
For example:
RealmName, NumberPattern
Assign each realm name and number pattern a unique value and order the list alphabetically. Only enter single number entries (even if there are number ranges belonging to the realm). Do not include duplicate entries. The import function of Operations Monitor compacts the numbers to the least possible amount of patterns by grouping them into the ranges.
Following is an example of a list of realm names and number patterns:
03940394, 444333222111
40404044, 404040404040
realmone, 133334444555
realmone, 133334444666
second, 12224444333
Sorting Realms
If you are unsure of the uniqueness or ordering of realm names and number patterns, you can use the UNIX sort function on the file you have created.
From the command line, enter:
/var/vsi/ftp/realms# cat list.csv | sort -u > ordered_list.csv
If you use the sort function in Operations Monitor, use the command to remove the original list after the sorting is complete. Since all entries must be unique, allowing the original list to remain following the sort would introduce duplicate entries. The original list would also exist in an unsorted state.
Use the following command to remove the original list:
/var/vsi/ftp/realms# rm list.csv
Importing Realms at a Daily Frequency
You can set a specific time at which the new realm patterns are automatically imported each day.
To enable importing realms at a daily frequency, at the command line:
-
Create a folder within the FTP directory:
mkdir /var/vsi/ftp/realms -
Open the etc/iptego/vsp.conf file and add the following text:
[realms]
import-enabled=1
import-task-hour=hour
import-task-minute=minute
The hour and minute variables indicate the hour of the day and the minute of the hour that the feature processes the CSV file. Valid values for the hour field are 0 through 23. Valid values for the minute field are 0 through 59.
The following example schedules an import to take place every day at 03:10 a.m. server time:
import-enabled=1
import-task-hour=3
import-task-minute=10
-
Save and close the file.
-
Restart the respective process to make above changes active:
systemctl restart pld-vsp.service
Editing the CSV File
Edit the CSV file externally, then recommit it by using FTP to the realms folder. Make sure the CSV file is ordered and with unique entries. On the configured import time, the change will take effect.
There can be multiple CSV files present in Operations Monitor. Ensure that the entries are unique across all the CSV files.
IP Tags
Figure 7-19 shows the New IP Tag Management window, which is used to add new IP addresses.
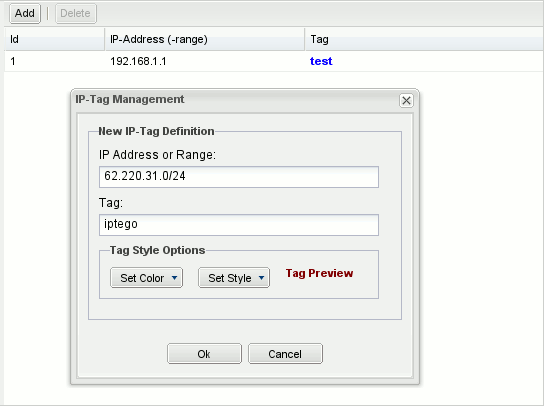
IP tags are a way of assigning friendly names to IP addresses or IP subnets (either IPv4 or IPv6). The IP tag's name appears in brackets in the Call Details window, see Figure 7-20 for an example. The color and font style of the tags can be customized. IP tags are visible and editable by all users.
Figure 7-20 IP Tags Shown for Known Addresses
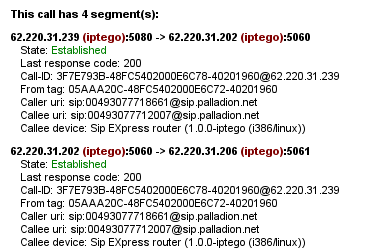
Description of ''Figure 7-20 IP Tags Shown for Known Addresses''
Prefix Tags
Figure 7-21 shows the Platform: Prefix Tags window, which is used to add new Prefix tags.
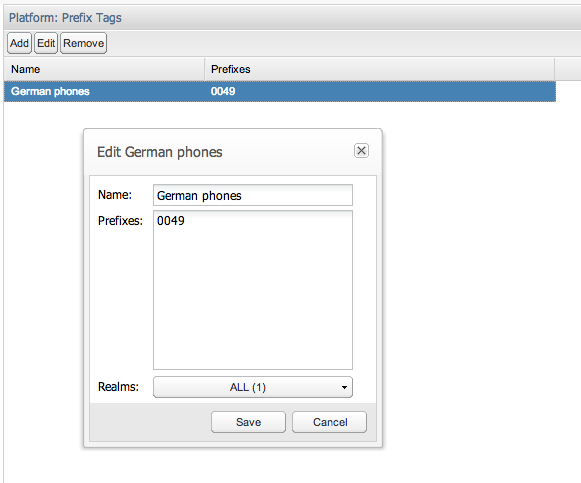
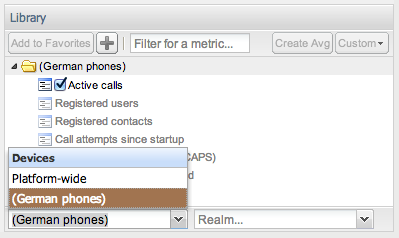
Prefix tags allow assigning a friendly name to phone prefixes. Once the prefix tag is created, the user can create a KPI or metric on it, see Figure 7-22 for an example. You can, like with devices, configure a prefix tag to be visible or hidden for each realm, with the difference that prefixes in the ALL realm won't be visible for the user in another realm. For more information, see "KPI/Metrics".
When a prefix tag KPI is created in a realm, the value of the KPI is sourced from the calls matching both the prefix and the realm pattern. If you create a prefix tag in one realm and a KPI in a different realm, the KPI will not be visible to users who are restricted to one of the two realms.
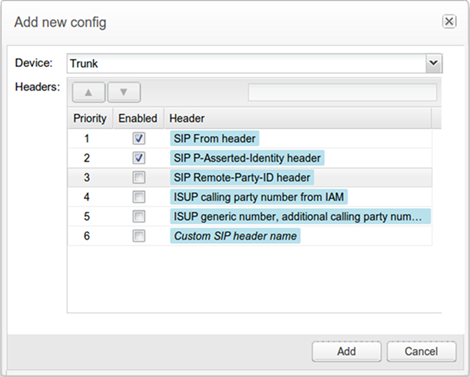
Number Determination Sources
This section of the configuration enables the definition of prioritized lists of trusted devices, from which phone number information may be taken for the caller and callee, along with the headers to be used (for example, From/To).
Note:
Only data leaving a device via the Trusted IP ranges is considered for number determination purposes.Figure 7-23 Enabling and Adding Prioritized Lists
Description of ''Figure 7-23 Enabling and Adding Prioritized Lists ''
System Management
Operations Monitor's system is configurable and maintainable through the System Management section of the Settings link in the upper right corner. The System Management section includes the following:
-
System Settings: Use the System Settings page to configure Operations Monitor system parameters by adjusting the default values to meet your business needs. For example, you can adjust the session-timeout value that defines how long Operations Monitor keeps a call active if no SIP messages are received for the call.
-
Oracle SBC Config Upload: Use the Oracle SBC Config Upload page to import the device configurations from an Oracle SBC configuration file into Operations Monitor or update existing Oracle SBC configurations.
-
Language Settings: Use the Language Settings page to configure the default display language for all Operations Monitor users.
System Settings
System settings allows you to configure Operations Monitor's internal parameters and several advanced settings.
Important:
Some of these settings may affect the performance and stability of Operations Monitor. Please consult with Oracle or your system integrator if you are unsure about a configuration.Figure 7-24 is an example of possible system settings. A short description about every system option is displayed when you hover with the mouse over the name of the option.
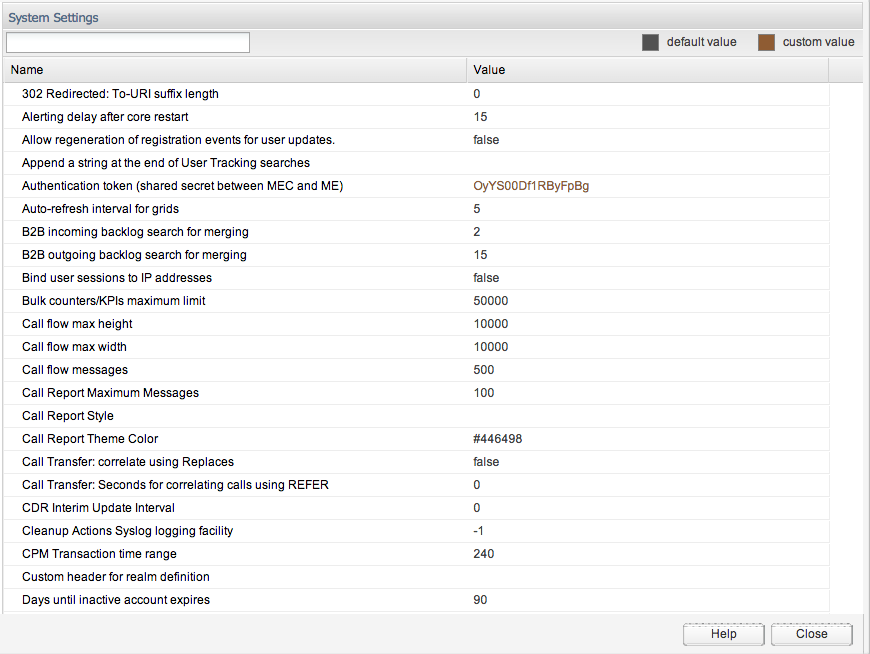
Table 7-6 describes the system options:
| Option | Description |
|---|---|
|
Name |
The name of the system option. |
|
Status |
Can be user defined if the option was changed by the administrator, or default if the option has the factory default value. |
|
Type |
The type of the system option. There are three types defined:
|
|
Value |
The current value of the setting. |
To change the value for a setting, double-click the table row. A window similar to the one in Figure 7-25 is shown. The Update System Option window contains a short description of the system option, the default value, a maximum value in case of a number type option, and a value box or a check box in case of a Boolean type option. The Update button is for changing the system option to the new given value, and Reset to default resets the current value to the default one.
For a list of all system settings, see "System Settings Summary".
B2B Incoming Backlog Search for Merging
When doing call merging across B2B/SBC or Proxy device types, Operations Monitor is searching for the matching call in the recent calls going to or from that device. This options sets the default number of seconds to search the incoming call leg in the past when an outgoing leg is received.
Note:
If the call merging algorithm uses thetime_diff function, then the values defined by it take precedence over this system setting.Because the outgoing leg is normally seen by Operations Monitor after the incoming leg, we recommend setting a small value for this option.
B2B Outgoing Backlog Search for Merging
When doing call merging across B2B/SBC or Proxy device types, Operations Monitor is searching for the matching call in the recent calls going to or from that device. This options sets the default number of seconds to search the outgoing call leg in the past when an incoming leg is received.
Note:
If the call merging algorithm uses thetime_diff function, then the values defined by it take precedence over this system setting.Call Flow Messages
The maximum number of messages displayed in a Message Flow window. This number should be limited as a large amount of messages can significantly slow down the web browser. When the number is exceeded, a warning icon is displayed. By default, it is set to 100. The maximum value is 5000 messages.
Call Flow Maximum Height/Width
The maximum number of pixels (height or width) for rendered Message Flow. Limit the number of pixels if the diagrams take too long to render.
Call Flow Parallel Loading
If enabled, the Message Flow will render progressively, instead of all at once.
Calls Partition Size
As of release 2.10.0 the calls table in Operations Monitor is partitioned into several partitions. Operations Monitor only writes to one partition at a time. When this partition reaches its size limit, a new partition is created and subsequent calls are written to this partition. This setting gives the partition size limit in number of calls.
Call Report Maximum Number of Messages
The maximum number of messages to include in a Message Flow that is part of a call report (PDF).
Enabled Device Map
Operations Monitor can display a real-time map of the configured platform devices and couple of measurements of the traffic going through these devices. By default, the option is enabled, but please note that this map cannot work properly for a large number of configured device counters. It is therefore recommended to disable this setting when configuring more than 20 devices or realms.
Future Maximum Search
Sets a range of time in which new incoming calls can be included in a search you have initiated. Since new incoming calls can occur after a search has been initiated, this setting allows a range of time in which these incoming calls will be included in search results. The default setting is 10 seconds.
High Threshold for MOS
The upper threshold for good voice quality MOS value. Estimated MOS values higher than this threshold will be displayed in green in the Calls table. Lower values will be displayed in orange or red.
Group New Registrations from the Same User
If enabled, new registrations from the same user will be grouped together. However, the grouping is done per requested chunk, sometimes leading to duplicates still being displayed in the grid if the grid needs to do multiple requests to fill up a page. This is mostly notable when navigating back and forth through recent registration events, sometimes displaying different results for the same page.
Ignore Internal Registrations
A REGISTER SIP message exchanged between two devices from the platform is considered an internal registration. If disabled, registrations from inside the platform will be recorded. Otherwise, only the registrations between the end points and the first device from the platform are recorded. The default value is disabled. The value of this option must be the same as the "Registrations Gone Events," both enabled or both disabled.
Low Threshold for MOS
The lower threshold for good voice quality MOS value. Estimated MOS values lower than this threshold are displayed in red in the Calls table. Higher values are displayed in orange or green.
Match Registration Events by Comparing a Suffix of the Username
Operations Monitor matches the related registration attempts by the SIP username. If this value is 0, then the whole username is used. If non-zero, only that many of the last digits/characters are compared.
Set this to a non-zero if the Registration device is changing the SIP username/phone number when forwarding the message.
Maximum Concurrent Sessions
The maximum number of parallel sessions a user can be logged into. If the limit is reached, the user cannot start additional sessions. In case the user has the permission to always log in, the user will still be able to log in, but for every new session that exceeds the limit the oldest of the user's existing sessions will be destroyed. For a description of permissions, see "User Management".
Maximum Stored Script Runs
The maximum number of stored app runs. Before an app is executed, scheduled or run manually, we check to make sure we are not violating this limit. The oldest stored app runs are removed as needed. This prevents frequently running or large result producing apps from depleting resources.
Maximum Script Output Size
The maximum size a script output can show. It is defined in bytes and limits the size that can be shown during a script run.
Maximum Simultaneous Script Runs
The maximum number of scripts that be running simultaneously.
Newest Search Cache
Checks how often the newest date in the search cache is refreshed. The default setting is 1 second.
Note:
Changing this system setting can result in a loss of incoming calls.Oldest Search Cache
Checks how often the oldest date in the search cache is refreshed. The default setting is 60 seconds.
Recurrent Alerts Threshold
Operations Monitor compares the time difference between a new alert and any previous unread alert that is identical (same definition and message) to avoid the creation of similar alerts within that period. You can specify the number of days for that period.
Registrations Gone Events
If enabled, when a REGISTER transaction occurs and not all previous known contacts of the user are seen in the successful answer, generates 'Gone' registration events for the missing contacts. In other words, if the subscriber registers a new SIP contact without explicitly de-registering the old one, a registration 'Gone' event is generated for the old contact. By default, this option is disabled.
Note:
In some networks in which the REGISTER messages are routed by intermediate devices that change the Contact header, this option can cause false Gone events. In this case, Oracle recommends you disable this option.Search for Matching Registration Segments
When viewing the diagram of a Registration event, Operations Monitor searches for other related registration events. This option controls the time span during which Operations Monitor searches. If set to 0, the searching of related registration events is disabled.
This is useful for getting the flow of the registration request inside the platform. If you have devices that forward registration requests or that register themselves on behalf of the customer (as some SBC devices do), set this option to a non zero value. Also, make sure to disable the Ignore Internal Registrations option.
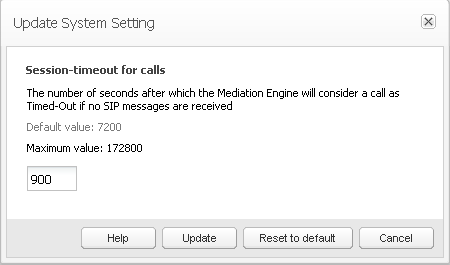
Session-Timeout For Calls
Session-timeout defines the number of seconds that Operations Monitor keeps a call active if no SIP messages are received for it. When the session timer expires, Operations Monitor marks the call with the state Timed out.
If the calls are not periodically refreshed in the monitored SIP network at SIP level, you might consider increasing this value. The default value is 2 hours (7200 seconds).
Timeout for Mediation Engine Querying
This setting gives a timeout for requests made by this Mediation Engine to its peer Mediation Engines. Ignore, if you use this Mediation Engine in standalone mode.
User Devices Ignore Internal Registrations
Similar as Ignore Internal Registrations, but for the User Devices statistics. There are cases when it is desirable to take the internal registration into account but not to count them for the User Devices statistics. An example of this is when all the internal registrations use the same User-Agent string. If the Ignore Internal Registrations option is enabled, this option is ignored.
Users Loose Searching
If enabled, when searching users by using the live search feature, the last digits of the number act as wildcards to suggest similar numbers from the same range. By default it is disabled.
Use User Domains
Important:
Changing this system setting requires a core restart, which will cause a temporary drop in all metrics.If enabled, Operations Monitor uses the domain part of the SIP URI to differentiate the subscribers, in addition to the user name part/phone number. If the option is enabled, Operations Monitor also displays the domain part of the AOR of the subscribers in the web interface. See Figure 7-26 and Figure 7-27 for comparative examples. By default, this option is disabled.
Figure 7-26 Calls Panel with Use Users Domains Disabled
Description of ''Figure 7-26 Calls Panel with Use Users Domains Disabled''
Figure 7-27 Calls Panel with Use Users Domains Enabled
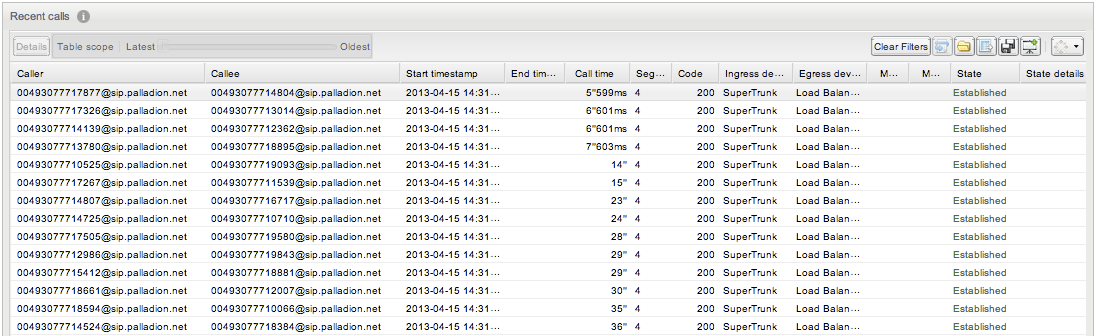
Description of ''Figure 7-27 Calls Panel with Use Users Domains Enabled''
Note:
Realms definitions delimited by domain names only work if this setting is enabled.Voice Quality Chart Scale in Minutes/Minute
Determines the scale of the Voice Quality chart. If true, the scale will be minutes/minute instead of minutes/15 minutes. Default is false (minutes/15 minutes).
Matching a Message to a Device
When a new message arrives, Operations Monitor tries to match it to a source device and to a destination device. The match is made based on the IP address, but there are some additional checks:
-
If the message has VLAN tag N: in order for the message to be matched to a device, the device must have either VLAN=N or no VLAN configured.
-
If source has specific MAC address(es) configured: in order for the message to be matched, the source MAC address of the message must match one of the MAC addresses configured for the device.
-
If destination has specific MAC address(es) configured: in order for the message to be matched, the destination MAC address of the message must match one of the MAC addresses configured for the device.
Matching a Message to an Existing Call Leg
When a new message arrives, Operations Monitor tries to match it to an existing call leg. In order for it to match, the following conditions have to be fulfilled:
-
In case both source IP and destination IP of the new message are configured as a device, the match to the existing leg is successful only if BOTH source and destination devices matched by the new message match the ones of the existing leg. For more information, see "Matching a Message to a Device".
-
In case the source IP or destination IP of a new message is not configured as a device, the following settings are also checked:
-
Transport VLAN aware
If this setting is 'true', Operations Monitor checks that the VLAN tag is the same (or that there is no VLAN tag) before matching this packet to an existing call leg. If this setting is 'false', the VLAN tag is ignored.
Note:
If the device is defined with VLAN=0 or VLAN=off, then the check only matches packets with no VLAN. See "Device Identification" for more information on VLAN tag matching in device definitions. -
Transport MAC aware
If this setting is true, Operations Monitor checks that both source and destination MAC addresses are the same before matching this packet to an existing call leg. If one of the endpoints was already matched via device lookups, the MAC address check for that endpoint is skipped. If this setting is 'false', the MAC address is ignored.
-
Oracle SBC Config Upload
You can create new SIP trunks and devices based on an SBC configuration with the Oracle SBC Config function. The Oracle SBC Config function can also update existing SBC configurations. Every data point (for example, a trunk) that is added from an SBC configuration is marked in the configuration. This allows that all trunks created via an SBC configuration can be identified and later removed.
Figure 7-28 shows the Oracle SBC Config Upload page.
Figure 7-28 Oracle SBC Config Upload Page
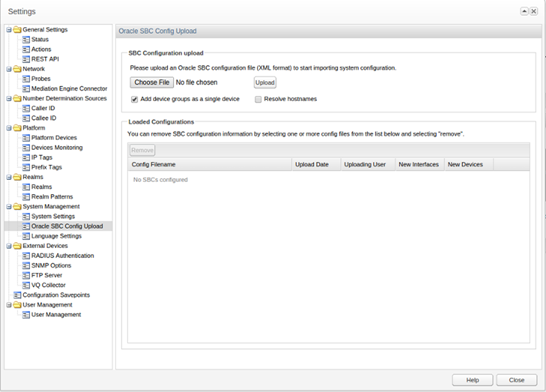
Description of ''Figure 7-28 Oracle SBC Config Upload Page''
The SBC Configuration upload section contains the following check boxes:
-
Add device groups as single device
If this check box is selected before an upload, the session agents in the configuration file that are part of a session agent group are added to Operations Monitor as a single device with multiple IPs.
-
Resolve hostnames
By default, devices that do not have a numeric IP address specified in the configuration file, are skipped. If the Resolve hostnames check box is selected before an upload, Operations Monitor will try to resolve the hostnames for those devices.
Note:
This will increase the processing time for the change.Import Window
The import window shows all the changes that could be committed based on the given SBC configuration.
Figure 7-29 SBC Configuration Import Wizard Page
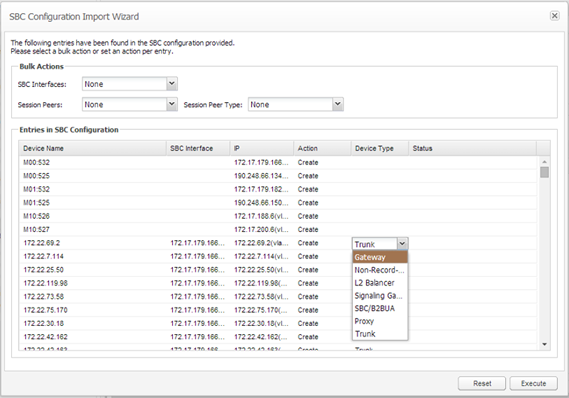
Description of ''Figure 7-29 SBC Configuration Import Wizard Page''
The SBC Configuration Import Wizard dialog box contains the following:
-
Bulk Actions section
Bulk actions set the per data point action to be applied. It does not automatically execute the action but sets the action for the given data points accordingly.
The Bulk Actions section contains the following fields:
-
SBC Interfaces
-
Session Peers
-
Session Peer Types
-
-
Entries in SBC Configuration table
This table lists all the entries that were found in the configuration.
Existing entries are marked with the Create check box disabled so that duplicates cannot be created. Valid options are Create and Ignore. All entries are identified by their IP or IP pair (in case of trunks) address.
The user can double-click a device to rename it.
-
Execute/Reset buttons
The Execute and Reset buttons at the bottom of the page are used to execute all actions on the page or reset to the default values.
Language Settings
The Language Settings page configures the default language for users, as shown in Figure 7-30.
Note:
Each user can have an individual language setting that overrides the default setting.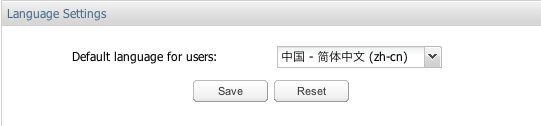
External Devices
You can configure communication with external devices in the External Devices section, which includes the following sub-sections:
RADIUS Authentication
RADIUS authentication allows you to configure whether or not Operations Monitor will perform RADIUS authentication against a RADIUS authentication server each time you log in. See Figure 7-31 for an illustration:
Figure 7-31 Radius Authentication Settings
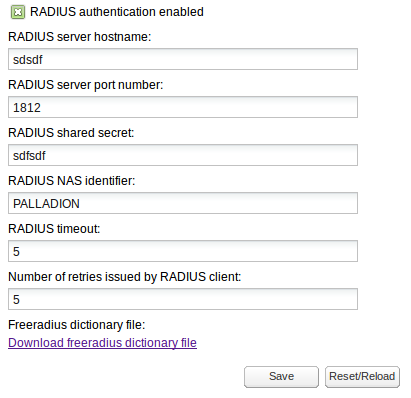
Description of ''Figure 7-31 Radius Authentication Settings''
To enable RADIUS authentication on an Operations Monitor installation, click the RADIUS authentication enabled check box. When enabled:
-
The RADIUS server hostname and RADIUS server port number fields control the address of the RADIUS server against which Operations Monitor performs authentication.
-
The RADIUS shared secret field must contain the secret that is shared by Operations Monitor and the RADIUS server used for authentication.
-
The RADIUS NAS identifier is a string identifier and is used by the RADIUS server to determine whether or not the request is coming from Operations Monitor.
-
The RADIUS timeout is number of seconds to wait response from RADIUS server.
-
The Number of retries issued by RADIUS client is the number of attempts to connect to server, expressed as positive integer value. Number of retries multiplied by timeout value should not exceed 30 (seconds), otherwise both fields (timeout and number of retries) will be marked as invalid.
For more information about RADIUS authentication in Operations Monitor, see "Requirements for RADIUS Authentication".
SNMP Options
The SNMP Options subsection allows you to configure:
-
Whether Operations Monitor sends SNMP traps.
-
Whether Operations Monitor can be queried using SNMP.
Regarding the queries Operations Monitor can answer, they are in turn split in two:
-
All the counters of Operations Monitor are exported as gauges.
-
All operating parameters of the system of Operations Monitor.
SNMP Traps
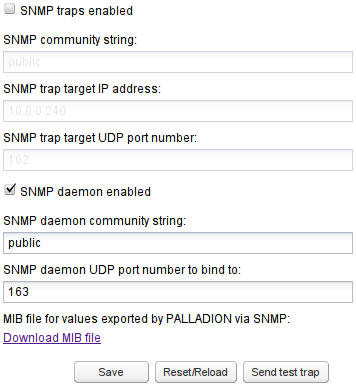
To enable SNMP traps, click the SNMP traps enabled check box as shown in Figure 7-32. When enabled, SNMP traps can be sent on several Alerts. You must configure the SNMP community name, IP address, and port where the SNMP traps will be sent.
To test the settings, a test trap can be sent by clicking Send test trap. To send SNMP traps to more than one target, you enter more than one SNMP trap target IP address.
If you specify more than one community string, Operations Monitor will use the first community string and the first IP address, and so on. You cannot specify more than one port.
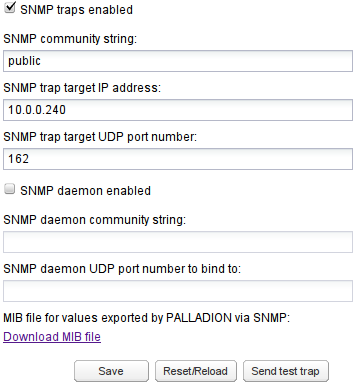
SNMP traps are interpreted using the MIB file, which is downloaded from the SNMP Options configuration page. See Figure 7-32 for an illustration.
The traps include descriptive text which interprets the trap as well as the subsystem that caused the trap to be generated. Included in this description are the current value assigned to the system (value of the counter, IP address, actual user or device name), and the severity of the trap.
Some instances that generate traps are:
-
Counters exceeding thresholds.
-
IP addresses or user names meeting certain conditions.
-
Failing network devices.
SNMP Daemon
To enable SNMP Daemon, click the SNMP daemon enabled check box. With the SNMP daemon enabled, you can query Operations Monitor using SNMP. See Figure 7-33. For SNMP Daemon to work properly, you must also specify the community name and UDP port, which listens for SNMP requests coming in. Operations Monitor supports SNMP Version 2 over UDP.
Exported Counters
The counters are available in the MIB tree under the OID: .1.3.6.1.4.1.29631.2.2.0.256. Enter the following command to list all counter information using Net-SNMP's snmpwalk:
$ snmpwalk -Os -c public 10.1.0.78:162 -v 2c \
   .1.3.6.1.4.1.29631.2.2.0.256
The next node is the counter ID. Under it, the counter object has the following fields as listed in Table 7-7:
Table 7-7 Counter Object Fields
| Field | Description |
|---|---|
|
.0.0 |
The counter ID. |
|
.1.0 |
The name of the counter. |
|
.2.0 |
The device name (if it is a device counter). |
|
.3.0 .4.0 .5.0 |
The counter parameters. |
|
.6.0 |
The current second value. |
|
.7.0 .8.0 .9.0 |
The last minute average/min/max. |
|
.10.0 .11.0 .12.0 |
The last 5 minutes avg/min/max. |
|
.13.0 .14.0 .15.0 |
The last hour avg/min/max. |
For example, here is how to get the active calls counter. Note, that the ID of the counter (422 as used in this example), will vary from one box to another:
$ snmpwalk -Os -c public 10.1.0.78:162 -v 2c  \
     .1.3.6.1.4.1.29631.2.2.0.256.442

enterprises.29631.2.2.0.256.442.1.0 = STRING: "Active calls"
enterprises.29631.2.2.0.256.442.3.0 = INTEGER: 0
enterprises.29631.2.2.0.256.442.4.0 = INTEGER: 0
enterprises.29631.2.2.0.256.442.5.0 = INTEGER: 0
enterprises.29631.2.2.0.256.442.6.0 = Counter64: 136
enterprises.29631.2.2.0.256.442.7.0 = Counter64: 13751
enterprises.29631.2.2.0.256.442.8.0 = Counter64: 133
enterprises.29631.2.2.0.256.442.9.0 = Counter64: 141
enterprises.29631.2.2.0.256.442.10.0 = Counter64: 10319
enterprises.29631.2.2.0.256.442.11.0 = Counter64: 66
enterprises.29631.2.2.0.256.442.12.0 = Counter64: 141
enterprises.29631.2.2.0.256.442.13.0 = Counter64: 10068
enterprises.29631.2.2.0.256.442.14.0 = Counter64: 63
enterprises.29631.2.2.0.256.442.15.0 = Counter64: 141
Note:
When using snmpwalk the following should be considered:-
Because of large values, the Counter64 type is used, but this is not available in SNMPv1. You must use SNMPv2 or later.
-
Even with Counter64 type in use, the counters act like gauges in SNMP talk. For example, over time the value of the counter is presented, and not the sum.
-
The averages are computed per-second. For example, for the last 5 minutes, all the values measured every second are added and then divided by 300. Since we cannot transport floats over SNMP, the avg * 100 is returned. In cacti <http://www.cacti.net/>, you would divide back with 100. In this example, the last 5-minute average, or .10.0, means: On average, there was 103.19 active calls in the last 5 minutes (measured every second).
We recommend this when creating the graphs. The min and max values might also be informative.
System Monitoring
Operations Monitor runs Net-SNMP which provides a large set of monitoring objects for the Operations Monitor system itself. For example, you can get the UC Davis http://www.net-snmp.org/docs/mibs/ucdavis.html values with:
$ snmpwalk -Os -c test1 10.1.0.72:161 -v 2c .1.3.6.1.4.1.2021
As these are standard Unix MIBs, most SNMP managers are able to interpret them.
FTP Server
You can create CDRs, which are based on the traffic displayed and the platform topology configured. For more information, see "Public CDR Generation".
The CDRs generated CDRs, can be retrieved and deleted using FTP or FTPS. To enable access via FTP or FTPS, click the FTP access enabled check box. You must also configure a username and password.
Voice Quality Collector
Operations Monitor can gather the voice quality information sent by IP phones in SIP PUBLISH messages and display it on the Voice Quality page.
As defined in RFC 6035, SIP User Agents may send voice quality reports derived from RTCP Extended Reports (RTCP-XR) and Operations Monitor acts as the collector of SIP vq-rtcpxr events using the PUBLISH method.
The vq-rtcpxr event collector is configurable as shown in Figure 7-34.
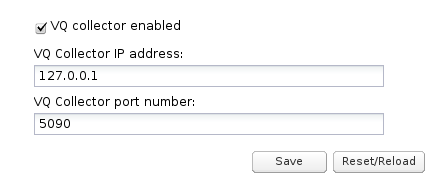
To configure the voice quality collector:
-
Select the VW collector enabled check box to enable the collection of voice quality metric reports.
-
In the VQ Collector IP address field, enter the IP address that is used by the vq-rtcpxr event collector to listen for PUBLISH messages.
-
In the VQ Collector port number field, enter the port number.
-
Click Save.
Note:
The same collector must be configured at the IP phone in order to let it send the voice quality metric reports to Operations Monitor.Configuration Savepoints
Operations Monitor allows you to create configuration snapshots. Savepoints include most of the configuration values:
-
Settings dialog sections:
-
Platform
-
System Management
-
External Devices
-
-
Operations Monitor user accounts
-
Counters currently configured on pages:
-
Monitoring
-
Devices
-
Note:
Custom KPIs and Alerts are not saved in savepoints.The management functionality for configuration savepoints is only available to the administration user. Savepoints can be created and used to restore the above mentioned settings. They can be downloaded as a file and uploaded again.
Note:
Savepoints are only valid for the exact version of the Operations Monitor software by which they have been created.When you upgrade or downgrade its system software, Operations Monitor automatically creates a configuration savepoint before the actual installation. Please check PSA manual for more details about upgrading and downgrading the system. However, you won't see this savepoint unless you downgrade back to the version the savepoint was created under.
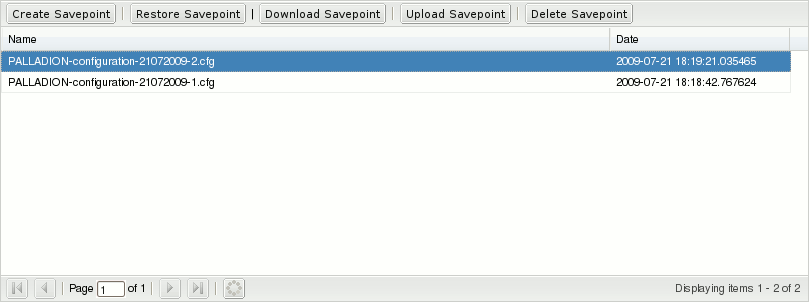
The Configuration Savepoints section (see Figure 7-35) lists all savepoints with name and creation date.
Table 7-8 lists the actions, which are provided by the buttons in the table's toolbar:
Table 7-8 Configuration Savepoint Fields
| Field | Description |
|---|---|
|
Create Savepoint |
Creates a new savepoint from the current Operations Monitor configuration. |
|
Restore Savepoint |
Restores the Operations Monitor configuration contained in the selected savepoint. Note, that on restoring a savepoint, Operations Monitor needs to restart some internal services, which can result in a downtime in monitoring. Restoring a savepoint in an Operations Monitor deployment will result in downtime. The duration of downtime depends on the size and the configuration of the deployment. |
|
Download Savepoint |
Downloads the selected savepoint as a file. |
|
Upload Savepoint |
Uploads an Operations Monitor savepoint contained in a file. |
|
Delete Savepoint |
Removes the selected savepoint from the list and the system. |
Important:
Do not manually alter savepoint files unless you know what you are doing, as this may lead to severe inconsistencies in the Operations Monitor setup.User Management
This section of the configuration allows to administer the access control over the web interface. The Operations Monitor web resources can be accessed concurrently from multiple network locations. This is done using a traditional user access mechanism.
A user is a data set whose most important elements are: a log-in name, a password, a set of access rights, the set of relations to other users, and the realm the user has access to; other less significant elements are name, email address, logo image.
The users are organized into a hierarchy, having admin as root user (with the default password 'oracle'). Any user can create a set of additional sub-users (provided the permission to add extra users is granted). A user has total control over the sub-users that he created, he can change any of the elements that constitute a sub-user.
The access to the web interface is fragmented into individual, non-overlapping domains. In order to access such a domain, a user needs to have the permission (or right) to do so. These rights, that control which parts of the web interface a user can see, are granted by the parent user that created it. Of course, the user admin has unrestricted access.
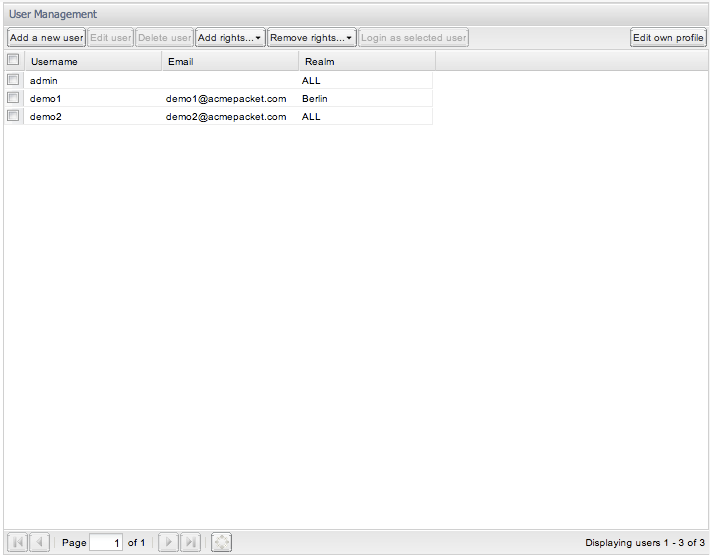
The User Management panel features seven buttons, as shown in Figure 7-36.
The left most three of them allow a user to manage his sub-users: Add a new, edit an already added one, or remove a no longer needed user. To modify or delete a sub-user, its parent-user needs to select a row out of the table and press the corresponding button. Both the Add a new user and the Edit user buttons invoke a wizard (in a new window) asking for the needed detail in order to set-up a new or change an existing user. The Add rights...and the Remove rights... buttons make it possible to add selected rights to selected or all users created by the current user, respectively to remove selected rights from selected or all users created by the current user. The rights to add or remove can be selected in a wizard, that is in accordance with the last two pages of the wizard. The Login as selected user button allows a parent user to login as a sub-user without having to enter a password. The Edit own profile button to the right of the page allows the current user to edit one's own profile information.
Add a New User
We'll next walk through the steps needed to add a new user. The same steps need to be performed for editing a user, with the difference that a field for the name of the new user is present when adding. When editing one's own profile, only the first step of this process is necessary.
User Information
The first step, named User Information, requires providing the log-in name (the username), an optional email address, and a password (asked two times to prevent accidental mistyping) as can be seen in Figure 7-37. Instead of entering a password, it is also possible to opt for RADIUS authentication, if RADIUS authentication has been set up for this Operations Monitor instance. To learn more about Operations Monitor's RADIUS authentication feature, see "Requirements for RADIUS Authentication".
Figure 7-37 Setting User Information for a New User
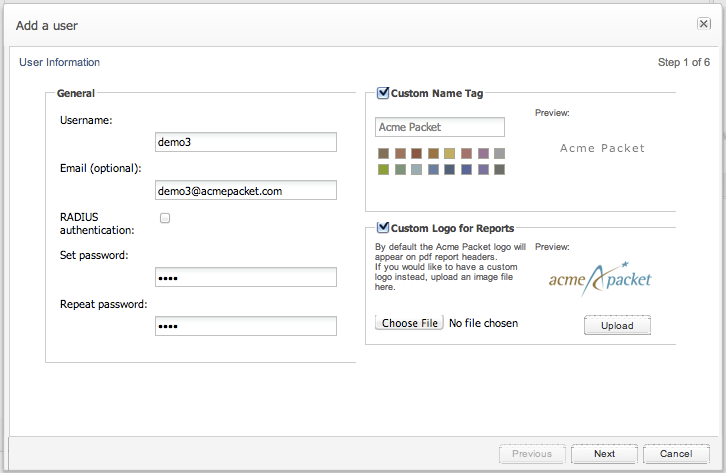
Description of ''Figure 7-37 Setting User Information for a New User''
A logo image is located in the upper left corner of the interface. By default, this is the Oracle logo, but it can be customized for each individual user; this is useful when the web interface is accessed by multiple clients of the same provider, sharing the same Operations Monitor setup. The Custom Logo for Reports section provides an upload field where the user can insert the picture to use as a logo.
Note:
The following logo formats are supported: TIF, TIFF, EPS, PDF, JPG, JPEG, GIF, and PNG.After specifying the path, one must upload the file by pressing on the Upload image button.
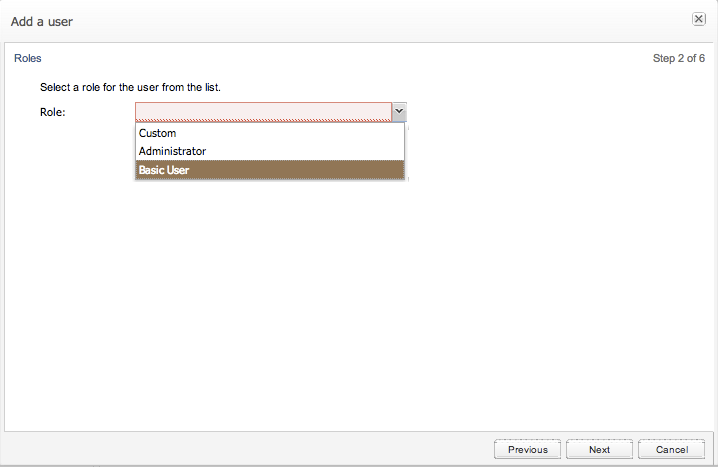
Selecting a Role
After choosing a username and password, the user is given the option of selecting a role (See Figure 7-38) providing roles have been defined in addition to the custom role. If no roles are available, the dialogue will continue directly to the realms selection if they exist, otherwise onto the individual permissions selection.
Figure 7-38 Setting a Role for a New User
Description of ''Figure 7-38 Setting a Role for a New User''
User Permissions
In case User Roles is enabled (see Figure 7-38), a role is set for the user that gives the user a predefined set of permissions that are tied to the role. For more information on role management, see "Role Management".
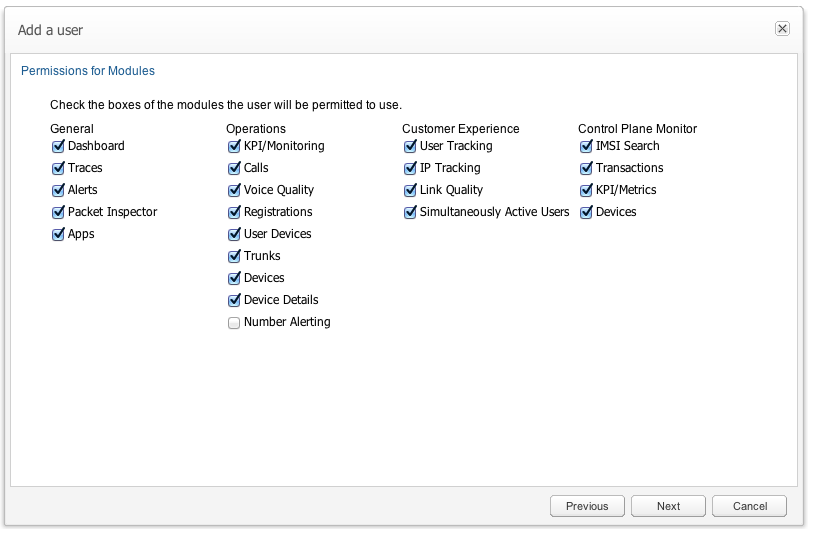
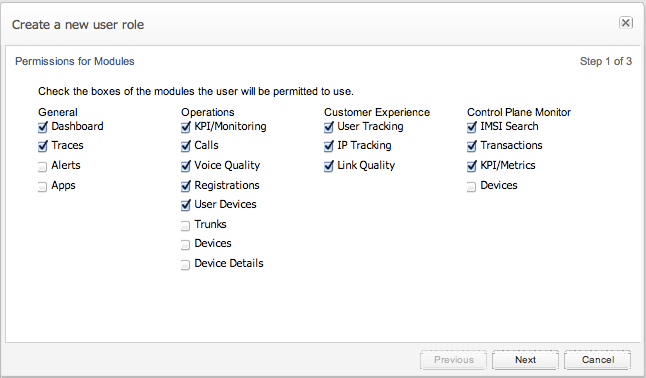
In case User Roles is disabled, the permissions need to be set individually for each module (see Figure 7-39) and for each setting.
The Permissions for Modules page, is where the parent user can control what the new user will be able to access. The set of permissions are grouped in four, reflecting the grouping of functionality on the actual web interface:
-
General
-
Operations
-
Customer Experience
-
Control Plane Monitor
Each check box in these groups corresponds to a menu item in the main menu of Operations Monitor. If it is checked, the new user will have the corresponding menu item in his main menu.
Figure 7-39 Setting Permissions for Modules for a New User
Description of ''Figure 7-39 Setting Permissions for Modules for a New User''
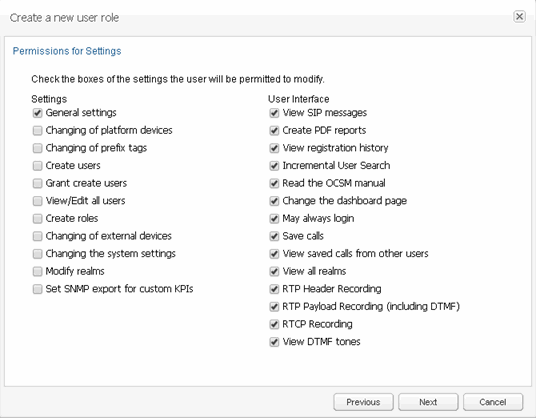
The Permissions for Settings page can control what settings the created user will be allowed to modify. The access right to some advanced functionality of Operations Monitor can also be controlled here.
The check boxes in the Settings group to the left of the section roughly correspond to sections in the settings dialog.
Table 7-9 describes the user setting options.
Table 7-9 User Settings Options
| Field | Description |
|---|---|
|
Changing of platform settings |
If checked, the created user is allowed to access the Platform Settings section in the Operations Monitor settings dialog. |
|
Changing of prefix tags |
If checked, the user is allowed to change the number prefix tags in the Platform Settings. However, the user will still be able to view them even without this permission. |
|
Create users |
If checked, the created user is allowed to create and manage new users himself using the User Management section of the Operations Monitor settings dialog. |
|
Grant create users |
If checked, the created user can grant the 'Create users' permission described above. |
|
View/Edit all users |
If checked, the user is able to see and modify users created by other users. |
|
Create roles |
If checked, the user is able to view and modify the roles management section in the user management folder. For more information, see "Role Management". |
|
Changing of external devices |
If checked, the created user is allowed to access the External Devices section in the Operations Monitor settings dialog. |
|
Changing the system settings |
If checked, the created user is allowed to access the System Settings section in the Operations Monitor settings dialog. |
|
Modify realms |
If checked, the created user is able to view and modify the realms management section of the settings. If the user is assigned a realm, on a previous screen, he will only be able to modify realms that intersect or are contained within the user's own realm. |
Table 7-10 describes the user interface setting options.
Table 7-10 User Interface Settings Options
| Field | Description |
|---|---|
|
View SIP messages |
If checked, the created user can see only the SIP message headers in the messages tab of the Call Details window and in the Registration Details window. For more information, see "Calls" and "Registrations". |
|
View SIP message bodies |
If checked, the created user can view SIP message bodies in the messages tab of the Call Details window and in the Registration Details window. For more information, see "Calls" and "Registrations". Message bodies cannot be captured in packet capture downloads unless they are set as viewable to the user. |
|
Create PDF reports |
If checked, the new user can create PDF call reports on the Calls page. For more information, see "Calls". |
|
View registration history |
If checked, the new user is allowed to see the registration history of a platform user in the User Tracking page. For more information, see "User Tracking". |
|
Incremental User Search |
If checked, the new user is allowed to use the incremental user search on the User Tracking page. For more information, see "User Tracking". |
|
Read the OCSM manual |
If checked, the new user is allowed to see the online version of the Operations Monitor User's Guide. |
|
Change the dashboard page |
If checked, the new user is allowed to add and remove items from the Dashboard page. |
|
May always log in |
If checked, the new user is always allowed to log in, even if the concurrent session limit for one user or the global concurrent session limit is surpassed. In case the global concurrent session limit is surpassed, another user will be logged out in order to allow this user to log in. |
|
Save calls |
If checked, the new user is allowed to save calls for further debugging. |
|
View saved calls from other users |
If checked, the new user is allowed to view the saved calls created by other users. |
|
View all realms |
If checked, the new user is allowed to view all the realms not only the ones created by itself. |
|
RTP Header Recording |
If checked, the new user is allowed to record the header part of RTP packet in a call. |
|
RTP Payload Recording |
If checked, the new user is allowed to record the entire RTP packets of a call. This includes audio, video, and image data, voice quality data, and DTMF tones. |
|
RTCP Recording |
If checked, the new user is allowed to record RTCP voice quality data. |
|
View DTMF Tones |
If checked, the new user is allowed to view DTMF tones in the call flow diagram and to see the presence of DTMF tones in a call in the calls grid. |
User Realm
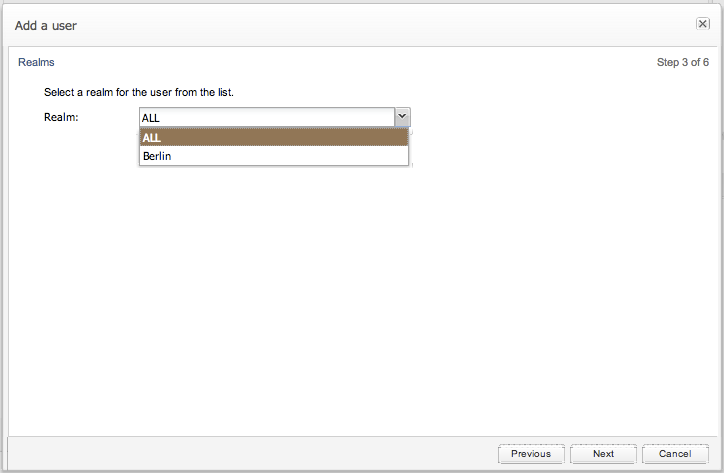
The second step sets the realms that the future user will be able to access.
A user assigned to a realm can only see devices that are also assigned to that realm. Users assigned to the realm ALL are unrestricted and can see all devices, regardless of the realm the device is assigned to. For more information about the realm concept in Operations Monitor, see "Realms Definitions."
On the KPI/Metrics page, users also only see the devices listed in their assigned realm. For more information, see "KPI/Metrics."
A user can access either one or ALL the realms (see Figure 7-40).
Figure 7-40 Setting Realm for a New User
Description of ''Figure 7-40 Setting Realm for a New User''
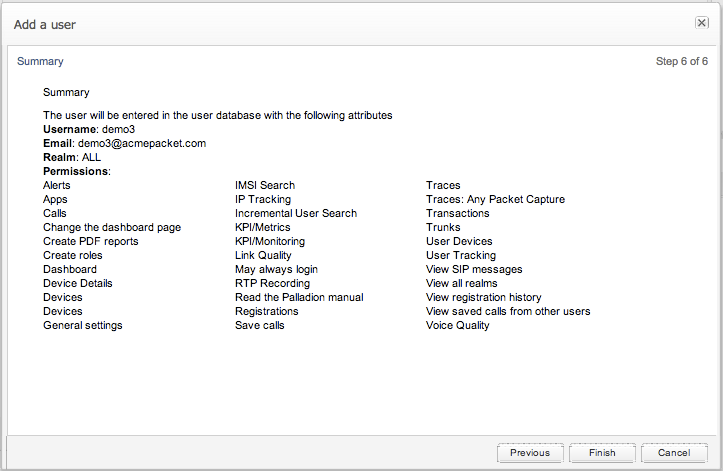
Overview Information
The summary as shown in Figure 7-41 gives a brief overview of the new user. Included is the username, email address (if entered), role, realm and permissions bitmask.
Requirements for RADIUS Authentication
When a user logs in, Operations Monitor supports RADIUS authentication if it has been enabled in the RADIUS Authentication section of the Settings dialog box. RADIUS authentication is performed if it has been enabled for the user.
For RADIUS authentication to work, the RADIUS server has to respond to the Operations Monitor access request sent with the set of required user attributes. Operations Monitor sends its access request with a configurable NAS_Identifier attribute, which can be used to identify requests from Operations Monitor on the server side, and with the encrypted password as the Password attribute. Upon successful authentication, Operations Monitor expects the following user attributes:
Table 7-11 RADIUS Authentication User Attributes
| Attribute | Description |
|---|---|
|
PLD-User-First-Name |
Not applicable. |
|
PLD-User-Last-Name |
Not applicable. |
|
PLD-User-Email |
(Optional) The e-mail address of the user. |
|
PLD-User-Realm |
The integer realm ID of the user's realm. |
|
PLD-User-Creator |
The user ID of the parent user for the user. |
|
PLD-User-Permissions |
A bitmask describing the permissions of the user. |
|
PLD-User-Logo |
(Optional) A field containing the logo image for the user. |
|
PLD-User-Options |
A JSON-encoded object describing per user options. |
The numeric IDs for these user attributes are defined in a RADIUS dictionary file, which is delivered together with Operations Monitor.
Note:
The PLD-User-First-Name and PLD-User-Last-Name fields in the radius definition are not usedThe PLD-User-Permissions attribute deserves special explanation. It contains a bitmask describing the permissions that a user has. Each of the permissions introduced above has a position in the bitmask. To generate a specific permissions bitmask you can use the wizard for adding users (choose RADIUS authentication on the first page of the wizard, then select the appropriate permissions, and the permissions bitmask will be displayed on the last page of the wizard).
Password Settings
In this folder of the Operations Monitor settings, you can define the password settings that are followed by users.
Select the Force users to change their password regularly check box for access to password change settings. Modify the period (in days) to force a password change:
-
For users with access to sensitive data, the default setting is 90 days.
-
For users without access to sensitive data, the default setting is 180 days.
Note:
The entries in these fields are applied when the user next changes the password.
Select the Enforce stringent password rules check box to increase the level of security required in user passwords.
Click Save when you are finished.
Role Management
In this folder of the Operations Monitor settings, the user roles are administered to define default sets of permissions for users. It is not required to assign a role to a user, however it is recommended as it simplifies the user creation process. An example of this panel is seen in Figure 7-42.
For instance an administrator role would generally contain all permissions, a power user may contain most screens and a subset of system permissions, and a basic user a subset of screens. During the user creation process if a role other 'custom' is selected, then later on the individual permission check boxes will be skipped.
Note:
Regarding role management, the terms permissions and rights are used interchangeably.
Note:
By default, the roles feature is disabled. In order to make use of the roles, the User Roles system setting must be enabled.Adding a Role
Adding a role is performed after selecting the Add a new role button. As shown in Figure 7-43, Figure 7-44, and Figure 7-45. This is equivalent to the permissions screens of adding a new user, however after setting the permissions there is a prompt for the role name, see Figure 7-45. The role name is mandatory.
Figure 7-43 Setting Permissions for Modules for a New Role
Description of ''Figure 7-43 Setting Permissions for Modules for a New Role''
Figure 7-44 Setting Permissions for Settings for a New Role
Description of ''Figure 7-44 Setting Permissions for Settings for a New Role''
Figure 7-45 Setting the Name of the Role
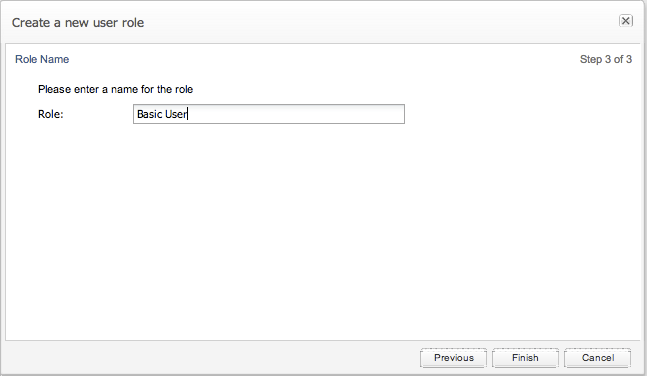
Description of ''Figure 7-45 Setting the Name of the Role''
Editing a Role
After selecting only one role, it may be edited by selecting the Edit option in the role management panel. When multiple roles are selected this option is not available.
Deleting a Role
Deleting a role may also only be performed after selecting a single role. There is a confirmation prompt that must be confirmed before the role is deleted.
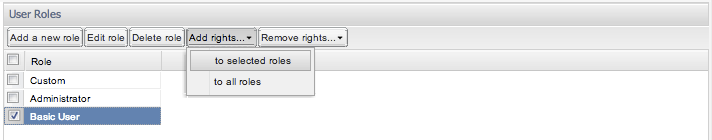
Adding Rights to a Role
One can either add rights to a selected role or generally to all roles. This can be selected as demonstrated in Figure 7-46 and Figure 7-47. The following dialogue is equivalent to the normal role dialogue, only without the option to change a role name. The selected check boxes designate which rights will be added to the selected role(s).
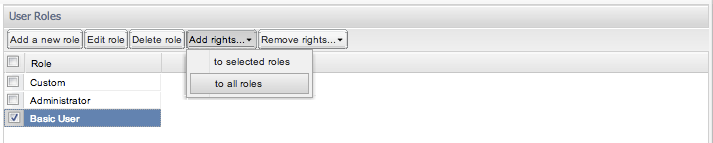
Figure 7-47 Adding Rights to Selected Roles
Description of ''Figure 7-47 Adding Rights to Selected Roles''
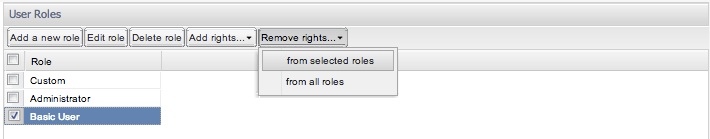
Removing Rights from a Role
Likewise, one can remove rights from individual roles or generally across all roles. This is selected as shown in the images Figure 7-48 and Figure 7-49. Removing rights is the mirror process to adding rights, with the selected check boxes will be removed from the selected role(s).
Figure 7-48 Removing Rights from All Roles
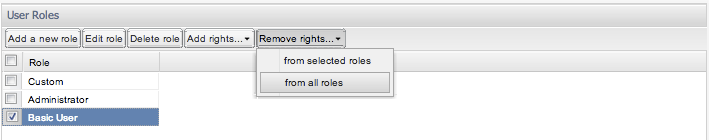
Description of ''Figure 7-48 Removing Rights from All Roles''
Figure 7-49 Removing Rights from Selected Roles
Description of ''Figure 7-49 Removing Rights from Selected Roles''