6 Control Plane Monitor
The Oracle Communications Control Plane Monitor product offers Diameter transaction monitoring. The following Diameter interfaces are supported:
-
S6a
-
S6d
-
S13
-
S13'
Note:
The Oracle Communications Operations Monitor product also supports the IMS Cx interface. The Cx Diameter messages are correlated with SIP calls, so they will show up in the Calls UI but not in the Control Plane Monitor UI.KPI/Metrics
The Control Plane Monitor KPI/Metrics page offers similar functionality as the KPI/Metrics page from the Operations Monitor product. The difference is that only Diameter specific KPIs are available, and they are not editable.
Figure 6-1 shows the Control Plane Monitor KPI/Metrics page.
Figure 6-1 Control Plane Monitor KPI/Metrics Page
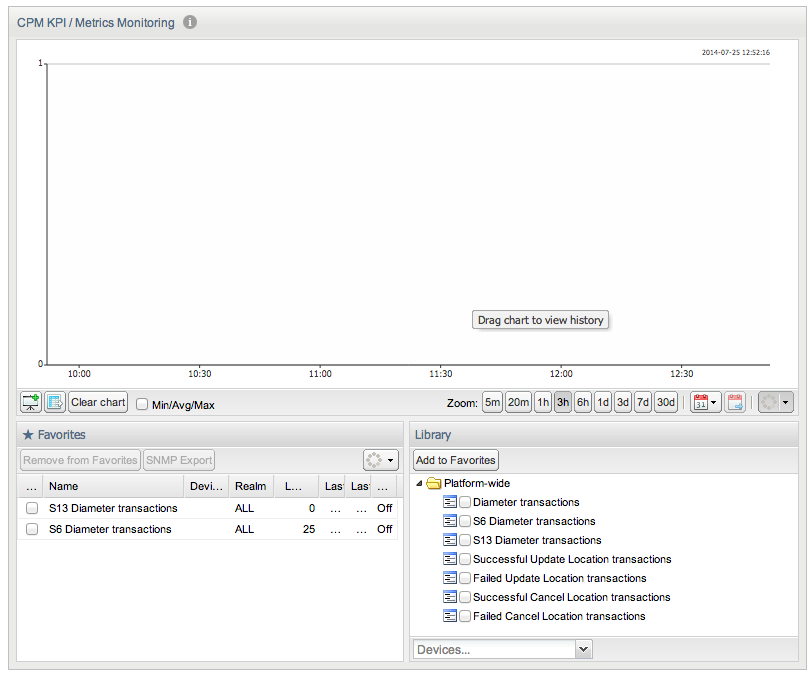
Description of ''Figure 6-1 Control Plane Monitor KPI/Metrics Page''
Currently, the following Platform Wide KPIs are available:
-
Diameter transactions
Number of new hop-by-hop Diameter transactions per second that pass the filter configured in the Platform Setup Application, regardless of Application ID.
-
S6 Diameter transactions
Number of new hop-by-hop Diameter transactions per second that have the Application ID 16777251 (3GGP S6a/S6d).
-
S13 Diameter transactions
Number of new hop-by-hop Diameter transactions per second that have the Application ID 16777252 (3GGPS13/S13').
-
Successful Update Location transactions
Number of completed hop-by-hop Diameter transactions per second that have the Diameter command 316 (Update Location) and the result code 2001 (Success).
-
Failed Update Location transactions
Number of completed hop-by-hop Diameter transactions per second that have the Diameter command code 316 (Update Location) and a result code different from 2001 (Success).
-
Successful Cancel Location transactions
Number of completed hop-by-hop Diameter transactions per second that have the Diameter command 317 (Cancel Location) and the result code 2001 (Success).
-
Failed Cancel Location transactions
Number of completed hop-by-hop Diameter transactions per second that have the Diameter command code 317 (Cancel Location) and a result code different from 2001 (Success).
The following KPIs are available on a per-device basis:
-
Incoming S6 Diameter transactions
Number of new Diameter transactions per second that are received by the given device and have the Application ID 16777251 (3GGP S6a/S6d).
-
Outgoing S6 Diameter transactions
Number of new Diameter transactions per second that are created by the given device and have the Application ID 16777251 (3GGP S6a/S6d).
-
Successful incoming Update Location transactions
Number of completed Diameter transactions that are received by the given device and have the Diameter command 316 (Up- date Location) and the result code 2001 (Success).
-
Failed incoming Update Location transactions
Number of completed Diameter transactions that are received by the given device and have the Diameter command 316 (Update Location) and a result code different from 2001 (Success).
-
Successful incoming Cancel Location transactions
Number of completed Diameter transactions that are received by the given device and have the Diameter command 317 (Cancel Location) and the result code 2001 (Success).
-
Failed incoming Cancel Location transactions
Number of completed Diameter transactions that are received by the given device and have the Diameter command 317 (Cancel Location) and a result code different from 2001 (Success).
Transactions
The Transaction page is the central repository for transaction analysis in Control Plane Monitor. You can analyze the transaction traversing the platform in real-time or historically. Control Plane Monitor automatically correlates the transactions into End-to-End transactions.
This page contains two panels: the top one shows the Diameter transactions KPI while the bottom one contains the recent S6/S13 transactions. As shown in Figure 6-2.
Figure 6-2 Control Plane Monitor Transactions Page
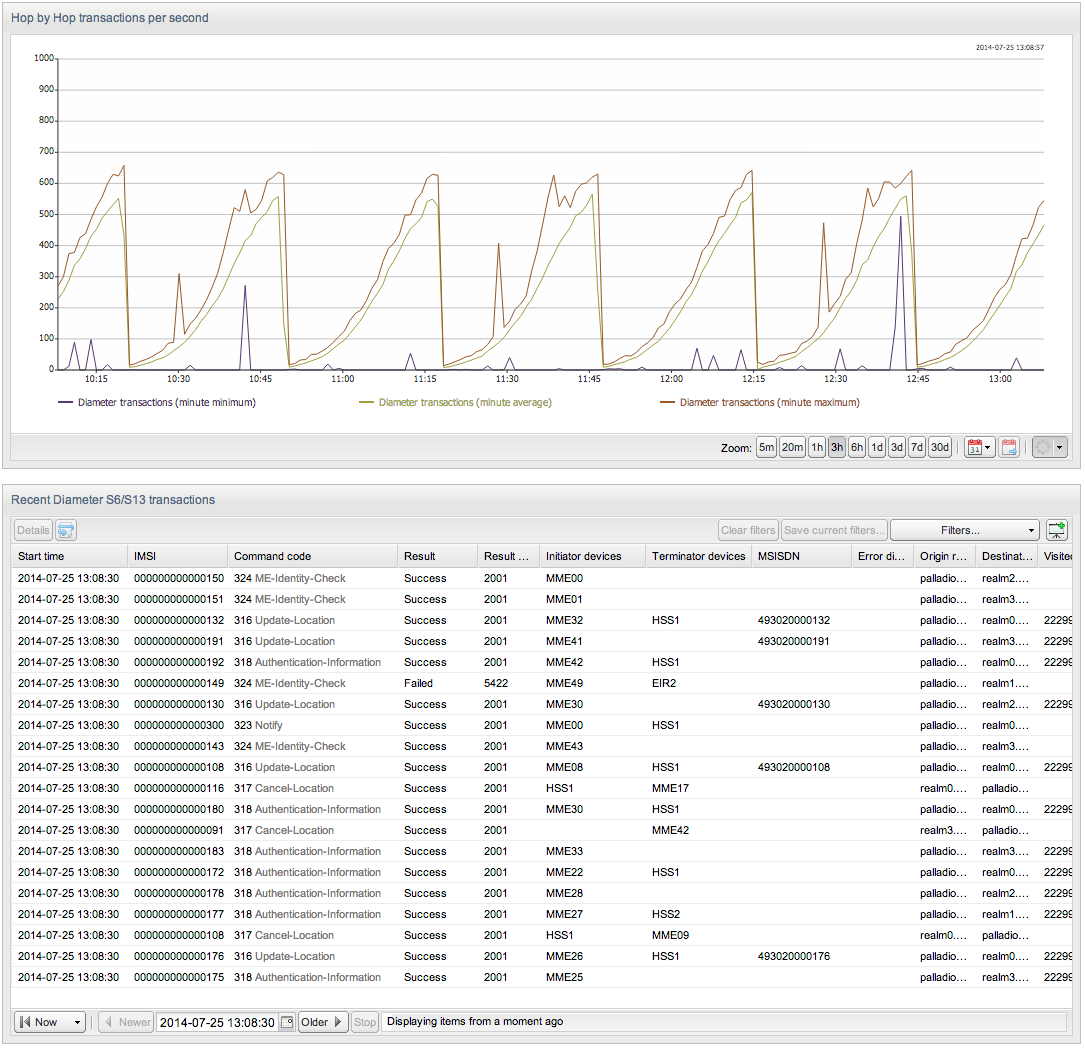
Description of ''Figure 6-2 Control Plane Monitor Transactions Page''
Filtering Columns
The Transactions table supports Filtering for all columns. Figure 6-3 shows an example of filtering that selects all transactions with a given command code. For more information, see "Filtering."
Figure 6-3 Control Plane Monitor Filtering
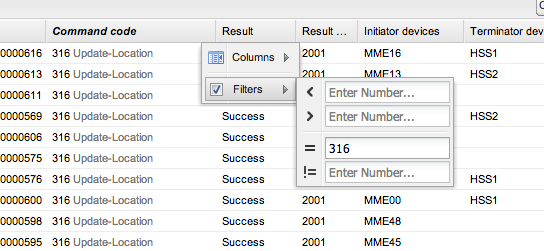
Description of ''Figure 6-3 Control Plane Monitor Filtering''
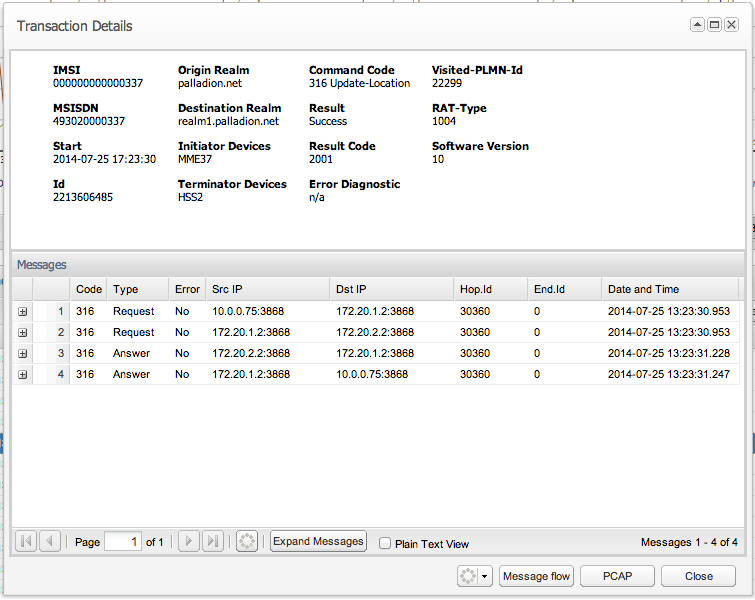
Transaction Details
To open the Transaction details window, double-click on a row from the Recent S6/S13 transactions table or select the transaction and click the Details button.
The upper portion for the window contains brief identification information of the transaction: the IMSI, the Diameter realms, the MSISDN and so on.
The bottom portion of the window contains the list of messages composing the transaction. You can drill down in the details of each message by expanding the tree.
Click the Message flow button to open a message flow diagram with the messages involved in this transaction.
To save the raw messages of the transaction into a PCAP file, click the PCAP button.
Figure 6-4 shows the Transaction Details window.
Message Flow
You can generate a message flow diagram by two means:
-
Select one or more transactions from the Recent S6/S13 Transaction list and click the Draw Diagram button from the top toolbar. To select more transactions, hold the Shift key while selecting.
-
Open the Transaction details window for a given transaction and click the Message Flow window.
Devices
The Devices page (see Figure 6-5) offers a device centric view of the Diameter transaction and KPIs.
Figure 6-5 Control Plane Monitor Devices Page
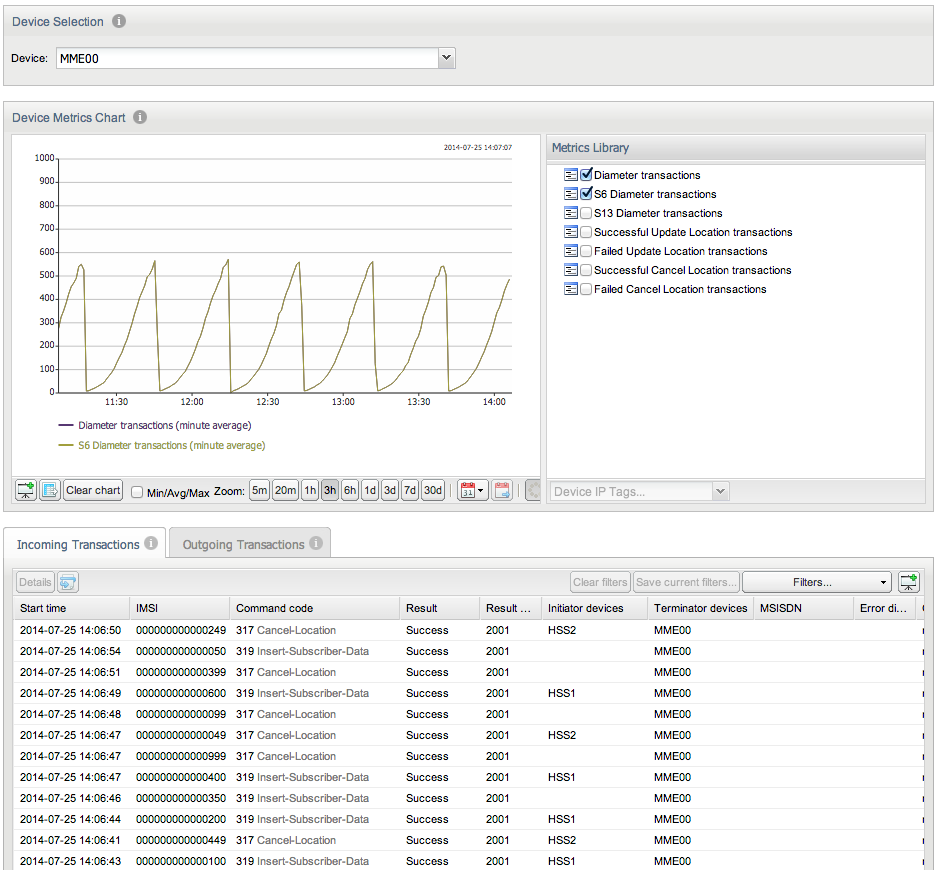
Description of ''Figure 6-5 Control Plane Monitor Devices Page''
The Device Selection panel determines the device whose details are displayed on the page. Only configured diameter devices are available in this drop down. For example, HSS, Diameter agent, and Diameter proxy. For more information on the diameter devices, see Table 7-3.
The Device Metrics Chart displays the evolution of the selected device metrics from the Metrics Library.
You can add the Device Metrics Chart to the Dashboard by clicking the Show in Dashboard icon button.
At the bottom of the chart, the Show Min/Avg/Max check box controls whether minute or hour minima and maxima are displayed for each selected metric. For more information on the chart panel controls, see "Charts".
Incoming Transactions
The Incoming Transactions tab is similar with the Recent S6/S13 Transactions panel, which is described in "Transactions". The table displays only the transactions which have an inbound leg to the current device.
Outgoing Transactions
The Outgoing Transactions tab is similar with the Recent S6/S13 Transactions panel, which is described in "Transactions". The table displays only the transactions which have an outbound leg from the current device.
IMSI Search
The IMSI Search page (see Figure 6-6) displays information about a particular IMSI. To choose the IMSI you can either enter it in the search box from the top of the page or use the right-click menu from the Transactions list.
Figure 6-6 Control Plane Monitor IMSI Search Page
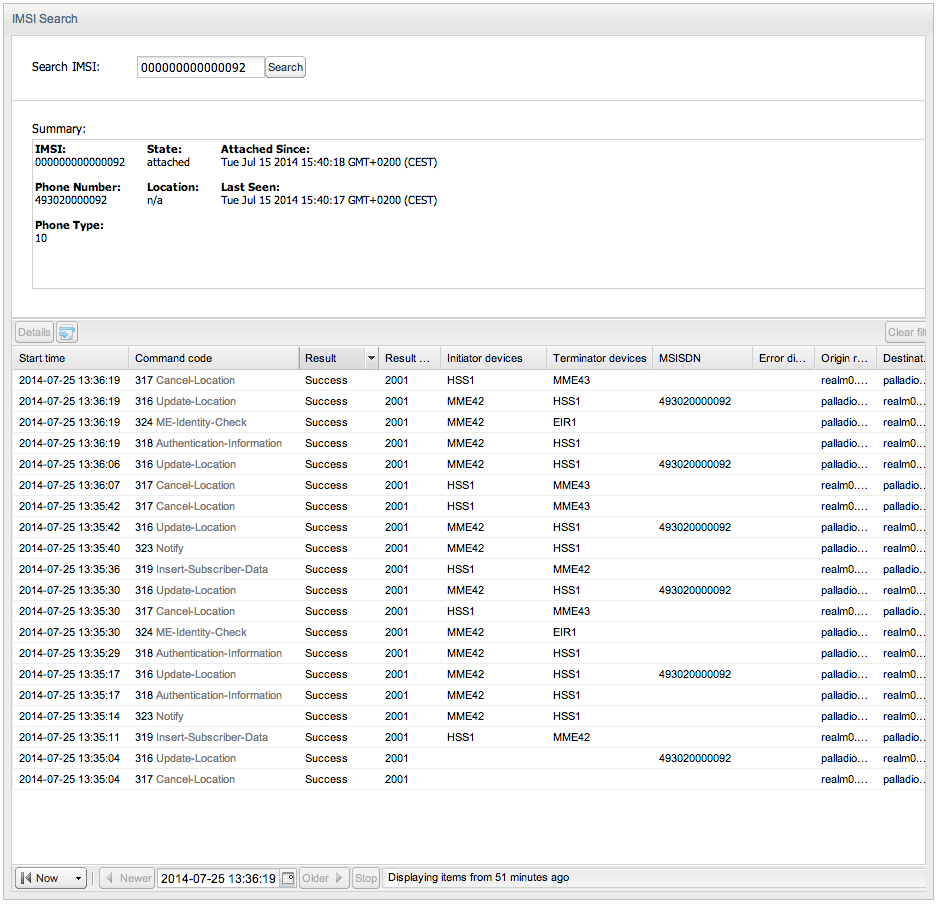
Description of ''Figure 6-6 Control Plane Monitor IMSI Search Page''
The Summary section provides high-level information about the selected IMSI number, including the current attachment state and the phone number.
The transactions list from the bottom is similar with the one from the Transactions page, but it is pre-filtered by the selected IMSI.