Using JavaFX Charts
7 Bar Chart
This chapter describes the bar chart, a two-axis chart with rectangular bars that can be either vertical or horizontal.
The length of each bar is proportional to a particular value that the chart presents. Typically, bar charts are used to display discrete data. You can use groups of bars as categories to plot data, as shown in Figure 7-1.
Creating a Bar Chart
To build a bar chart in your JavaFX application, create two axes, instantiate the BarChar class, define the series of data, and assign the data to the chart. Example 7-1 creates a bar chart with three series of data to present financial information about five countries. Each country is presented as a category that is a group of bars on the horizontal axis.
Example 7-1 Creating a Bar Chart with Three Series of Data
import javafx.application.Application;
import javafx.scene.Scene;
import javafx.scene.chart.BarChart;
import javafx.scene.chart.CategoryAxis;
import javafx.scene.chart.NumberAxis;
import javafx.scene.chart.XYChart;
import javafx.stage.Stage;

public class BarChartSample extends Application {
    final static String austria = "Austria";
    final static String brazil = "Brazil";
    final static String france = "France";
    final static String italy = "Italy";
    final static String usa = "USA";

    @Override public void start(Stage stage) {
        stage.setTitle("Bar Chart Sample");
        final CategoryAxis xAxis = new CategoryAxis();
        final NumberAxis yAxis = new NumberAxis();
        final BarChart<String,Number> bc =
            new BarChart<String,Number>(xAxis,yAxis);
        bc.setTitle("Country Summary");
        xAxis.setLabel("Country");
        yAxis.setLabel("Value");

        XYChart.Series series1 = new XYChart.Series();
        series1.setName("2003");
        series1.getData().add(new XYChart.Data(austria, 25601.34));
        series1.getData().add(new XYChart.Data(brazil, 20148.82));
        series1.getData().add(new XYChart.Data(france, 10000));
        series1.getData().add(new XYChart.Data(italy, 35407.15));
        series1.getData().add(new XYChart.Data(usa, 12000));

        XYChart.Series series2 = new XYChart.Series();
        series2.setName("2004");
        series2.getData().add(new XYChart.Data(austria, 57401.85));
        series2.getData().add(new XYChart.Data(brazil, 41941.19));
        series2.getData().add(new XYChart.Data(france, 45263.37));
        series2.getData().add(new XYChart.Data(italy, 117320.16));
        series2.getData().add(new XYChart.Data(usa, 14845.27));

        XYChart.Series series3 = new XYChart.Series();
        series3.setName("2005");
        series3.getData().add(new XYChart.Data(austria, 45000.65));
        series3.getData().add(new XYChart.Data(brazil, 44835.76));
        series3.getData().add(new XYChart.Data(france, 18722.18));
        series3.getData().add(new XYChart.Data(italy, 17557.31));
        series3.getData().add(new XYChart.Data(usa, 92633.68));

        Scene scene  = new Scene(bc,800,600);
        bc.getData().addAll(series1, series2, series3);
        stage.setScene(scene);
        stage.show();
    }

    public static void main(String[] args) {
        launch(args);
    }
}
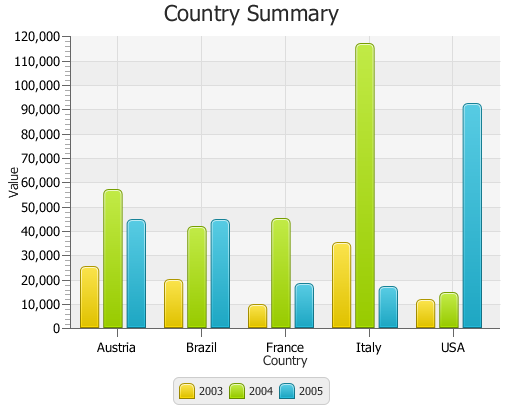
Figure 7-2 shows the expected output of this application when you compile and run it.
Figure 7-2 Creating a Bar Chart with Three Series of Data
Description of "Figure 7-2 Creating a Bar Chart with Three Series of Data"
Two properties of the BarChart class enable managing space between categories of data and between bars within the same category. Use the barGap and categoryGap properties to better distribute bars in the chart plot. Example 7-2 uses the setBarGap and setCategoryGap methods to set specific values for these properties.
Horizontal Bar Chart
You can change the orientation of the bar chart from vertical to horizontal by defining the category for the vertical axis. Example 7-3 implements this for the Country Summary application. Declare the horizontal axis of the NumberAxis type and the vertical axis of the CategoryAxis type. Do not forget to modify the declaration of the BarChart object.
Example 7-3 Changing Orientation of the Bar Chart
import javafx.application.Application;
import javafx.scene.Scene;
import javafx.scene.chart.BarChart;
import javafx.scene.chart.CategoryAxis;
import javafx.scene.chart.NumberAxis;
import javafx.scene.chart.XYChart;
import javafx.stage.Stage;

public class BarChartSample extends Application {
    final static String austria = "Austria";
    final static String brazil = "Brazil";
    final static String france = "France";
    final static String italy = "Italy";
    final static String usa = "USA";

    @Override public void start(Stage stage) {
        stage.setTitle("Bar Chart Sample");
        final NumberAxis xAxis = new NumberAxis();
        final CategoryAxis yAxis = new CategoryAxis();
        final BarChart<Number,String> bc =
            new BarChart<Number,String>(xAxis,yAxis);
        bc.setTitle("Country Summary");
        xAxis.setLabel("Value");
        xAxis.setTickLabelRotation(90);
        yAxis.setLabel("Country");

        XYChart.Series series1 = new XYChart.Series();
        series1.setName("2003");
        series1.getData().add(new XYChart.Data(25601.34, austria));
        series1.getData().add(new XYChart.Data(20148.82, brazil));
        series1.getData().add(new XYChart.Data(10000, france));
        series1.getData().add(new XYChart.Data(35407.15, italy));
        series1.getData().add(new XYChart.Data(12000, usa));

        XYChart.Series series2 = new XYChart.Series();
        series2.setName("2004");
        series2.getData().add(new XYChart.Data(57401.85, austria));
        series2.getData().add(new XYChart.Data(41941.19, brazil));
        series2.getData().add(new XYChart.Data(45263.37, france));
        series2.getData().add(new XYChart.Data(117320.16, italy));
        series2.getData().add(new XYChart.Data(14845.27, usa));

        XYChart.Series series3 = new XYChart.Series();
        series3.setName("2005");
        series3.getData().add(new XYChart.Data(45000.65, austria));
        series3.getData().add(new XYChart.Data(44835.76, brazil));
        series3.getData().add(new XYChart.Data(18722.18, france));
        series3.getData().add(new XYChart.Data(17557.31, italy));
        series3.getData().add(new XYChart.Data(92633.68, usa));

        Scene scene  = new Scene(bc,800,600);
        bc.getData().addAll(series1, series2, series3);
        stage.setScene(scene);
        stage.show();
    }

    public static void main(String[] args) {
        launch(args);
    }
}
Note that the setTickLabelRotation method is called on the horizontal axis to rotate labels and make the value captions easier to read.
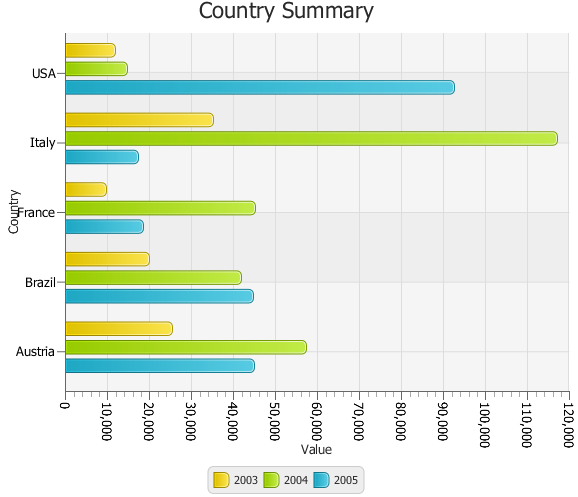
The result of compiling and running the modified application is shown in Figure 7-3.
Horizontal bar charts can be particularly helpful when you want to represent data as ranked lists.
Creating a Stacked Bar Chart
You can represent data in a bar chart so that the bars in a category are stacked. Use the StackedBarChart class available in the JavaFX API, as shown in Example 7-4.
Example 7-4 Creating a Stacked Bar Chart
import java.util.Arrays;
import javafx.application.Application;
import javafx.collections.FXCollections;
import javafx.scene.Scene;
import javafx.scene.chart.CategoryAxis;
import javafx.scene.chart.NumberAxis;
import javafx.scene.chart.StackedBarChart;
import javafx.scene.chart.XYChart;
import javafx.stage.Stage;

public class StackedBarChartSample extends Application {

    final static String austria = "Austria";
    final static String brazil = "Brazil";
    final static String france = "France";
    final static String italy = "Italy";
    final static String usa = "USA";
    final CategoryAxis xAxis = new CategoryAxis();
    final NumberAxis yAxis = new NumberAxis();
    final StackedBarChart<String, Number> sbc =
            new StackedBarChart<String, Number>(xAxis, yAxis);
    final XYChart.Series<String, Number> series1 =
            new XYChart.Series<String, Number>();
    final XYChart.Series<String, Number> series2 =
            new XYChart.Series<String, Number>();
    final XYChart.Series<String, Number> series3 =
            new XYChart.Series<String, Number>();

    @Override
    public void start(Stage stage) {
        stage.setTitle("Bar Chart Sample");
        sbc.setTitle("Country Summary");
        xAxis.setLabel("Country");
        xAxis.setCategories(FXCollections.<String>observableArrayList(
                Arrays.asList(austria, brazil, france, italy, usa)));
        yAxis.setLabel("Value");
        series1.setName("2003");
        series1.getData().add(new XYChart.Data<String, Number>(austria, 25601.34));
        series1.getData().add(new XYChart.Data<String, Number>(brazil, 20148.82));
        series1.getData().add(new XYChart.Data<String, Number>(france, 10000));
        series1.getData().add(new XYChart.Data<String, Number>(italy, 35407.15));
        series1.getData().add(new XYChart.Data<String, Number>(usa, 12000));
        series2.setName("2004");
        series2.getData().add(new XYChart.Data<String, Number>(austria, 57401.85));
        series2.getData().add(new XYChart.Data<String, Number>(brazil, 41941.19));
        series2.getData().add(new XYChart.Data<String, Number>(france, 45263.37));
        series2.getData().add(new XYChart.Data<String, Number>(italy, 117320.16));
        series2.getData().add(new XYChart.Data<String, Number>(usa, 14845.27));
        series3.setName("2005");
        series3.getData().add(new XYChart.Data<String, Number>(austria, 45000.65));
        series3.getData().add(new XYChart.Data<String, Number>(brazil, 44835.76));
        series3.getData().add(new XYChart.Data<String, Number>(france, 18722.18));
        series3.getData().add(new XYChart.Data<String, Number>(italy, 17557.31));
        series3.getData().add(new XYChart.Data<String, Number>(usa, 92633.68));
        Scene scene = new Scene(sbc, 800, 600);
        sbc.getData().addAll(series1, series2, series3);
        stage.setScene(scene);
        stage.show();
    }

    public static void main(String[] args) {
        launch(args);
    }
}
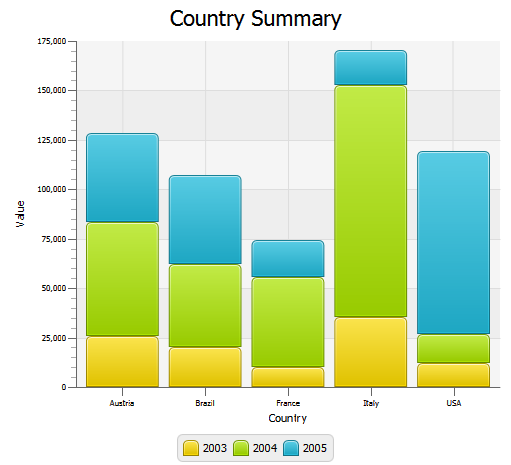
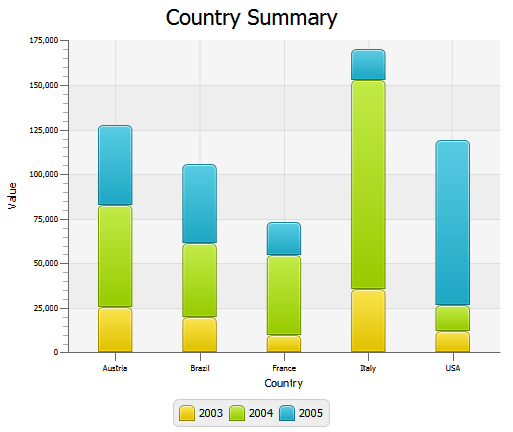
When you define axes for a stacked bar chart in your application, you must explicitly assign the categories of data to a particular axis. In Example 7-4, the categories are assigned to the horizontal axis by using the setCategories method. The bar chart produced by this application is shown in Figure 7-4.
Figure 7-4 Stacked Bar Chart with Five Categories of Data
Description of "Figure 7-4 Stacked Bar Chart with Five Categories of Data"
Compare the data shown in Figure 7-3 with the same data in Figure 7-4. The areas in the stacked bar chart show cumulative values on the vertical axis at any given point along the horizontal axis. For example, on the vertical axis of Figure 7-4, the 2004 values for Austria range from approximately 25,000 to approximately 85,000. However, the data in Example 7-4 indicates a value of 57,401.85 for Austria in 2004. The 2004 high value of approximately 85,000 in Figure 7-4 represents the cumulative results for Austria in 2003 and 2004.
When you develop bar charts in your JavaFX application, remember that data on the vertical axes are interpreted differently for a BarChart than for a StackedBarChart. Choose the type of chart that best illustrates the task of the application.
You can specify the distance between the stacked categories by setting the value in the setCategoryGap method. For example, you can set the distance of 50 pixels for the Country Summary bar chart: sbc.setCategoryGap(50);
When you apply this method to the stacked bar chart in Example 7-4, the bar categories look as shown in Figure 7-5.
Figure 7-5 Stacked Bar Chart with the Specified Gap Between the Categories
Description of "Figure 7-5 Stacked Bar Chart with the Specified Gap Between the Categories"
Animating Data in Charts
You can implement animated charts to illustrate dynamic behavior of financial activities. Example 7-5 defines an animation timeline and creates key frames to randomly set the X value for the data of the bar chart. The timeline starts when the application does and continues indefinitely in the auto-reverse mode.
Example 7-5 Animating Data in a Bar Chart
Timeline tl = new Timeline();
tl.getKeyFrames().add(
new KeyFrame(Duration.millis(500),
    new EventHandler<ActionEvent>() {
        @Override public void handle(ActionEvent actionEvent) {
            for (XYChart.Series<Number, String> series : bc.getData()) {
                for (XYChart.Data<Number, String> data : series.getData()) {
                    data.setXValue(Math.random() * 1000);
                }
            }
        }
     }
));
tl.setCycleCount(Animation.INDEFINITE);
tl.setAutoReverse(true);
tl.play();
When you add this code fragment to the Country Summary application in Example 7-3, and then compile and run the modified code, you will notice that both the axis and the chart plot change smoothly to accommodate new values in ranges and new lengths of the bars. This is because of the animated properties of the Chart and Axis classes. By default, they set to true to animate any data changes.
For the Country Summary application, you can prohibit animating data along the vertical axis when the data on this axis is presented in categories and does not change. To avoid undesirable flickering of the country labels, use the setAnimated method as shown in Example 7-6.
See the Ensemble application and the API documentation for more information about the features and capabilities of JavaFX charts.
Related API Documentation
-
BarChart -
Chart -
XYChart -
XYChart.Data -
XYChart.Series -
Axis -
NumberAxis -
CategoryAxis -
Timeline -
KeyFrame
 Alla is a technical writer for Oracle. She lives in St. Petersburg, Russia, and develops tutorials and technical articles for Java and JavaFX technologies. Prior to her assignment at Oracle, she worked as a technical writer in different IT companies.

