| Exit Print View | |
Java Platform Micro Edition Software Development Kit Version 3.0, Mac OS |

|
|
|


|
Viewing and Editing Project Properties
Running Projects in the Emulator
Searching the WURFL Device Database
Finding Files in the Multiple User Environment
Saving Customized Snapshots and Images
CLDC Emulation on a Windows Mobile Device
Installing CLDC Emulation on a Windows Mobile Emulator (Windows Only)
JSR 82: Bluetooth and OBEX Support
JSR 135: Mobile Media API Support
JSR 177: Smart Card Security (SATSA)
JSR 205: Wireless Messaging API (WMA) Support
JSR 211: Content Handler API (CHAPI)
JSR 226: Scalable 2D Vector Graphics
JSR 238: Mobile Internationalization API (MIA)
JSR 256: Mobile Sensor API Support
When the data.prof file is saved it is displayed immediately (Saving Profiler Data). The data can also be manually loaded at a later time.
Follow these steps to retrieve profile data:
In the main window menu, select Tools >Import Java ME SDK Snapshot...
Choose the data.prof file. For the default location, see File Locations.
In the main window, the Profiler opens in its own tab labeled CPU:time.
Note - The profiling values obtained from the emulator do not reflect actual values on a real device.
Profiler Tab (Windows)
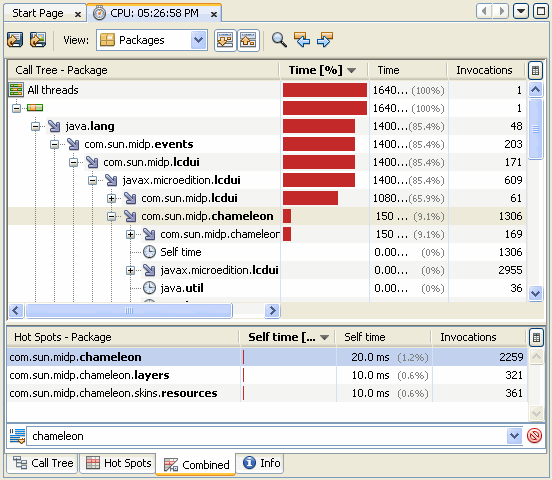
Profiler Tab (Mac OS)
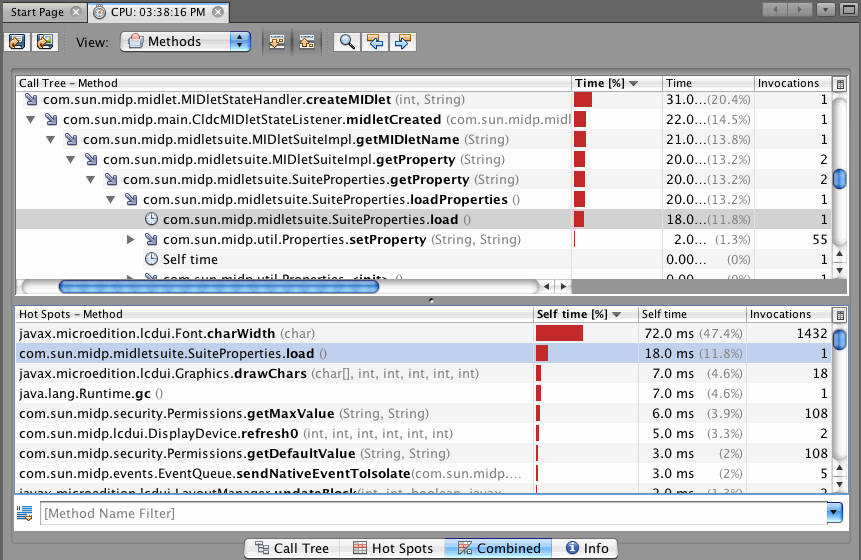
You can change the granularity of the results. In the toolbar at the top of the tab, make a selection from the View menu.
Method Level View (default). Results are displayed according to the fully-qualified method names.
Class Level View. Results for all methods of the same class are aggregated in a single entry.
Package Level View. All methods of classes that belong to the same package are aggregated.
Click any column label to sort based on its values. To remove a column from the display, click the table icon above the scroll bar and uncheck the column name.
The above screenshot shows a view that combines the Call Tree and Hot Spots. Click the tabs along the bottom to see different views:
Call Tree. This tab displays a call tree showing the method call chain and the time/number of invocations for executing threads and methods in each context. (A context is a unique chain of method calls leading to the method’s invocation.)
Hot Spots. This tab shows the total execution time and number of invocations for each method, irrespective of the context. It also includes the Method Name Filter Field, which filters based on the first column. To select the filtering parameters, click the filter icon and choose from the menu.
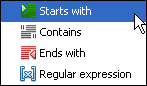
Enter a search string in the filter field. You can enter multiple values separated by spaces. To apply the filter, click the green check. To restore the unfiltered data, clear the filter field by clicking the red symbol.
Combined.This tab displays the Call Tree information in the upper part of the window and the Hot Spot data in the lower part.
Info. This tab displays the time the snapshot was taken, where it is saved, and the configuration of the profiling session.
You can right-click a profiling result to access additional utilities. The actions you see depend upon the currently selected view.
Show Subtree. Displays the subtree for the selected method.
Show Back Traces. Displays the back traces for the selected method.
Find in Hot Spots. Displays the selected class or method in the Hot Spots tab.
|
|