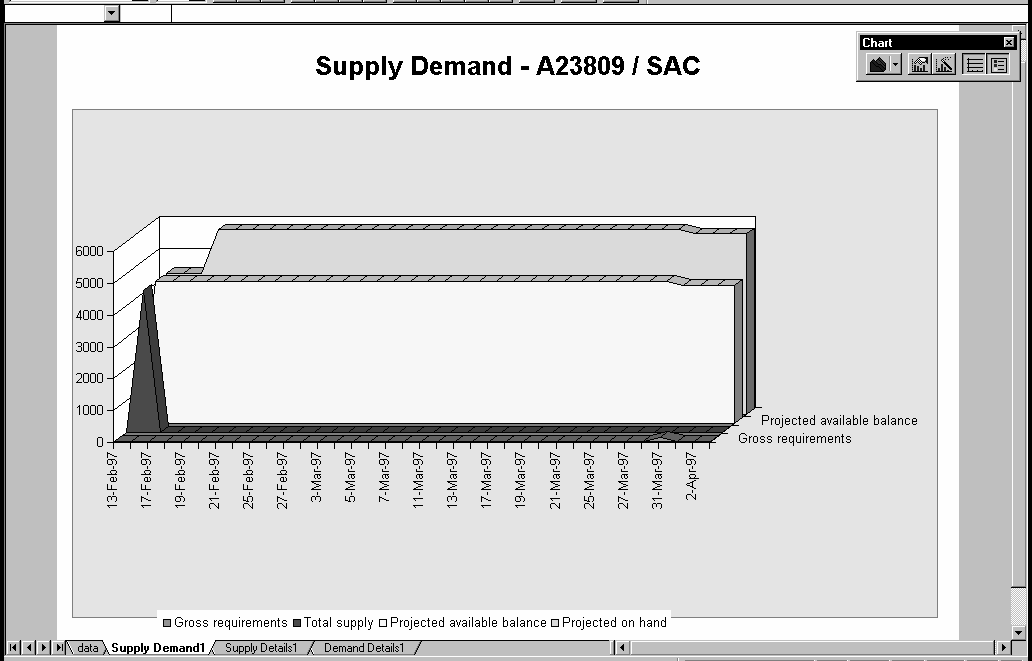
Generating a Graphical Display of Planning Data
You can view a graph of the current or snapshot supply/demand information of one or more items. The graph contains all horizontal plan data for the selected item, rendered in three charts:
- total supply and demand detail
 To generate a graphical display of planning data:
3. Choose Horizontal Plan.
4. Choose the Current option button to view current supply/demand information; choose the Snapshot option button to view supply/demand information from the latest planning run.
See Also
Reviewing Planning Exceptions
Reviewing Supply and Demand
Reviewing the Horizontal Plan
Displaying the Enterprise View
Reviewing Assembly Components