| Previous | Next | Contents | Index | Navigation | Glossary | Library |
Process result for all critical dimensions are collected on the shop floor. For example, one critical dimension is the width of a rear flange that is formed on a press brake. The press brake operator measures the flange width immediately after forming the part. Measurements are randomly taken for four parts produced over the life of the job; for example, the first and last parts produced on the job as well as two from the middle might be measured. The deviation between the specified and actual flange width is calculated by subtracting the actual width from the nominal specification width stated by the specification. Although specifications can vary for each customer, the deviation specification for flange width is 2.0 +/- 0.04 units for all customers.
The immediate goal of your quality improvement program is to maintain a process capability index of at least 1.2. By agreement, process capability is to be estimated only after 40 measurements are recorded. The two Process Capability indices used most often in evaluating the relationship between the process and the customer are Cp and Cpk. They are described mathematically as follows:
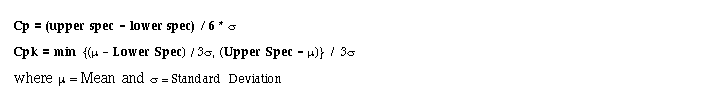
Cp measures how dispersed the data is without regard to whether the data is evenly distributed around the midpoint between the Upper and Lower Specification Limits (usually referred to as the nominal value).
Cpk weights the dispersion of data about the nominal which usually lies as a midpoint between the Upper and Lower Specification Limits. The denominator in the Cpk index indicates how much room is needed on either side of the mean to contain most of the distribution. The numerator measures the amount of room from the mean to the specification on the side where there is less room. For both Cp and Cpk, higher values are better and indicate higher process capability.
Cp depends only on the value of the standard deviation and is not affected by the relative position of the mean with respect to the nominal specification. On the other hand Cpk considers the value of the standard deviation and the mean. However, before estimating process capability the issue of statistical control should be addressed. Without statistical control, process capability estimations may prove erroneous due to the inherent instability of the process. Therefore, statistical control should be established before calculating process capability indices.
When a process is in statistical control -- is operating with the minimum amount of variation possible (the variation due to common causes) -- it can be expressed mathematically as follows:

Using the above expression it is possible to calculate process capability using the Rbar value from a Xbar and R chart. Establishing statistical control for flange width became a priority action item. A quality team was set up in the sheet metal job shop. They established three objectives which are:
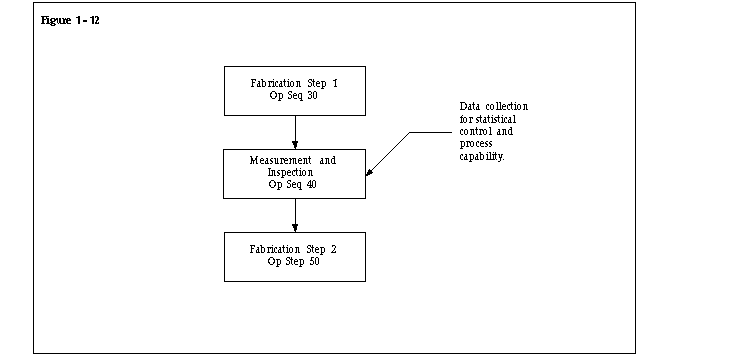
Figure 1 - 12 illustrates the process flow for the fabricated parts.
When the default specification value is use, the correct specification for a given customer name is automatically defaulted. The next step is to calculate the deviation of the flange reading from the specification. We use user-defined formula to calculate the deviation. The steps are as follows:
The quality team is interested in examining the control chart after 40 readings have been recorded in the collection plan.
The collection plan is now ready for collecting data. Every job containing Rear Flange triggers a collection plan where the inspector after selecting the customer specification enters readings on flange width. The team uses the View Quality Results window to see whether at least 40 records have been entered in for the Rear Flange collection plan. After two days, they realize that the requisite number of readings is available for analysis.
The team devises a plan for control chart implementation. They realize that certain considerations are paramount in initiation of a control chart including rational sub-grouping, type of chart, frequency and the type of study being conducted. Their initial conclusion is that the chart should be an Xbar and R chart.

as discussed previously. Even with an R chart in control, the manufacturing process for flange width is not constructed to meet the desired specifications.
As shown below, the pattern suggests that the process average crept upward then was probably adjusted downward. This adjustment cycle, which was repeated for a total of four cycles, is an observation worth investigating.
The inherent process capability was estimated as follows:

and 6 times the standard deviation, which is 0.162, and the specification width is 0.08 which means that the inherent variability is twice what is specified.
Two major types of investigations are needed to reduce the process variability to the stated specifications:

Defining Collection Plan Elements
Associating Transactions with Collection Plans
Defining Actions that Assign a Value: User-Defined Formulas
Associating Specification Types with Collection Plans
Creating and Viewing Control Charts
| Previous | Next | Contents | Index | Navigation | Glossary | Library |