Release 2.0
A67837-01
Library |
Product |
Contents |
Index |
| Oracle(R) Enterprise Manager Oracle(R) Trace User's Guide Release 2.0 A67837-01 |
|
This chapter describes how to work with Oracle Trace collections. In particular, the following topics are covered:
You create Oracle Trace collections using the Oracle Trace Collection Wizard. The Collection Wizard helps you define and schedule an Oracle Trace collection. To access the wizard, do one of the following:
The Collection Wizard prompts you only for the information it needs. This means that creating a collection is context-sensitive. If the node selection has already been established, you will skip to step 3.
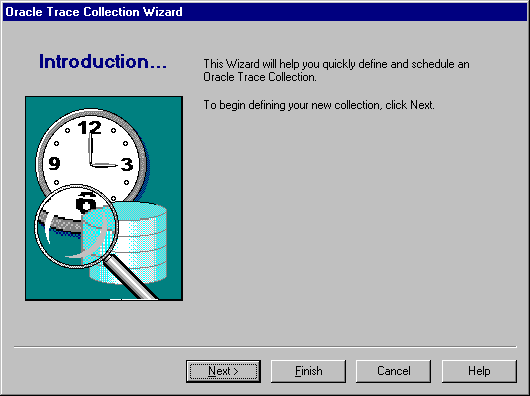
If you are at the top of the tree list (the word Collection is highlighted) and you click the Create Collection toolbar button, the Introduction page of the Oracle Trace Collection Wizard displays, as shown in Figure 3-1.
The information that you enter in the Collection Wizard pages defines the collection parameters. Each step in the wizard gathers information based on the input from the previous step. The Collection Wizard prompts you for information in the following order:
Click the Next button to start the definition of the collection.
In step 1, you select the server node (see Figure 3-2). If the server node can be determined by the context in which the Create Collection was activated, the Collection Wizard skips this page.

These are the server nodes that contain valid Oracle installations for running Oracle Trace collections. Select from this list to identify the node where the collection is to be run.
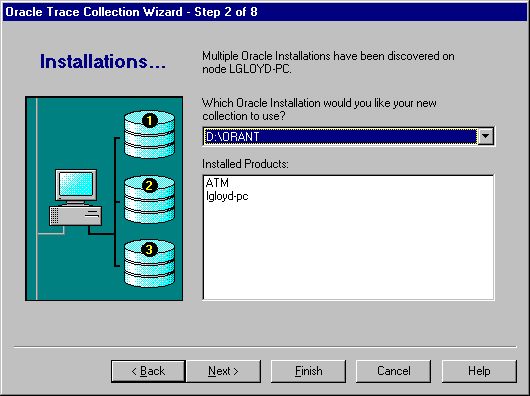
In step 2, you choose which Oracle installation you would like the collection to use (see Figure 3-3).
You see this page only if Oracle Trace has been installed in more than one $ORACLE_HOME on the node. Otherwise, you will not be prompted with this page. The discovery mechanism locates all $ORACLE_HOME installations on a node. Each $ORACLE_HOME installation represents a different version of the Oracle products.
Also, an Oracle installation contains a compatible set of instrumented products. Oracle Trace collections can run on multiple products; however, the products must all belong to one Oracle installation.
This list shows all available Oracle installations for the selected node.
This is a read-only list showing the products available for the currently selected installation. Only instrumented installed products are listed.
In step 3, you select the event sets that you want to use (see Figure 3-4). An event set is a grouping of events.

This is a list of available products and databases that are instrumented for the selected node and Oracle installation. Event sets can be chosen from one or more products and databases to define the collection. Only one event set can be chosen per product or database.
This is a list of event sets for the particular product or database. You may select one event set per product or database, or no event sets if the product or database is not to be part of the collection. Select the event set value you want to use. For Oracle Server, Oracle provides the following event sets: ALL, DEFAULT, EXPERT (Oracle Expert application), CACHEIO (buffer cache I/O), and SUMMARY (Summary Advisor application).
The Event Set Description describes the event set selected. [Old format] means that no description is supplied in the product definition file (.fdf).
By default, Oracle Trace collects data for all users attached to a database. In step 4, you can restrict the amount of data collected by selecting certain users for data collection (see Figure 3-5).
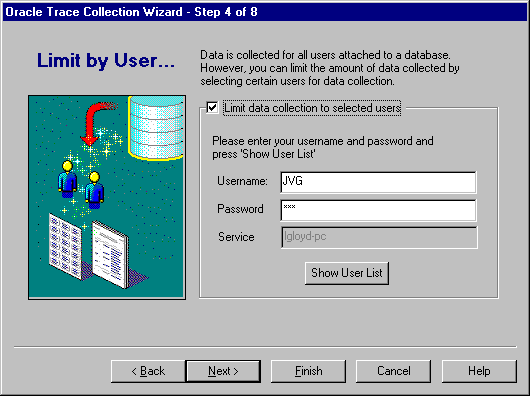
Check this box if you want to limit the collection to certain users. Otherwise, all users will participate in the collection.
Supply this information to access the list of users on the target Oracle Server. This action allows Oracle Trace Manager to connect to the server to obtain the user names. This account must have the privileges required to select from the SYS.ALL_USERS table and the V$EVENT_NAME view.
This field is grayed out. The service was established on the Event Sets page. If you need to change the service name, go back to the Event Sets page and select another service.
Click this button to display a list of users, as shown in Figure 3-6.
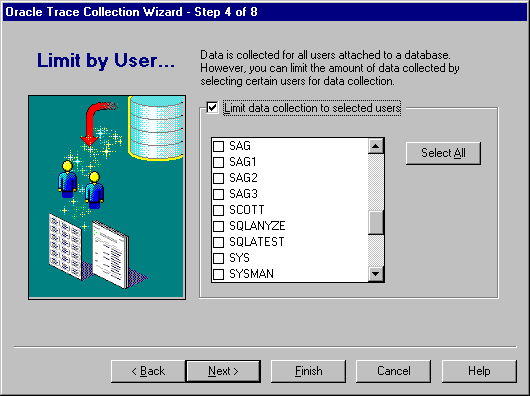
Select the users that you want to participate in the data collection. Select a user by clicking in the square to the left of the user name. Selected users will have a checkmark in the square. Click the Select All button if you want all users to participate in the collection. This is the equivalent of not limiting the data collected. Once you click the Select All button, you can deselect all the choices by clicking the Deselect All button.
By default, Oracle Trace collects data for all wait events. In step 5, you can restrict the amount of data collected by selecting certain wait events for data collection (see Figure 3-7).
This step is only available if all the following conditions are true:
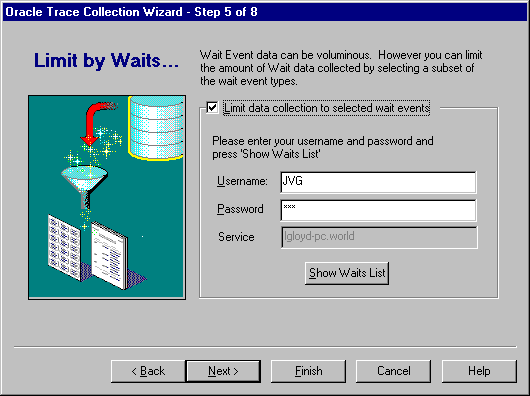
Check this box if you want to limit the collection to certain wait events. Otherwise, all wait events will be collected.
Supply this information to access the list of wait events on the server. This action allows you to connect to the server. This account must have the privileges required to select from the V$EVENT_NAME view.
This field is grayed out. The service was established on the Event Sets page. If you need to change the service name, go back to the Event Sets page and select another service.
Click this button to display a list of wait events, as shown in Figure 3-8.
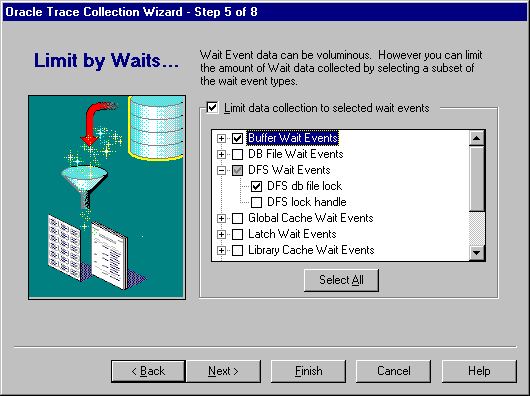
Select the wait events that you want to participate in the data collection. Wait events are grouped by wait event types. Expand the tree to view individual wait events. You can click on particular wait events or wait event types. Select a wait event by clicking in the square to the left of the wait event. Selected wait events will have a checkmark in the square. Click the Select All button if you want all wait events to participate in the collection. This is the equivalent of not limiting the data collected. Once you click the Select All button, you can deselect all the choices by clicking the Deselect All button.
In step 6, Oracle Trace provides a default name of the collection definition file in which to store the results of the collection (see Figure 3-9). You can either accept the default or change the name.
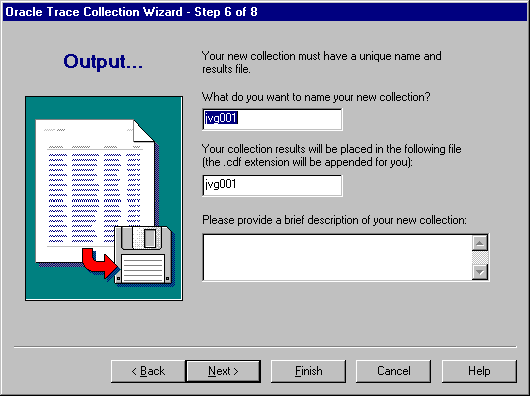
If you do not accept the default name, specify a name of up to 16 characters for the collection. Special symbols are not allowed. Both the collection name and the collection definition file name must be unique on the node where you are collecting the data.
By default, the collection file has the same name as the collection with .cdf (collection definition file) appended. The complete file specification is $ORACLE_HOME/otrace/admin/cdf/name.cdf where name is what was in the Collection Name field; however, this name may be different on systems other than UNIX. The name can be up to 8 characters in length.
You also have the option of providing a description of this new collection.
At this point, you can click the Finish button. If you do, Oracle Trace accepts all of the defaults for scheduling and formatting information. These will be displayed on the Summary page (see Figure 3-14).
In step 7, you have the opportunity both to define the maximum length (in megabytes) of the collection definition file (.cdf) and to provide scheduling information (see Figure 3-10).
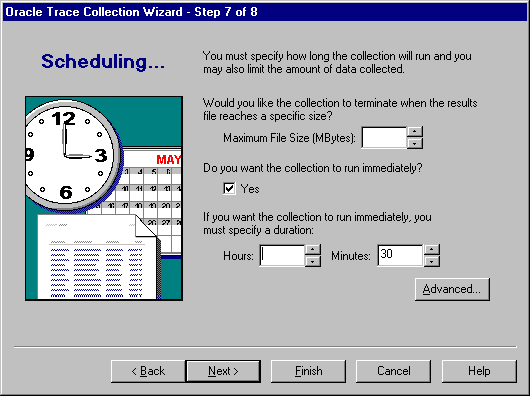
If you specify a maximum file size, the collection will terminate once the file size is reached, even if other scheduling criteria have not been met. Oracle Corporation recommends that you set this parameter if you have a disk space limitation. Use a value from 1 through 2000 inclusive. The default is no maximum file size.
Checking this box signifies that you want the collection to run immediately. This is the default. Use the Advanced Scheduling Options page to schedule the collection if the collection is not to run immediately.
Use a whole number to define this parameter.
Use a whole number to define this parameter. The default is 30 minutes.
Click the Advanced... button to display the advanced scheduling options, as described in the next section. If you do not choose to run the collection immediately, you need to supply the advanced scheduling options.
The Advanced Scheduling Options page allows you to schedule the execution of the collection (see Figure 3-11).
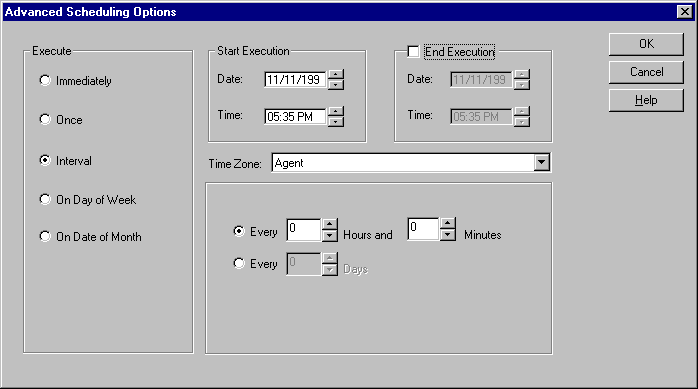
Select the frequency with which you want the collection executed. The lower right pane changes format depending on the choice in the Execute field. The choices are:
Schedules the collection as soon as you click the Submit button on the Summary page. The collection executes only one time.
Schedules the collection only one time at the date and time you choose.
Allows you to schedule a specific time interval between collection executions. The interval can be a combination of hours and minutes, or number of days. Click on the scroll buttons to change the values or type in new values.
Allows you to schedule the collection on one or more days (Sunday, Monday, etc.) of the week. Click on the days of the week in the Date field to select the days on which you want the collection to occur.
Allows you to schedule the collection on one or multiple days (1-31) of the month. Click on the dates of the month in the Date field to select the dates on which you want the collection to occur.
Choose the first date and time that you want the collection executed. This is the starting time for any collection scheduled on an interval.
Select the month, day, or year in the Date field and click on the scroll buttons to change the value. You can also type in new values.
Select the hour, minute, or AM/PM in the Time field and click on the scroll buttons to change the value. You can also type in new values.
Choose the last date and time that you want the collection executed. This option does not apply if you chose the Immediately or Once execution options.
Select the month, day, or year in the Date field and click on the scroll buttons to change the value. You can also type in new values.
Select the hour, minute, or AM/PM in the Time field and click on the scroll buttons to change the value. You can also type in new values.
Select the time zone from the pull-down list. The choices are:
The agent schedules the collection execution based on the system time of the destination node.
The agent schedules the collection execution simultaneously on all destinations based on the system time of the console.
The agent schedules the collection execution simultaneously on all destinations based on Greenwich mean time (GMT).
In step 8, you have the option of automatically formatting your collection data to an Oracle database when the collection ends (see Figure 3-12).
For Oracle Server releases prior to 7.3.4 and 8.0.4, Oracle Trace tables must be created before formatting; for details, see "Formatting Collections".
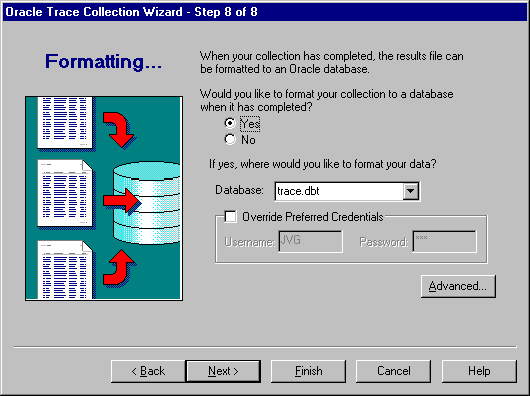
Choose Yes if you want to format your collection to a database when the collection is completed. This is the default.
Choose No if you do not want to format your collection to a database when the collection is completed.
If you chose Yes, provide the name of the database where you want your formatted data to reside.
Preferred credentials identify the user name and password used to connect to the database and to load data into the Oracle Trace formatter tables. You can override the Oracle Enterprise Manager console or Oracle Trace preferred credentials by selecting the Override Preferred Credentials option. Select a database and enter the criteria for the database user name that is the target for the formatter tables.
Oracle Trace determines the preferred credentials in the following order. The search continues until one of the criteria is met.
Click the Advanced button to display the advanced formatting options, as described in the next section.
In the Advanced Formatting Options dialog box, you have the opportunity to have Oracle Trace either format the entire collection results file or format only unformatted data. See Figure 3-13.
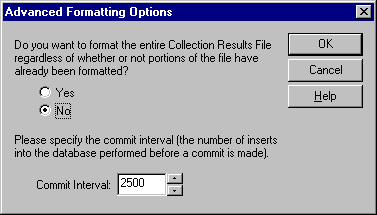
Choose this option if you want to format the entire collection results file.
If you have already formatted part of the data and then you format the entire results, some event data will be formatted twice. The partial format and the full format will have different collection IDs. Make sure you query only the full format for consistent results. If you do not ask for the entire file, you get only the records that were not already formatted.
Choose this option if you want to format only unformatted data. This is the default. By specifying this option, you can examine data as it is collected. You do not have to wait for the entire collection to finish before you can look at the data. Use this option if the collection is scheduled to execute more than once.
You can define the commit interval into the database. The shorter the interval, the longer it takes the collection to format. Also, the larger the commit interval, the larger the rollback segment needs to be for the commit operation to succeed. The default is 2500 inserts before a commit is made.
The Oracle Trace Collection Wizard Summary page summarizes all of the information that you entered while using the Oracle Trace Collection Wizard (see Figure 3-14).

The summarized properties are:
If, while reviewing the Summary page, you find options that you want to change, click the Back button to make the necessary changes.
Once you are satisfied with the information, click the Submit button to start the collection process.
Once you have created a collection, you can view the collection properties, but you cannot edit the collection. However, if you need to create a similar collection, use the Collection=>Create Like... option or click the Create Like... button. Change the collection options needing to be updated, and start the new collection.
To view the collection properties, click the name of the collection in the tree. Oracle Trace displays the property pages of the collection: General, Limit Data, Output, Schedule, and Progress (see Figure 3-15).
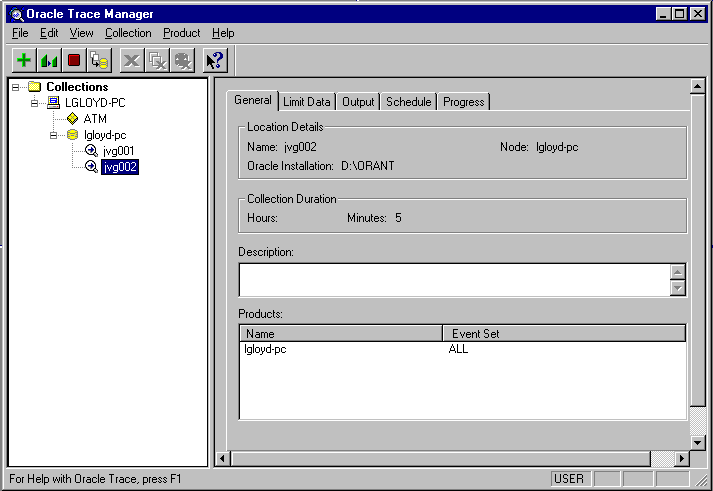
The General page provides a minimal amount of information about collections. The information includes the location of the collection file, the duration of the collection, a description of the collection file, and the product and event set pairs that make up the collection. The fields on the General page are:
Length of time that the collection will run (or ran)
Collection description that you provided
These fields describe data that was collected:
The Limit Data page lists the items and events used as restrictions for data collection. If no restrictions were chosen, the text "No limits specified" displays.
The Output page displays the name of the .cdf file and the format history. The fields on the Output page are:
A record is created every time data is formatted. Displays the database destination of the formatted data.
The Schedule page shows the type of execution for the collection, and in some cases, the start date/time of the collection, the end date/time of the collection, the time zone used for the collection, and the duration of the collection. These were defined if you chose the advanced scheduling options when you created the collection. Refer to "Advanced Scheduling Options" for a detailed explanation of all these options.
The Progress page displays the status of the collection as it was running, including the notification time. The fields on the Progress Collection Status page are:
This option allows you to use existing collections as templates for new collections. This makes it easier for you to schedule collections by using a previous collection and changing only a few items, rather than specifying everything, every time.
In the collection tree list of the Oracle Trace main window, click the collection on which you want to base your new collection. Choose the Collection=>Create Like... option. This starts the Collection Wizard. Make the changes you need, following the steps previously outlined in this chapter.
Stopping a collection terminates the data collection. To stop a collection:
Stopped collections have a status of "Stopped" in the Oracle Trace Manager main window.
Oracle Trace collects the event data in a binary file for efficiency. This binary file can be automatically formatted to an Oracle database for SQL access and reporting. You can format that data by using Oracle Trace Manager.
After formatting the collected data, you can perform queries against your Oracle Trace data using Data Viewer, or use it with a reporting tool such as Oracle Reports. You can also import Orace Trace formatted data into Oracle Expert to be used as SQL workload.
Before you format data to an Oracle database, formatter tables must be created in that database. Create formatter tables using the vobsh command, as described in the Oracle Enterprise Manager Configuration Guide.
It is possible to maintain multiple sets of formatted data by creating formatter tables under more than one Oracle schema.
You can also format multiple collections into the same schema. You can format Oracle Trace data using either Oracle Trace Manager or the command-line interface. "Formatting Oracle Trace Data to Oracle Tables" provides information about using the command-line interface to format tables. The Oracle Enterprise Manager Oracle Trace Developer's Guide gives a complete description of the formatting steps using the command-line interface.
To format a collection using Oracle Trace Manager, select a collection name from the Oracle Trace Collection Summary window. Choose Collection=>Format from the Oracle Trace Manager main window. The Format Collection dialog box appears. Enter information as follows:
Enter a connect string or service name for the database. If you enter nothing, Oracle Trace will use the default database.
You can override preferred credentials. These credentials identify the schema where the data will be loaded.
Oracle Trace determines the preferred credentials in the following order. The search continues until one of the criteria is met.
Enter the Oracle username under which the Oracle Trace formatter tables were created.
Enter the password for the Username.
Decide the commit interval that you want and whether you want a partial format of the data; that is, to process data that has not previously been formatted.
Enter a number. The Commit Interval is the number of inserts made into the database before a commit is performed. A value is required in this field. The default is 2500.
Choose this option only if you want to process data that has not previously been formatted. This is useful when you want to format data for a collection while that collection is still in progress.
Click OK. When the collection is formatted, the status is listed in the Format column in the Collection Summary window.
To delete a collection entry from the Oracle Trace Manager main window, select the entry and choose Collection=>Delete. When you take this action, the Delete Collection dialog box appears.
The default is to delete everything, all collection files and all formatted data. However, by clicking the Advanced button, you can choose which formatted data you want to delete.
If you do not delete the collection files and the formatted data, Oracle Trace Manager deletes only its record of the collection. You will not see the General, Limit Data, Output, Schedule, and Progress pages for this collection. This also leaves the collection files and formatted data for you to delete manually at a later time.
For information about deleting formatted data for a collection, see the Oracle Enterprise Manager Oracle Trace Developer's Guide.
Because formatted data takes up a lot of space in the database, you may want to regularly delete formatted data. Deletion of formatted data is performed using the Oracle Trace Manager as follows:
The Delete Formatted Data function deletes rows of data for a specific collection from the formatted database tables. Although it deletes the contents of event tables, it leaves the event tables themselves intact. This is because re-creating them would be time-consuming for the formatter.
To delete the files associated with a collection, first select a collection name in the Oracle Trace Manager main window. Then choose Collection=>Delete Collection Files.
This deletes the collection definition file (.cdf) and the data collection (.dat) file. It does not delete the collection entry from the Oracle Trace Manager main window; Deleted Files displays in the Status column. You cannot use Oracle Trace Manager to delete formatted data once the collection files have been deleted. You need to manually delete the formatted data from the database using Oracle Server Manager or Oracle SQL*Plus Worksheet.
delete from epc_collection
       where collection_id=<id>;
Deleting the collection's record from epc_collection will also delete other related data records in other format tables.
Another way to examine the collection data, rather than formatting it, is to use the Oracle Trace report utility. The report utility reads the event data directly from the data collection (.dat) file and creates a text listing of the events. This approach is not recommended for large collections. For large collections you should format the data.
Refer to the Oracle Enterprise Manager Oracle Trace Developer's Guide for detailed information about using the report utility.