5
Building a Report with Sections
The report described in this chapter is designed to help you learn more about Report Builder features for report sections and distribution.
To build this report, you will use the Data Wizard to create a multi-query data model, then use the Report Wizard to create the default layout for the first section. You will make fairly extensive manual refinements in the Data Model and Layout Model views. Then, you will again use the Report Wizard to create a default layout for the second section, based on the same data model, and make minor manual refinements in the Layout Model view and Live Previewer.
In this example, you will create a detailed report in the main section showing investment fund elections, and an account summary for employees vested at a specified percentage (one landscape page per employee). Then you will create one-page summary report in the header section of all employees vested at a specified percentage. Finally, you will set up distribution parameters to output each section of the report to multiple formats and destinations.
About sections
Report sectioning enables you to define multiple layouts in the same report, with each layout having a different target audience, output format, page layout, page size, and orientation. You can define up to three report sections (i.e., the Main, Header, or Trailer section). In the other sections, you can define different layouts rather than creating multiple separate reports. For example, a single report can include an executive summary for senior management in one section and can also include a detailed breakdown for individual managers in another section.
The following figure provides a conceptual overview for building a report with multiple sections, and then distributing the report based on the distribution parameters defined for each section. Table 5-1, "Features demonstrated in this Sections sample report" describes the steps you will take to create this report.
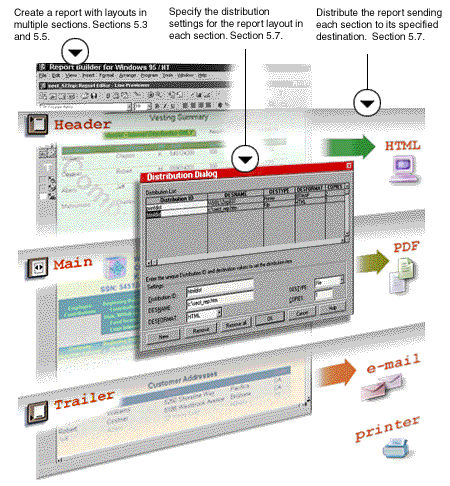
The sect.rdf file contains the report you will create after finishing the tasks in this chapter. You may want to refer to this file while you are working. This file is located in your ORACLE_HOME\TOOLS\DOC60\US\RBBR60 directory.
Table 5-1 Features demonstrated in this Sections sample report
To get started, open Report Builder. If the Welcome dialog box appears, click Build a new report manually and click OK. If not, choose File->New->Report. Click Build a new report manually and click OK.
At some point before you generate the report, you will need to log into the database. Choose File->Connect to connect to the database. Enter the appropriate log on information. See Section 1.3, "Obtaining database access before you start" for details.
5.1 Creating a data model
The steps in this section will help you create a data model by building five different queries. Then, you will refine the data model manually in the Data Model view.
5.1.1 Building queries using the Data Wizard
When building a report with multiple queries, you typically use the Data Wizard to create each query and the Report Wizard to create the layout. The steps in this section will help you to create five different queries using the Data Wizard.
|
 |
- For online help on this task, choose Help->Report Builder Help Topics
- On the Index page, type...
query, creating
- Then click Display to view help topic...
Creating a local query: Data Wizard
|
- In the Data Model view, click
 to display the Data Wizard.
- If the Welcome page appears, click Next.
- Type Q_acct in Query Name and click Next.
- If the Type page appears, click SQL statement, and click Next. The Type page will only appear if you have configured Report Builder to run with Oracle Express.
- Type the following SELECT statement. This query selects personnel information for each employee, along with investment fund deferral and vested percentages:
SELECT 	a.lastname,
	a.firstname,
	a.mi,
	a.ssn,
	a.pct_deferral,
	a.pct_vested,
	d.street,
	d.city,
	d.state,
	d.zip
FROM 	accts a,
	acct_addrs d
WHERE a.pct_vested=:p_pct_vested
AND d.ssn=a.ssn
- Click Next. If you are connected to the database, you will receive a notification that Report Builder is creating a bind parameter for you. Click OK to dismiss it. Because the WHERE clause of this query refers to a bind parameter (p_pct_vested) that does not yet exist, Report Builder creates the parameter for you and notifies you that it has been created.
- On the Groups page, click Next. This query requires no break groups.
- On the Summary page, click Next. You will create some totals later on in this chapter.
- Click Finish.
- Repeating steps 1 through 9, create four more queries with the following characteristics:
- Query Name: Q_dist
Q_dist selects the percent distribution of investment fund elections for each employee.
SELECT 	c.fund_id,
	c.pct_dist,
	c.ssn,
	f.name
FROM	fund_contrib c,
	funds f
WHERE  c.fund_id=f.fund_id
ORDER BY f.name
- Query Name: Q_amount
Q_amount selects the amount invested in each fund, for each employee.
SELECT DISTINCT
	amount,
	empcomp,
	fund_id,
	ssn,
	trans_type,
	xact_id
FROM 	fund_xact
- Choose File->Save As. Save the report in the directory of your choice, and name the report
sect_511.rdf.
Tip: It is good practice when you are designing your report to save it frequently under a different file name. If you generate an error or if you don't like some of the changes you made, you easily can go back to the previously saved file and make revisions from that point.
5.1.2 Refining the Data Model
The steps in this section will give your groups more meaningful names, create a break group, turn your data model into a matrix data model, create data links, and create summaries.
- In the Data Model view, double-click G_lastname, the group owned by Q_acct, to display the Property Palette.
- Under the General Information node, set the Name property to G_acct.
- Press RETURN or ENTER to set the change.
- Repeating steps 1 through 3, rename the following groups:
Table 5-2 Group names
- Click and drag the G_xact group down a couple of inches to create some space above it.
- Click the column named empcomp in the G_xact group, and drag it outside and above the G_xact group.
|
 |
- For online help on this task, choose Help->Report Builder Help Topics
- On the Index page, type...
break group, creating
- Then click Display to view help topic...
Creating a break group
|
- Click the column named emconame in the G_xact group, and drag it into the new group, G_empcomp. Place emconame after the empcomp column.
- Double-click the G_empcomp group to display the Property Palette.
- Change the Name property to G_emco.
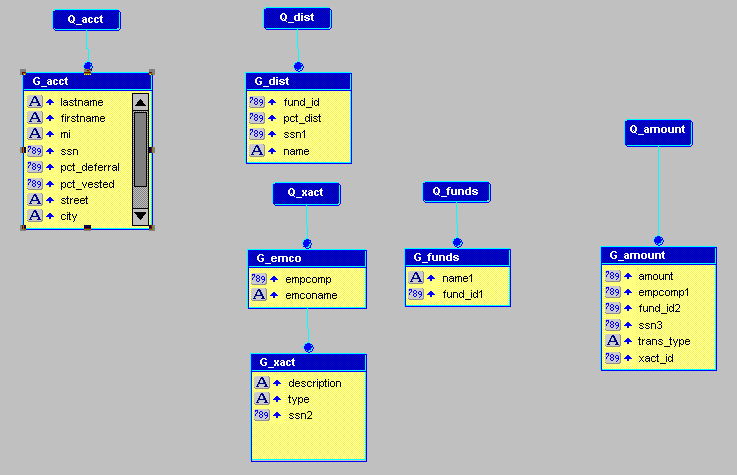
- Rearrange your data model to look similar to the following figure:
- Click
 in the tool palette.
|
 |
- For online help on this task, choose Help->Report Builder Help Topics
- On the Index page, type...
matrix group, creating
- Then click Display to view help topic...
Creating a matrix (crosstab) group
|
- Drag a rectangle around groups G_emco, G_xact, and G_funds.
- Double-click the newly created group, G_1, to display the Property Palette.
- Change the Name property to G_matrix.
- Click
 to create a column-to-column link.
|
 |
- For online help on this task, choose Help->Report Builder Help Topics
- On the Index page, type...
data link, creating
- Then click Display to view help topic...
Creating a data link
|
- Click column ssn in group G_acct and drag to column ssn1 in group G_dist. (This retrieves the percent distribution of investment fund elections.)
- Repeating steps 15 and 16, create data links between:
Table 5-3 Data links to create in the data model
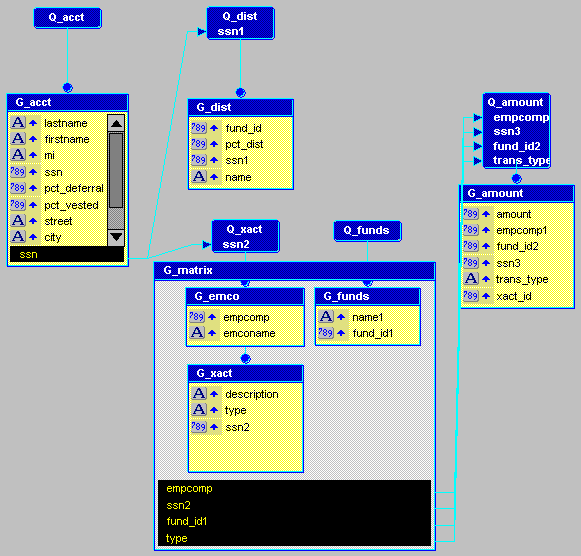
Your data model should now look similar to the following figure:
- Click
 .
.
|
 |
- For online help on this task, choose Help->Report Builder Help Topics
- On the Index page, type...
totals, creating for column
- Then click Display to view help topic...
Creating a summary column
|
- Click on the title bar of group G_matrix.
In the following steps, you will set this new summary column to calculate totals on each income description in each contribution category (row totals).
- Double-click the newly created column, CS_1 to display the Property Palette.
- In the Property Palette under the General Information node, set the Name property to CS_xactotal.
- Under the Column node, set the Width property to 38, the Product Order property to G_emco G_xact, and the Value if Null property to
0.00.
Tip: The values for the Product Order property can get quite long. To make these values easier to see, resize the Property Palette horizontally.
For more information on the meaning of these properties, click  while the property is selected.
- Under the Summary node, set the Source property to amount and the Reset At property to G_xact.
- Repeating steps 18 through 23, create summary columns in group G_matrix with the following characteristics
Table 5-4 Total properties
:
- CS_fundsubtotal calculates totals on each income fund in each contribution category (column totals).
- CS_emcototal calculates grand totals on each contribution category.
- CS_fundtotal calculates grand totals on each fund in all contribution categories.
- Repeating steps 18 through 23, create a summary column in group G_acct with the following characteristics:
Table 5-5 Total properties
- CS_grandtotal calculates grand totals on each fund in all contribution categories.
- You may want to rearrange the objects inside of group G_matrix to make the summary columns more easily visible.
- Save your report as
sect_512.rdf.
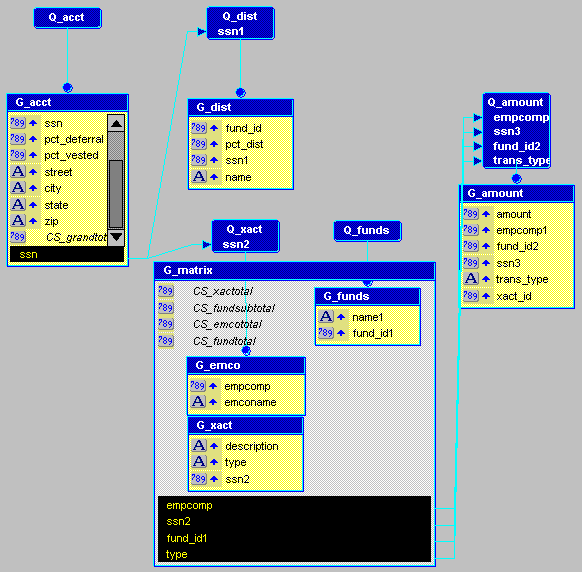
Your data model should now look similar to the following figure:
5.2 Designing a Runtime Parameter Form
The steps in this section will help you design a Runtime Parameter Form so that you can run your report regularly as you make refinements.
In Section 5.1.1, "Building queries using the Data Wizard", you created a query with the bind parameter p_pct_vested. Whenever you run a report with a bind parameter, the default Runtime Parameter Form appears. You must assign a value to the bind parameter in order to run your report.
You can use the default Parameter Form to enter a value, or you can build your own Parameter Form using the Parameter Form view.
|
 |
- For online help on this task, choose Help->Report Builder Help Topics
- On the Index page, type...
Parameter Form view, overview
- Then click Display to view help topic...
Parameter Form view
|
- Choose Tools->Parameter Form Builder.
- In the Parameter Form Builder, click the following parameters if they are not already selected:
- DESTYPE
- DESNAME
- DESFORMAT
- P_PCT_VESTED
- Click OK to create a parameter form in the Parameter Form view.
- Click once to select the P pct vested label, then click it again to enter edit mode. (Double-clicking will display the Property Palette.)
- Select the text, and replace it with
% Vested.
- Double-click PF_P_PCT_VESTED to display the Property Palette.
- Under the Parameter node, set the Initial Value property to 100.
- Click in the List of Values property field to display the Parameter List of Values dialog box.
- If it is not already selected, click Static Values.
- Type 0 in the Value field, then click Add.
- Repeat step 10 to add the following values:
- Click OK to close this dialog box.
- Close the Parameter Form view. You will have an opportunity to use the Run-time Parameter Form in a later step.
- Save the report as
sect_520.rdf.
5.3 Creating a layout for the first section
The steps in this section will help you to create a layout for a detailed section by using the Report Wizard to create a default layout. The Report Wizard by default builds a report layout in the main section of the report.
|
 |
- For online help on this task, choose Help->Report Builder Help Topics
- On the Index page, type...
default layout, creating
- Then click Display to view help topic...
Creating a default layout for a report
|
- Choose Tools->Report Wizard.
- On the Style page, click Matrix with Group.
- Click Next.
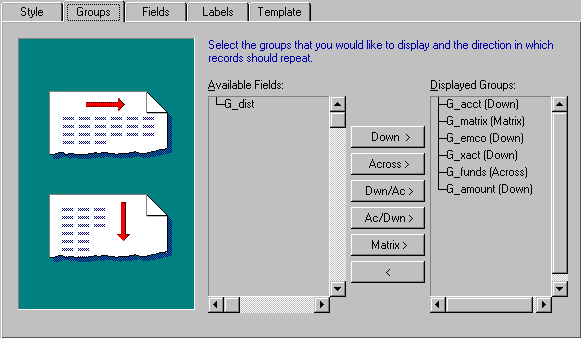
- On the Groups page, select the following groups from the Available Fields list box:
- click G_matrix, then click Matrix
- click G_emco, then click Down
- Click G_dist (Down) in the Displayed Group list box.
- Click
 . The Groups page should look like the one in the following figure:
- Click Next.
- On the Fields page, click lastname, then click
 . Repeat this step to add the following fields to the Displayed Fields list:
- firstname
- mi
- ssn
- pct_deferral
- pct_vested
- description
- emconame
- name1
- amount
- CS_xactotal
- CS_fundsubtotal
- CS_emcototal
- CS_fundtotal
- CS_grandtotal
- Click Next.
- On the Labels page, delete the labels for all of the columns listed, then rename the following columns:
Table 5-6 Labels
- Change the widths of the following columns:
Table 5-7 Widths
- Click Next.
- On the Template page, select the Predefined template Cyan Grid.
- Click Finish.
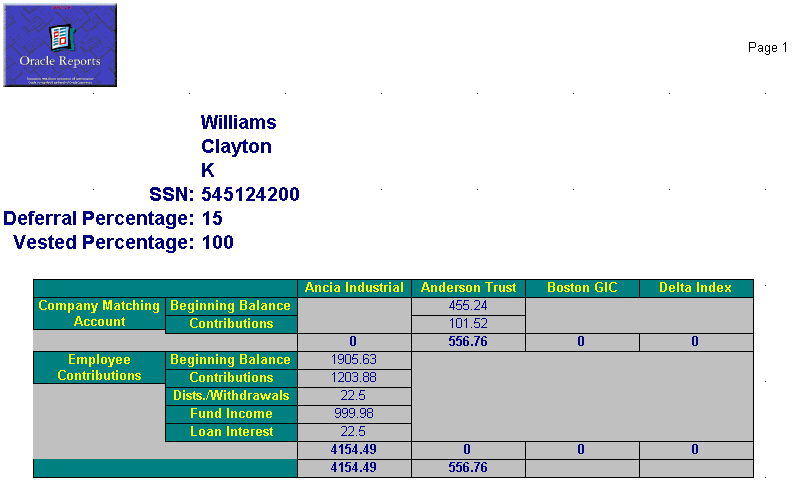
- In the Runtime Parameter Form, select 100 from the % Vested list box. Notice the Destination type, Destination name, and Destination format fields. You can choose another output type, such as printer, or change the format. For this exercise, however, you will use the default values.
- Click
 to review your report in the Live Previewer. Your report will look similar to the following figure:
- Close the Live Previewer.
- Save your report as
sect_530.rdf.
5.4 Refining the layout in the Layout Model view
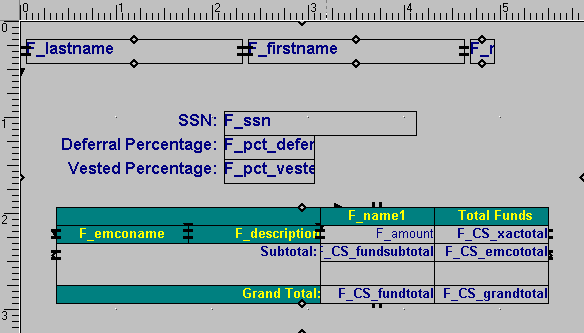
The steps in this section will help you to refine the layout of your report using the Layout Model view. You will make extensive changes to your layout by doing the following:
- change the attributes of objects, such as font size
- rearrange objects in your layout
- add boilerplate objects
- change the orientation of your report to landscape
When you finish this section, the layout will look similar to the following figure. Use this layout to help guide you through this exercise.
Tip: If you re-enter the Report Wizard after making manual refinements in the Live Previewer, you will lose some of your changes when you click Apply or Finish in the wizard, and your layout will default back to the state defined by the wizard.
5.4.1 Changing the properties of objects
- In the Object Navigator, double-click the Layout Model node to display the Layout Model view of your report.
- In the Layout Model view, double-click F_lastname to display the Property Palette.
- Under the General Layout node, change the Horizontal Elasticity property to Variable. Repeat this step for the following objects:
Tip: You can change several objects at one time: shift-click on all objects, then choose Tools->Property Palette.
- Click in an empty area of the canvas to deselect the objects.
- Shift-click the following objects:
- F_lastname
- F_firstname
- F_mi
- SSN:
- F_ssn
- Deferral Percentage:
- F_pct_deferral
- Vested Percentage:
- F_pct_vest
- In the toolbar, select 12 from the font size list box to change the font size of the selected objects.
- Click in an empty area of the canvas.
- Shift-click the following objects, then choose Tools->Property Palette:
- F_pct_deferral
- F_pct_vest
- In the Property Palette under the Field node, type
NNNN% (case sensitive) in the Format Mask to display the objects as a percentage.
- Click in an empty area of the canvas.
- Shift-click the following layout objects:
- F_amount
- F_CS_fundsubtotal
- F_CS_fundtotal
- F_CS_xactotal
- F_CS_emcototal
- F_CS_grandtotal
- Click
 .
.
- Click
 twice.
- Click
 .
.
- Click F_description, then click
 .
.
- Save the report as
sect_541.rdf.
- Click
 .
.
- At the Runtime Parameter Form, click
 to view the changes in the Live Previewer.
5.4.2 Re-arranging frames and objects
- In the Object Navigator, double-click
 to display the Layout Model view of your report.
Tip: Every object in the Layout Model view is also represented in the Object Navigator. Sometimes it is easier to refine the layout of a report by selecting objects from the Object Navigator. Arrange your workspace to display the Object Navigator and Layout Model view side-by-side. When you click an object in the Object Navigator, this object is selected in the Layout Model view.
- In the Object Navigator, expand the Layout Model, Main Section, Body, and M_G_ACCT_GRPFR nodes if they are not already expanded.
- Ctrl-click M_G_ACCT_GRPFR and R_G_ACCT.
- In the Layout Model view, using the vertical ruler as a guide, lengthen the M_G_ACCT_GRPFR and R_G_ACCT groups until the bottom of the frames reach 3 inches.
Tip: M_G_ACCT_GRPFR is the underlying master group. It is under R_G_ACCT. In the Layout Model view, it may look like only one group is selected when, in fact, both frames are selected.
- In the Object Navigator, type
M_G_MATRIX_GRPFR in the Find field to locate this object. Note that the search occurs as you type, so you will most likely be taken to the object before you finish typing the entire name.
The M_G_MATRIX_GRPFR frame in the Layout Model view looks similar to the following figure:

- In the Layout Model view using the vertical rule as a guide, lengthen the M_G_MATRIX_GRPFR frame until the bottom of the frame reaches 3 inches.
- In the Object Navigator, type
R_G_FUNDS in the Find field.
The R_G_FUNDS frame in the Layout Model view looks similar to the following figure:

- In the Layout Model view, lengthen the R_G_FUNDS frame until the bottom of the frame reaches its parent (enclosing) frame.
Tip: If you are unable resize the frame as expected, you may need to toggle Confine Mode off.
 indicates that Confine Mode is on.
  indicates that Confine Mode off.
- Shift-click F_CS_fundtotal and F_CS_grandtotal. Move these objects down until they reach their parent frame.
- In the Object Navigator under the Dimension Repeating Frame node, click R_G_EMCO.
The R_G_EMCO repeating frame in the Layout Model view looks similar to the following figure:

- In the Layout Model view, lengthen the R_G_EMCO repeating frame until it reaches the top of the F_CS_fundtotal and F_CS_grandtotal frames.
The result will look similar to the following figure:

- Arrange the following frames end-to-end to look like the figure that follows:
- F_lastname
- F_firstname
- F_mi

- Click
 and then again at the Runtime Parameter Form.
- Save your report as
sect_542.rdf.
5.4.3 Adding boilerplate objects
|
 |
- For online help on this task, choose Help->Report Builder Help Topics
- On the Index page, type...
boilerplate, about
- Then click Display to view help topic...
About boilerplate objects
|
- Display the Layout Model view of your report.
- Click
 to create a boilerplate object. Then click in the area directly below F_description.
- Type
Subtotal:
- Click
 .
.
- Change the following, if necessary:
- Font to Arial using the Font list box in the toolbar
- Point size to 10
- Font style to bold. Click
 .
.
- Click
 and change the color to dark blue.
- If necessary, arrange the boilerplate object so that it is placed next to F_CS_Fundsubtotal. The result will look similar to the following figure:

- Repeat steps 2 through 6 to create the following boilerplate objects with the specified characteristics:
Table 5-8 Boilerplate objects
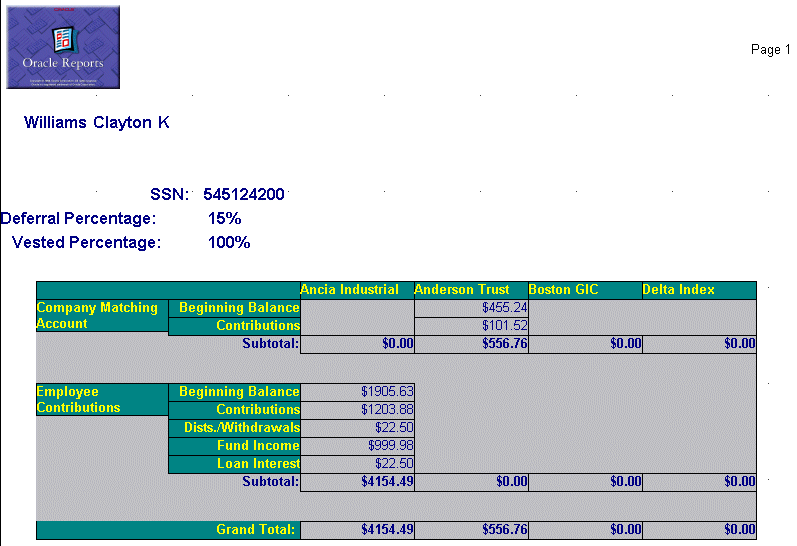
- Click
 and then again at the Runtime Parameter Form. Your report will look similar to the following figure.
- Scroll to the right of the report, then click
 .
.
Notice that report is not wide enough to display all the columns on a single page and wraps to the second page. Later, in Section 5.6, "Specifying landscape orientation and page break", you will change the orientation of this layout to landscape and insert a page break. This will allow the report to display one record per page. Before you change the orientation, however, you will create a layout for the second section using the Report Wizard.
- Save the report as
sect_543.rdf.
5.5 Creating a layout for the second section
The steps in this section will help you to create a layout for a summary in the header section of your report. You will use the Report Wizard to create a default layout. Then you will make manual refinements in the Layout Model view and Live Previewer.
5.5.1 Creating the default layout
- Display the Layout Model view of your report.
- Choose View->Layout Section->Header Section.
- Ensure that the Body of the report is displayed.
- Choose Tools->Report Wizard.
- On the Style page, type
Vesting Summary in the Title field, and click Tabular.
- Click Next.
- On the Groups page, click G_acct from the Available Fields list box, then click Down.
- Click Next.
- On the Fields page, click lastname, then click
 . Repeat this step for the following fields:
- firstname
- mi
- ssn
- pct_vested
- CS_grandtotal
- Click Next.
- On the Labels page, change labels and widths as follows:
Table 5-9 Labels and Widths
- Click Next.
- On the Template page, click the Predefined template Confidential Background.
- Click Finish.
- Click
 and then again at the Runtime Parameter Form.
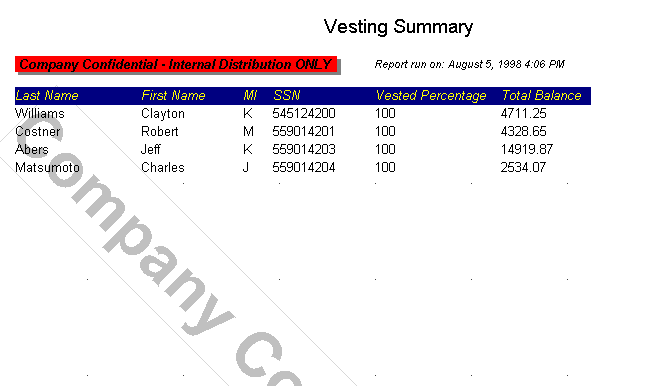
- If necessary click
 to display the Vesting Summary report. Your report will look similar to the following figure:
- Save your report as
sect_551.rdf.
5.5.2 Refining the layout in the Live Previewer
- In Live Previewer, shift-click the following objects, then click
 :
:
- Last Name
- First Name
- MI
- SSN
- Vested Percentage
- Total Balance
- Ensure that Flex Mode is on.
Tip:  indicates that Flex mode is on.
  indicates that Flex mode is off. Shift-click the data under the following headings:
- Last Name
- First Name
- MI
- SSN
- Vested Percentage
- Total Balance
- Click the lower-right corner of the selected objects and drag the lower edge of the frame down about 0.25 inches. Notice that the space between the rows increases. See the before and after figures that follow:
Report before increasing the row spacing:

Report after increasing the row spacing:

- Arrange your workspace so that the Object Navigator and Live Previewer are displayed side-by-side.
- In the Object Navigator, type
R_G_ACCT1 in the Find field.
- Click the title bar in the Live Previewer to make it active.
- Choose Format->Border and choose Top to toggle off the top border. A checkmark next to an option indicates that it is toggled on.
- Repeat step 7 for Left and Right. The bottom border will remain toggled on.
- Click
 , then choose red. This will place a red line between the rows of data. Your report will similar to the following figure:

- Save the report as
sect_552.rdf.
5.6 Specifying landscape orientation and page break
The steps in this section will help you change the orientation of the layout you created in the Main section.
Tip: If you create multiple layouts using the Report Wizard and plan on changing the orientation setting, it is good practice to change the orientation after building all of your layouts. If you change the orientation of first layout, then build a second layout using the Report Wizard, the orientation of the first layout will revert back to the orientation settings defined in the template.
- In the Object Navigator, if necessary, expand the Layout Model node, then click the Main Section node and choose Tools->Property Palette.
- In the Property Palette under the Section node, make the following changes:
Table 5-10 Property settings for the Section node
- Display the Layout Model view of your report.
- Click
 to display the Main section,
- In the Layout Model view, click
 in the toolbar to expose the Margin of your report.
Tip: Click  to switch between the Margin and Body of your report. Alternatively, choose View->Layout Section. A check mark next to Edit Margin indicates the Layout Model view is in Margin mode.
- Scroll down to the bottom of the layout, and click the border between the Body and the lower Margin.
- Using the vertical ruler as a guide, resize the area by dragging the border up to the 7.5 inch mark.
Tip: Be sure that you are re-sizing the Margin, not moving the Margin.
- Click
 to expose the Body of your report.
- In the Layout Model view, click the lastname field.
- Click
 to select the parent frame.
- Choose Tools->Property Palette.
- Under the Repeating Frame node, set the Maximum Records per Page property to 1.
- Click
 and then again in the Runtime Parameter Form.
- Click
 in the toolbar to display the layout that you created in a previous section.
Scroll to the right of the report. Notice the orientation of the report has changed. The report can display all the columns on a single page. Notice also that only one record per page is displayed.
- Save your report as
sect_560.rdf.
5.7 Specifying distribution
The steps in this section will help you to specify the distribution for the two sections that you have created:
- a detailed report showing investment fund elections, and an account summary for employees vested at a specified percentage (at least one landscape page per employee).
- a one-page summary report of all employees vested at a specified percentage.
You will distribute your report as follows:
- print two copies of the detailed section.
- format the detailed section in HTML for access on a secure Web site.
- format the summary section as a PDF.
5.7.1 Specifying distribution for the detailed section
- In the Object Navigator, type
Main Section in the Find field.
- Choose Tools->Property Palette.
- Click the Distribution value field to display the Distribution dialog box. Specify two distribution output destinations for the report that summarizes account information for employees.
- In the Distribution dialog box, specify the distribution for printing the report:
Table 5-11 Distribution settings for the printed Main section
Tip: If you select Printer as the DESTYPE first, the DESNAME is automatically set to your default printer.Change this value if you want to send this report to another printer.
- Click New.
- In the Distribution dialog box, define the distribution for HTML output:
Table 5-12 Distribution settings for the HTML version of the Main section
- Click OK.
- Save your report as sect_571.rdf.
5.7.2 Specifying distribution for the summary section
- In the Object Navigator, click the Header Section node.
- Choose Tools->Property Palette.
- In the Property Palette, under the Section node, click in the Distribution value field to display the Distribution dialog box.
- In the Distribution dialog box, define the distribution for sending the summary section to PDF:
Table 5-13 Distribution settings for the PDF version of the Header section
- Save your report as
sect_572.rdf.
Optional Exercise:
Try setting up distribution to e-mail the executive summary. You will need a MAPI-compliant mail application set up on your system.
5.7.3 Distributing the report
- In the Object Navigator, click your report name, then choose File->Distribute.
- In the Runtime Parameter Form, click
 .
.
- In the dialog box that prompts for your confirmation to distribute to multiple destinations, click Continue.
- Check the printer, your file system, and (optionally) your e-mail inbox to verify that your report was distributed as expected.
Optional Exercise:
Try setting up distribution by creating a .DSTfile and running the distribution from the command line.
Tip: You can trace report distribution. The trace file, which is similar to a .DST file, is generated when you check the Distribution check box in the Runtime Trace Settings dialog box.
5.8 Summary
Congratulations! You have finished the Sectioning sample report. You now know how to:
- Create a data model and refine it in the Data Model view.
- Build a Runtime Parameter Form.
- Create a default layout for a detailed section, and refine it in the Layout Model view.
- Create a default layout for a summary section and refine it in the Layout Model view and Live Previewer.
- Specify report distribution criteria.
For more information about sectioning and distribution, see the online help:
|
 |
- For online help on this topic, choose Help->Report Builder Help Topics
- On the Index page, type...
sectioning, about
- Then click Display to view help topic...
About report sectioning
|


![]() while the property is selected.
while the property is selected.


![]() indicates that Confine Mode is on.
indicates that Confine Mode is on. ![]() indicates that Confine Mode off.
indicates that Confine Mode off.


![]() indicates that Flex mode is on.
indicates that Flex mode is on. ![]() indicates that Flex mode is off. Shift-click the data under the following headings:
indicates that Flex mode is off. Shift-click the data under the following headings:


![]() to switch between the Margin and Body of your report. Alternatively, choose View->Layout Section. A check mark next to Edit Margin indicates the Layout Model view is in Margin mode.
to switch between the Margin and Body of your report. Alternatively, choose View->Layout Section. A check mark next to Edit Margin indicates the Layout Model view is in Margin mode.
