4
Building a Report for the Web
The report described in this chapter is designed to help you learn more about Report Builder features for the Web.
To build this report, you will use the Report Wizard to create a data model. Then, you will use the Web Wizard to create an HTML report. You will make fairly extensive manual refinements in the Layout Model view and the Live Previewer. In particular, you will use the Web Settings properties. You will use the Chart Wizard to create a chart, and then return to the Web Wizard to add chart hyperlinks.
To view your Web report, you will need a Web browser, such as Netscape 3.x or higher, or Internet Explorer 3.x or higher, that supports HTML style sheets and Javascript.
In this example, you will create:
- a detailed Web report containing additional HTML pages, Web links, and Javascript that shows the sales and profit results from a video sales company.
- a one-page executive summary containing a chart with chart hyperlinks.
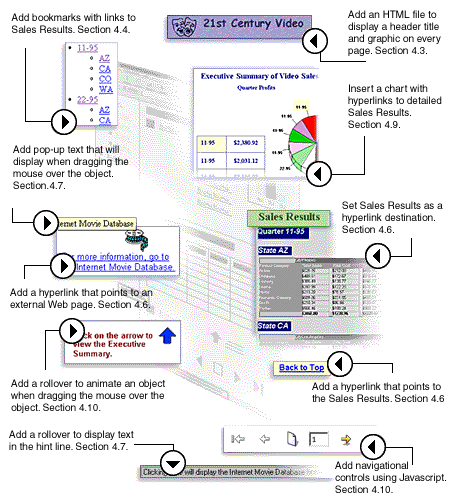
The following figure illustrates the various Web features that you will add to your Web report. Table 4-1, "Features demonstrated in this Web sample report", describes the steps you will take to enhance your report with these Web features.
To build this report, you will need the following files, which are located in your ORACLE_HOME\TOOLS\DOC60\US\RBBR60 directory:
rbweb_hdr.htm
rbweb_ps.htm
1.gif
3.gif
chalk.jpg
imdb.bmp
drama.gif
- 14 .GIFs containing page, first, back, or next as part of file name (e.g.,
page-e.gif).
The web.rdf file contains the report you will create after finishing the tasks in this chapter. You may want to refer to this file while you are working. This file is located in your ORACLE_HOME\TOOLS\DOC60\US\RBBR60 directory.
Table 4-1 Features demonstrated in this Web sample report
To get started, open Report Builder. If the Welcome dialog box appears, click Use the Report Wizard and click OK. If not, choose File->New->Report. Click Use the Report Wizard and click OK.
At some point before you generate the report, you will need to log into the database. Choose File->Connect to connect to the database. Enter the appropriate log on information. See Section 1.3, "Obtaining database access before you start" for details.
4.1 Creating a data model
The steps in this section will help you use the Report Wizard to create a data model with a single query and a report with a default layout.
|
 |
- For online help on this topic, choose Help->Report Builder Help Topics
- On the Index page, type...
report, building
- Then click Display to view help topic...
Building a standard report
|
- If the Welcome page of the Report Wizard appears, click Next.
- On the Style page, click Matrix with Group.
- Click Next.
- If the Type page appears, click SQL statement, and click Next. The Type page will appear only if you have configured Report Builder to run with Oracle Express.
- On the Data page, click Query Builder.
- In the Select Data Tables dialog box, click VIDEO_CATEGORY_BY_QTR.
|
 |
- For online help on this topic, choose Help->Report Builder Help Topics
- On the Index page, type...
query, creating
- Then click Display to view help topic...
Creating a local query: Report Wizard
|
- Click Include.
- Click Close.
- Click
 .
.
Tip: Doing so checks all of the column check boxes.
|
 |
- For online help on this topic, choose Help->Report Builder Help Topics
- On the Index page, type...
Query Builder, conditions
- Then click Display to view help topic...
Adding conditions to a query
|
- Click the Condition field in the left-hand pane so that your cursor displays in the field.
- In the Query window, click the SALES REGION column in the table.
- In the Condition field, place your cursor after "SALES REGION".
- Type ='West'.
- Click
 in the toolbar.
Tip: You now should see SALES_REGION='West' in the Condition field.
- Click OK.
- Click Next.
- On the Groups page, click QUARTER, then click
 to move it into the Matrix Group Fields list.
- Repeat step 17 to move the STATE field to the Matrix Group Fields list.
- Click Next.
- On the Rows page, click PRODUCT_CATEGORY, then click to move the field into the Matrix Row Fields list.
- Click Next.
- On the Columns page, click CITY, then click to move the field into the Matrix Column Fields list.
- Click Next.
- On the Cells page, click TOTAL_COST, then click to move the field into the Matrix Cell Fields list.
- Repeat step 24 to move the following fields into the Matrix Cell Fields list:
- Click Next.
- On the Totals page, click TOTAL_COST, then click Sum to move the sum of the TOTAL_COST field into the Matrix Totals list.
- Repeat step 27 to move the sums of the following fields to the Matrix Totals list:
- Click Next.
- On the Labels page, modify the widths as shown in the following table:
Table 4-2 Labels and widths
- Click Next.
- On the Template page, under Predefined templates, click the Corporate 1 template.
- Click Finish.
- Choose File->Save As. Save the report in the directory of your choice, and name the report
web_41.rdf.
Tip: It is good practice when you are designing your report to save it frequently under a different file name. If you generate an error or if you don't like some of the changes you made, you easily can go back to the previously saved file and make revisions from that point.
4.2 Modifying the look of your report output
The steps in this section will help you modify the appearance of data by using format masks and changing the maximum rows of data returned by your query.
4.2.1 Modifying the layout in the Live Previewer
|
 |
- For online help on this topic, choose Help->Report Builder Help Topics
- On the Index page, type...
object, deleting
- Then click Display to view help topic...
Deleting an object
|
- In the Live Previewer, click the image in the header to select it, and press DELETE.
- Select the date and boilerplate text object labeled "Report run on:". You can select the objects by shift-clicking on each object.
- Press DELETE.
- Click
 to go to the Layout Model view.
- In the Object Navigator, place your cursor in the Find field and type
F_SumTOTAL_SALESPerPRODUCT_CATEGORY.
- Press DELETE.
- Repeat steps 5 and 6 to delete these fields:
- F_SumTOTAL_COSTPerPRODUCT_CATEGORY
- F_SumTOTAL_PROFITPerPRODUCT_CATEGORY
- F_SumTOTAL_SALESPerSTATE
- F_SumTOTAL_COSTPerSTATE
- F_SumTOTAL_PROFITPerSTATE
- Click
 to go to the Live Previewer.
- In the Live Previewer, click
 to go to the last page of the report.
- Delete the following fields and their labels:
- F_SumTOTAL_SALESPerReport
- F_SumTOTAL_COSTPerReport
- F_SumTOTAL_PROFITPerReport
- the page number at the bottom of the page
Tip: You can view the name of any object by clicking on it once, then choosing Tools->Property Palette to view the Name property.
- Save your report as
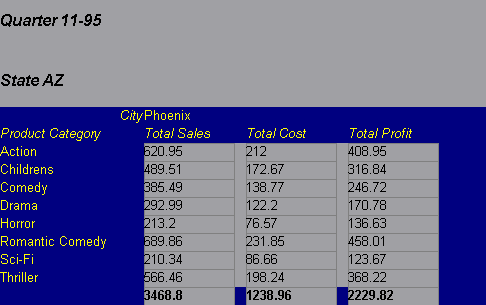
web_412.rdf. Your output should look something like the following figure in the Live Previewer:
4.2.2 Adding format masks
|
 |
- For online help on this topic, choose Help->Report Builder Help Topics
- On the Index page, type...
format mask, applying to numeric object
- Then click Display to view help topic...
Applying a format mask to a numeric object
|
- In the Live Previewer, click on the F_TOTAL_SALES column of data (located under the Total Sales title of data).
- Click
 to add the dollar sign to each value.
- Click
 twice to add two decimal places.
- Select all of the following objects by shift-clicking each object, then follow steps 2 and 3 to set the format masks:
- Total Cost column of data
- Total Profit column of data
- F_SumTOTAL_SALESPerCITY (the last field in the Total Sales column)
- F_SumTOTAL_COSTPerCITY (the last field in the Total Cost column)
- F_SumTOTAL_PROFITPerCITY (the last field in the Total Profit column)
- Click to go to the last page of the report.
- Select all of the following objects by shift-clicking each object, then follow steps 2 and 3 to set the format masks:
- F_SumTOTAL_SALESPerQUARTER
- F_SumTOTAL_COSTPerQUARTER
- F_SumTOTAL_PROFITPerQUARTER
4.2.3 Changing the maximum number of rows returned by your query
When designing a large report (i.e., one that retrieves many records), it is helpful to reduce the number of records retrieved during the design and test phases of the project.
- In the Live Previewer, click
 to access the Data Model view.
- In the Data Model view, click on Q_1.
- Choose Tools->Property Palette.
- In the Property Palette, under the Query node, set the Maximum Rows to Fetch property to 100.
Tip: Note that you can change this property according to the number of rows you want to view. However, the more rows you fetch, the longer it will take for your browser to load your HTML output. When you are done designing your report and you want to see all of the rows of data, you should reset this property to blank.
- Press RETURN or ENTER.
- Save your report as
web_42.rdf.
4.3 Including an HTML report header
The steps in this section will help you to add an HTML file to your report. This will add a title and graphic to your HTML output. It will also add a background to every page of your HTML output. The HTML report header page contains the information in the <HEAD> tag of your HTML output.
- In the Object Navigator, click
 next to your report.
- Choose Tools->Property Palette.
- In the Property Palette, under the Report Escapes node, set the Before Report Type property to File.
- Set the Before Report Value property to your directory
\rbweb_hdr.htm.
Tip: You can click on the browse (...) button to locate this file. This file should be located in your ORACLE_HOME\TOOLS\DOC60\US\RBBR60 directory.
|
 |
- For online help on this topic, choose Help->Report Builder Help Topics
- On the Index page, type...
HTML output, creating document header
- Then click Display to view help topic...
Creating an HTML document header
|
- Optional: At this point, you can also return to the Layout Model view and modify the colors of the text and field objects in your layout. You can do this by
clicking on each object, then clicking  (or the other two icons above and below it) and choosing a color from the palette.
- In the Object Navigator, click next to your report.
- Save your report output as
web_43.rdf.
- Generate HTML output by choosing File->Generate to File->HTML Style Sheet. When prompted, save your report output as
web_43.htm.
- Open
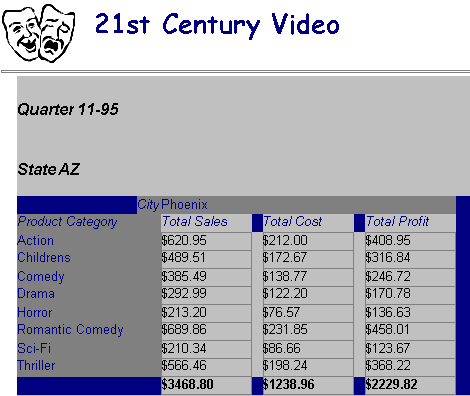
web_43.htm in your Web browser. Confirm that the title "21st Century Video" and a graphic appear at the beginning of your report.
Tip: At this point, your layout may overlay part of the header. This will be fixed in a later step. Note also that you can add other HTML files to your report by using the other properties under Report Escapes.
Your HTML output should look something like the following figure:
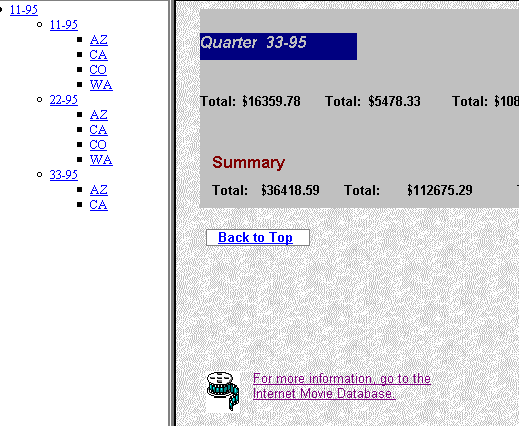
4.4 Adding bookmarks to parts of your report
The steps in this section will help you to add bookmarks to your report and generate HTML output:
- Go from your web browser to Report Builder, if you are not already there.
- In the Live Previewer, choose Tools->Web Wizard.
- If the Welcome page of the Web Wizard appears, click Next.
- On the Bookmarks page, move the QUARTER and STATE columns to the Bookmarks list by selecting each, and clicking .
- Click Next.
- On the HTML Headers/Footers page, you should see the HTML header file you added to your report in Section 4.3, "Including an HTML report header". Click Next.
- On the Finished page, click Generate HTML style sheet output now. Note that if you check the Generate to Web Browser check box, not all of the additional HTML files you've added will display.
- Click Finish. You will be prompted to choose a file name and directory. Save your file as
web_44.htm.
- In the Object Navigator, click next to your report.
- Save your report output as
web_44.rdf.
- Open
web_44.htm in your Web browser. Click on some of the bookmarks to check that they work properly.
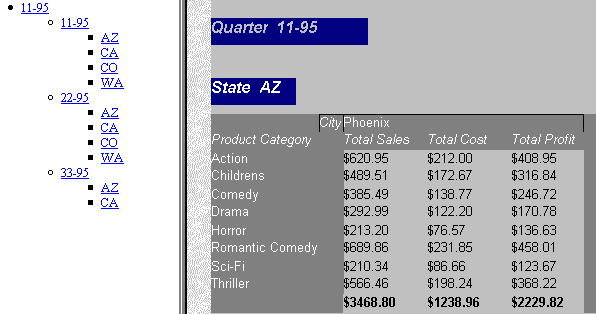
Your HTML output should look something like the following figure:
4.5 Changing the page separator
While viewing the HTML output in your browser, you will notice a gray line separating each "page" of your output. The steps in this section will help you to remove that page separator.
- In the Object Navigator, click next to your report.
- Choose Tools->Property Palette.
- In the Property Palette, under the Report Escapes node, delete the After Page Value property.
|
 |
- For online help on this topic, choose Help->Report Builder Help Topics
- On the Index page, type...
After Page Value property
- Then click Display to view help topic...
After Page Value
|
- In the Object Navigator, click next to your report.
- Save your report output as
web_45.rdf.
- Choose File->Generate to File->HTML Style Sheet.
- When prompted, save the HTML output as
web_45.htm.
- Open
web_45.htm in your Web browser to confirm the page separator no longer displays between pages. You can compare web_45.htm to web_44.htm.
4.6 Adding hyperlink destinations and hyperlinks
In your HTML output, you may want to add hyperlinks so that you can click on text or images to access other hyperlink destinations, such as external URLs or other destinations within your report. The steps in this section will help you to add targets to your Web report, and then add hyperlinks that link to the targets, as well as to external hyperlink destinations.
4.6.1 Adding hyperlink destinations
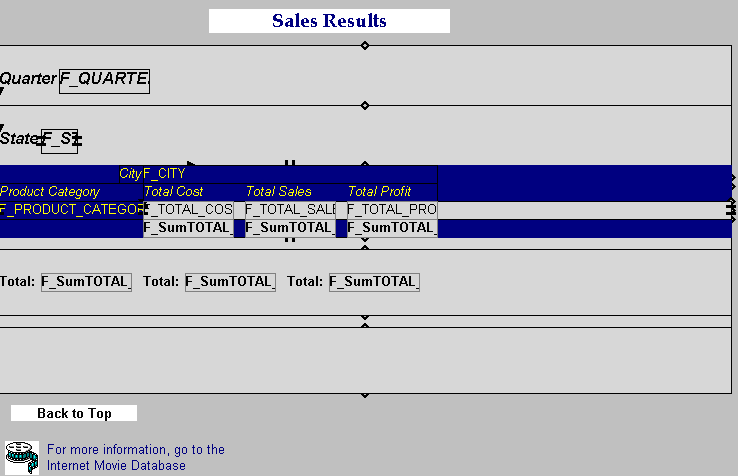
- In the Layout Model view, choose Edit->Select All to select all the objects, and move the entire selection down 0.5 inches.
Tip: In addition to dragging with the mouse, you can also move selected objects using the arrow keys.
- Click
 to create a boilerplate text object above the layout, and type
 Sales Results.
Tip: You can use the color-changing tools in the tool palette to modify the look of this text object.
|
 |
- For online help on this topic, choose Help->Report Builder Help Topics
- On the Index page, type...
text, creating boilerplate
- Then click Display to view help topic...
Creating a boilerplate object for text
|
- Choose Tools->Property Palette.
- In the Property Palette, under the General Information node, set the Name property to
Text_RptTop.
- Under the Web Settings node, set the Hyperlink Destination property to
rpt_top.
|
 |
- For online help on this topic, choose Help->Report Builder Help Topics
- On the Index page, type...
hyperlink destination, creating
- Then click Display to view help topic...
Creating a hyperlink destination using the Property palette
|
- In the Object Navigator, click next to your report.
- Save your report output as
web_461.rdf. This text object is the target of a hyperlink you will create in a later step.
4.6.2 Adding hyperlinks to destinations within the report
- In the Layout Model view, click . Repeating steps 2 and 3 of Section 4.6.1, "Adding hyperlink destinations", create a boilerplate text object below the layout, and type Back to Top.
- Under the General Information node, set the Name property to
text_totop.
- Under the Web Settings node, set the Hyperlink property to
#rpt_top.
- In the Object Navigator, click next to your report.
- Save your report output as
web_462.rdf.
4.6.3 Adding hyperlinks to external destinations
- In the Layout Model view, choose File->Import->Image.
- In the Import Image dialog box, click File. Then either type the path and name of the image (
imdb.bmp), or click Browse to find the file.
- Click OK.
- In the Layout Model view, click on the image object you just imported, and drag it down below the table and the boilerplate text object labeled "Back to Top".
- Choose Tools->Property Palette.
- In the Property Palette, under the General Information node, set the Name property to
IMDB_BMP.
- Click to create a boilerplate text object below the table. Type
For more information, go to the Internet Movie Database.
- When finished, click
 .
.
- Click on the boilerplate text object you just created.
- Click
 .
.
- In the color palette, click a color, such as blue.
Tip: You can also choose colors for the background of the textbox, or remove the line from the border of the textbox.
- Shift-click the image object and the new boilerplate text object.
- Choose Tools->Property Palette.
- In the Property Palette, under the Web Settings node, set the Hyperlink property to
http://www.imdb.com.
|
 |
- For online help on this topic, choose Help->Report Builder Help Topics
- On the Index page, type...
hyperlink, creating
- Then click Display to view help topic...
Creating a hyperlink using the Property palette
|
- In the Layout Model view, select the boilerplate text object labeled "For more information, go to the Internet Movie Database".
- Choose Tools->Property Palette.
- In the Property Palette, under the General Information node, set the Name property to
IMDB_text.
Your current layout should look similar to the following figure:
- In the Object Navigator, click next to your report.
- Save your report output as
web_463.rdf.
- Generate HTML output by choosing File->Generate to File->HTML Style Sheet.
- When prompted, save your report output as
web_463.htm.
- Open
web_463.htm in your Web browser to confirm that the new hyperlinks work properly.
Your HTML output should look similar to the following figure:
4.7 Displaying pop-ups and rollovers in HTML output
You can further enhance objects that contain hyperlinks by adding pop-ups and rollovers that contain textual descriptions. The steps in this section will help you to create pop-up and rollover text that displays when you drag the mouse over an object in your HTML report.
4.7.1 Adding a pop-up to an image object
|
 |
- For online help on this topic, choose Help->Report Builder Help Topics
- On the Index page, type...
display name property
- Then click Display to view help topic...
Display Name
|
- In the Object Navigator, place your cursor in the Find field and type
IMDB_BMP.
- Choose Tools->Property Palette to display the Property Palette for the imported image object.
- In the Property Palette, under the Web Settings node, set the Display Name (HTML) property to
Internet Movie Database.
- In the Object Navigator, click next to your report.
- Save your report output as
web_471.rdf.
- Generate HTML output by choosing File->Generate to File->HTML Style Sheet.
- When prompted, save your report output as
web_471.htm.
- Open
web_471.htm in your Web browser.
- Drag your mouse over the image object to view the pop-up text that displays over the object.
4.7.2 Adding a rollover to an image object
- In the Object Navigator, under the Main Section node, then the Body node, click
 next to IMDB_BMP.
- Choose Tools->Property Palette.
- In the Property Palette, under the Web Settings node, set the Additional Hyperlink Attributes (HTML) to:
onMouseover="window.status='Clicking here will display the
Internet Movie Database home page.';return true"
onMouseOut="window.status=' ';return true"
- Press RETURN or ENTER to make sure the property is set.
- In the Object Navigator, click next to your report.
- Save your report output as
web_472.rdf.
- Generate HTML output by choosing File->Generate to File->HTML Style Sheet.
- When prompted, save your report output as
web_472.htm.
- Open
web_472.htm in your Web browser.
- Drag your mouse over the image object to view the rollover text in the hint line of your browser. Note that you will have to scroll down to the end of the HTML document in order to view the image object.
4.8 Using PL/SQL to conditionally hide/show objects for Web output
The steps in this section will help you to specify that certain objects, such as page numbers, will not display in your HTML, HTMLCSS, or PDF output. However, these items will still display in other report file formats.
- In the Layout Model view, click the boilerplate text object labeled "Back to Top".
- Choose Tools->Property Palette.
- Under the Advanced Layout node, set the Format Trigger property to:
function text_totop1FormatTrigger return boolean is
begin
  if UPPER(:DESFORMAT) = 'HTML' or
     UPPER(:DESFORMAT) = 'HTMLCSS' or
     UPPER(:DESFORMAT) = 'PDF'
  then
     return (TRUE);
  else
     return (FALSE);
  end if;
end;
- Click Compile.
- If any compilation errors occur, check the code for syntax errors, and recompile as needed.
- Click Close.
- In the Object Navigator, click next to your report.
- Save your report output as
web_48.rdf.
- Click to view your report output in Report Builder's Live Previewer.
- Generate HTML output by choosing File->Generate to File->HTML Style Sheet.
- When prompted, save your report output as
web_48.htm.
- Open
web_48.htm in your Web browser. Compare your HTML output to your report output in the Report Builder Live Previewer. The boilerplate text object labeled "Back to Top" should display in your browser, but not in the Live Previewer.
4.9 Creating a summary section with a chart
The steps in this section will help you to create a summary section for your report, and include a pie chart in the summary section.
4.9.1 Creating the data model for the summary section
- Return to Report Builder from the web browser if you are not already there.
- In the Data Model view, click
 and click on the canvas region.
Tip: If the Data Model tool palette is not displayed, choose View->Property Palette.
- In the SQL Query Statement dialog box, click Query Builder.
- In the Select Data Tables dialog box, click VIDEO_CATEGORY_BY_QTR.
- Click Include.
- Click Close.
- In Query Builder, check the QUARTER column check box and the TOTAL PROFIT column check box in the table.
- In the Condition field, type the condition:
SALES_REGION='West'AND TOTAL_PROFIT>2000
- Click .
- Click OK.
- In the SQL Query Statement dialog box, click OK.
- In the Object Navigator, click next to your report.
- Save your report output as
web_491.rdf.
4.9.2 Creating the default layout for the summary section
- In the Layout Model view, click
 to access the Header section of your report.
|
 |
- For online help on this topic, choose Help->Report Builder Help Topics
- On the Index page, type...
repeating frame, creating
- Then click Display to view help topic...
Creating a frame or repeating frame
|
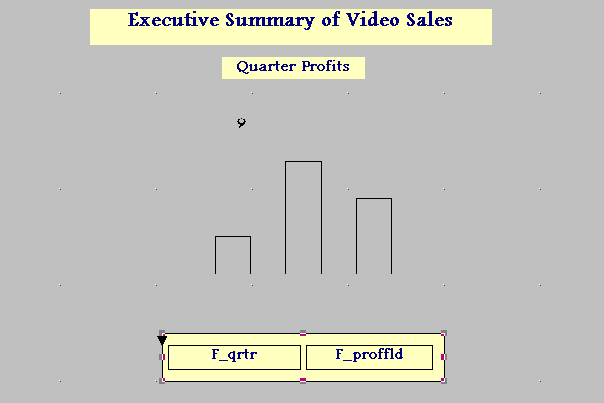
- In the Header section, click to create a boilerplate text object at the top of the layout. Type
Executive Summary of Video Sales.
- Click on the boilerplate text object you just created, then choose Format->Font.
- In the Font dialog box, choose a font, such as Footlight MT Light, then click OK.
Tip: While the boilerplate text object is still selected, you can change the font and fill colors.
- Click to create a boilerplate text object below the one you've just created. Type
Quarter Profits.
- Click
 and create a repeating frame that is about 3 inches wide and 0.5 inches tall about 4 inches from the top of the layout.
- Choose Tools->Property Palette.
- In the Property Palette, under the General Information node, set the Name property to
R_execprof.
- Under the Repeating Frame node, set the Source property to G_QUARTER1.
|
 |
- For online help on this topic, choose Help->Report Builder Help Topics
- On the Index page, type...
field, creating
- Then click Display to view help topic...
Creating a field object
|
- Click
 and create a field that fits inside the repeating frame (approximately
1.5 inches wide and 0.25 inches tall).
- Choose Tools->Property Palette.
- In the Property Palette, under the General Information node, set the Name property to
F_qrtr.
- Under the Field node, set the Source property to QUARTER1.
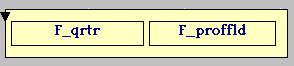
- Repeat steps 10 and 11 to create a second field. Set the following properties:
Table 4-3 Property settings for second field
- Arrange the layout to look similar to the following figure:
- Click to check that your query and layout work properly.
Tip: If you receive PL/SQL errors, you can try choosing Program->Compile->All to compile your format triggers.
- In the Object Navigator, click next to your report.
- Save your report as
web_492.rdf.
- Generate HTML output by choosing File->Generate to File->HTML Style Sheet.
- When prompted, save your report output as
web_492.htm.
- Open
web_492.htm in your Web browser to confirm that the first page displays your new header page.
4.9.3 Creating a chart for the summary section
|
 |
- For online help on this topic, choose Help->Report Builder Help Topics
- On the Index page, type...
chart, creating
- Then click Display to view help topic...
Creating a Graphics Builder chart
|
- In the Layout Model view, if you are not in the Header section, click .
- Click
 to bring up the Chart Wizard.
Tip: When you launch the Chart Wizard, Oracle Graphics Builder runs in the background. On Windows, you should see this application in your taskbar.
- If the Welcome page of the Chart Wizard displays, click Next.
- On the Type page, click Pie in the Chart Type list and Depth in the Chart Subtype list.
- Click Next.
- On the Data Group page, click G_QUARTER1(QUARTER1,TOTAL_PROFIT1).
- Click Next.
- On the Category page, click on QUARTER1, then click
 to move the field into the Category Axis list.
- Click Next.
- On the Value page, click on TOTAL_PROFIT1, then click
 to move the field into the Value Axis list.
- Click Next.
- On the Break page, choose to display the chart at the beginning of the report.
- Click Next.
- On the File page, click Save As. When prompted, use the file name rbweb_chart.ogd. Save the file in the same directory as your .
RDF and .HTM files.
|
 |
- For online help on this topic, choose Help->Report Builder Help Topics
- On the Index page, type...
files, supported file types
- Then click Display to view help topic...
Supported files
|
- Click Finish.
- Click on the chart object.
- Choose Tools->Property Palette.
- In the Property Palette, under the General Information node, set the Name property to
rbweb_chart.
- Resize the chart and re-arrange the layout to look similar to the following figure:
- In the Object Navigator, click next to your report.
- Save your report output as
web_493.rdf.
- Generate HTML output by choosing File->Generate to File->HTML Style Sheet.
- When prompted, save your report output as
web_493.htm.
- Open
web_493.htm in your Web browser to confirm that a chart displays on the first page of your output.
4.9.4 Adding hyperlinks to your chart
You can also add hyperlinks to your chart that will drill down to corresponding data. In this exercise, you will create hyperlinks from the pie chart to the summary report you created in Section 4.9.2, "Creating the default layout for the summary section".
- In the Layout Model view, click the Chart object.
- Choose Tools->Property Palette.
- In the Property Palette, under the Chart node, set the Chart Hyperlink property to
#rbweb_chart&<Total_Profit1>.
- In the Object Navigator, place your cursor in the Find field and type
F_PROFFLD.
- Choose Tools->Property Palette.
- In the Property Palette, under the Web Settings node, set the Hyperlink Destination property to
rbweb_chart&<Total_Profit1>.
- Save your report as
web_494.rdf.
- Generate HTML output by choosing File->Generate to File->HTML Style Sheet.
- When prompted, save your report output as
web_494.htm.
- Open
web_494.htm in your Web browser click an area on the pie chart to access the corresponding data in the report.
4.10 Adding Javascript
The steps in this section will help you to add Javascript to your Web report. Doing so will create additional special effects for your report, such as animation and customized navigational controls.
In order for the Javascript in this exercise to work properly, you should have completed Section 4.9, "Creating a summary section with a chart" and Section 4.3, "Including an HTML report header".
4.10.1 Creating animated objects
In this exercise, you will add Javascript to a text object that, when open in a Web browser, will change an image object from blue to red when you pass your mouse over the image.
To complete this exercise, you will need the 1.gif.
- Copy the
1.gif file (located in your ORACLE_HOME\TOOLS\DOC60\US\RBBR60 directory) to the destination directory (the location where the generated HTML files will reside).
- In the Layout Model view, if you are not in the Main section, click
 .
.
- Choose Tools->Property Palette.
- Drag the entire selection up to the top of the Layout Model view (so that there is no empty space between the top margin and the boilerplate text object labeled "Sales Results").
- Click and create a boilerplate text object about 0.5 inches by 0.5 inches,
directly below the layout.
- Type the following Javascript into the boilerplate text object:
<a href="#webrep_bottom" onmouseover=
"document.images['example'].src=image02.src" onmouseout=
"document.images['example'].src=image01.src">
<img src="1.gif" name="example" border=0></a>
- Choose Tools->Property Palette.
- In the Property Palette, under the General Information node, set the Name property to
B_JS.
- Under the Web Settings node, set the Contains HTML Tags property to Yes. Note that part of the necessary Javascript coding has already been entered into the head of your HTML output (the
rbweb_hdr.htm file). In the next step you will add the Javascript to the body of your HTML output.
- Under the Advanced Layout node, set the Format Trigger property to:
function B_JSFormatTrigger return boolean is
begin
  if UPPER(:DESFORMAT) = 'HTML' or
     UPPER(:DESFORMAT) = 'HTMLCSS' or
     UPPER(:DESFORMAT) = 'PDF'
  then
     return (TRUE);
  else
     return (FALSE);
  end if;
end;
- Click Compile.
- If any compilation errors occur, check the code for syntax errors, and recompile as needed.
- Click Close.
- Set the Print Object On property to All Pages.
- In the Layout Model view, create a boilerplate text object labeled
Click on the arrow to view the Executive Summary. Place this object next to the boilerplate text object containing the Javascript (B_JS).
- Choose Tools->Property Palette.
- In the Property Palette, under the Advanced Layout node, set the Print Object On property to All Pages.
- In the Object Navigator, click next to your report.
- Save your report output as
web_4101.rdf.
- Generate HTML output by choosing File->Generate to File->HTML Style Sheet.
- When prompted, save your report output as
web_4101.htm.
- Open
web_4101.htm in your Web browser and confirm that the boilerplate text object you created displays. You should also see a blue arrow that turns red when you drag your mouse over it.
Tip: You can click on this arrow to access your Executive Summary if you've completed Section 4.9, "Creating a summary section with a chart". You can also repeat step 3 in Section 4.8, "Using PL/SQL to conditionally hide/show objects for Web output" to conditionally show/hide the objects you created in this section, so that they only display in your HTML output.
4.10.2 Using HTML page streaming
You can use HTML page streaming in your Web report to display navigational controls so that users can easily move from one page to another. HTML page streaming enables you to display individual pages of your HTML/HTMLCSS report output in your Web browser, without having to download the entire report. From the first page of the report, you can navigate to any page in the rest of the report. When you click a bookmark or hyperlink with a destination:
- within the report, the frame that contains the current page will update with the destination page.
- outside the report, the entire base frame (including the bookmark frame, the page, and the navigation frame) will reload.
Report Builder provides default page streaming controls. For this exercise, however, you will use customized the navigational controls. For your convenience, the graphics and javascript needed to create the customized controls have been provided. They are:
rbweb_ps.htm, which contains the javascript
- 14 .GIFs containing page, first, back, or next as part of file name (e.g.,
page-e.gif)
- Copy the .GIF and .HTM files (located in your
ORACLE_HOME\TOOLS\DOC60\US\RBBR60 directory) to the destination directory (the location where the generated HTML files will reside).
- In the Object Navigator, click next to your report.
- Choose Tools->Property Palette.
- In the Property Palette, under the Report Escapes node, set the following properties:
Table 4-4 Property settings for page streaming
- Save your report output as web_4102.rdf.
- Exit Report Builder.
- Restart Report Builder from the command line by typing the following:
rwbld60 pagestream=yes.
- Open the report (last saved as
web_4102.rdf).
- Connect to the database.
- Generate HTML output by choosing File->Connect.
- Choose
- In the Object Navigator, click next to your report.
- When prompted, save your report output as web_4102.htm.
- Open
web_4102.htm in your Web browser and confirm that the navigational controls display.
|
 |
- For online help on this topic, choose Help->Report Builder Help Topics
- On the Index page, type...
HTML page streaming, displaying individual pages
- Then click Display to view help topic...
Displaying individual pages of HTML report output
|
4.11 Running the Web report from the Reports Server
The steps in this section are optional; they will help you run your report dynamically from the Reports Server.
To complete this exercise, you must have Oracle Developer Server software, and must have installed and configured the Reports Server for dynamic reporting. Refer to the Publishing Reports manual for more information, or contact your system administrator for assistance.
- Copy the following files from the
ORACLE_HOME\TOOLS\DOC60\US\RBBR60 directory on your machine to the directory where the cached files are sent. Refer to the Reports Server configuration file to determine the cache directory.
rbweb_hdr.htm
rbweb_page.htm
1.gif
3.gif
drama.gif
- 14 .GIFs containing page, first, back, or next as part of the file name (e.g., page-e.gif).
- Ensure that the Reports Server can locate your Web report, last saved as web_4102.rdf (i.e., the location of the report is set in the SOURCEDIR parameter of the Reports Server Configuration file or set in the REPORTS60_PATH environment variable).
- From your Web browser, make the following request:
http://your_webserver/cgi-bin/rwcgi60.exe?report=web_4102.rdf+
userid=user_name/password@mydb+
server=repserver+desformat=htmlcss+
destype=cache+pagestream=yes
where:
your_webserver is the URL address of the Web server
cgi-bin is the virtual location of the CGI or OWS executable
user_name/password@mydb is the connection string to the database
repserver is the name of the Reports Server
4.12 Summary
Congratulations! You have finished the Web sample report. You now know how to:
- Apply format masks.
- Add other HTML files via Report Escapes.
- Add bookmarks to facilitate navigation.
- Add hyperlinks to destinations within your report and to external Web sites.
- Display pop-ups and rollovers.
- Conditionally hide and show items for Web output.
- Create an executive summary section for your report that contains a chart.
- Create special effects using Javascript.
For more information about web-based reports, see the online help:
|
 |
- For online help on this topic, choose Help->Report Builder Help Topics
- On the Index page, type...
web report, about
- Then click Display to view help topic...
About web reports
|