10g (9.0.4)
Part Number B10188-01
Home |
Solution Area |
Contents |
Index |
| Oracle Application Server Wireless Administrator's Guide 10g (9.0.4) Part Number B10188-01 |
|
Oracle Application Server Wireless, when installed, initializes a default setup that is appropriate for the performance of most applications. However, you may need to use additional tuning knobs to adjust performance, since applications vary in features, hardware setup, and performance requirements.
This chapter discusses the tuning options and methods available within Oracle Application Server Wireless and the performance logger utility. It also discusses JVM tuning, JDBC connection performance, and TCP/IP stack tuning.
This chapter discusses factors that enable application developers to optimize the Transport system. Sections include:
To view performance statistics of the Transport system, select the Site Performance tab and then click Messaging Server. The Messaging Server performance screen appears (Figure 13-1).
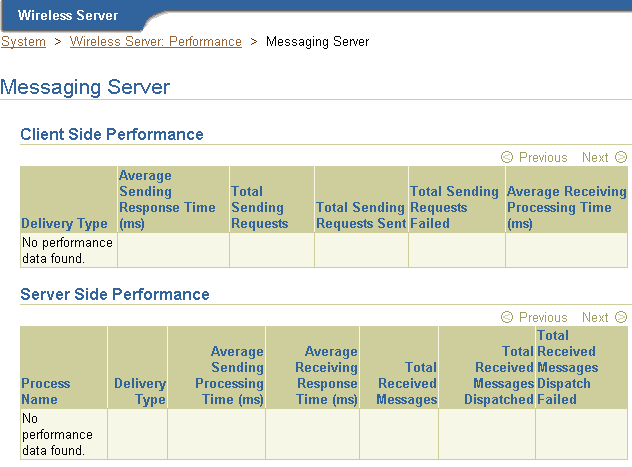
This screen displays the client side and server side Messaging Server performance metrics. For each of the Messaging Server Performance metrics, Wireless displays performance data by process name and delivery type (for example, SMS).
The client side performance metrics include:
The average time of a sending method. On the client side, a sending method is called to send a message. This time is the period from when the method is called to the time the method returns. When the method returns, the message is saved in a database persistently, but is not delivered.
The total time that the sending method is called by the client process. A sending method called once to send a message to a set of destinations counts as a single sending request.
The total number of successful calls, where a message is delivered to a proper gateway and its receipt is acknowledged. The client process can call the sending method many times to send many messages. Some of these requests fail, as in the case where a destination cannot be reached. Other requests could be undergoing processing.
The total number of all calls that are known to have failed.
The performance of the listener in terms of the time taken by the onMessage call-back.
The server-side performance metrics include:
The performance of a driver in terms of the time taken by the sending method of the driver. The driver performance is measured by delivery type (for example, SMS), process time (the time taken by a driver to send a message to the proper gateway), dequeue time, and driver process time. When you measure the performance of the transport system, you can deduct the process time, because the transport system is waiting while the driver sends a message. If the driver is fast, then the system does not wait long.
Once a transport driver receives a message, the message is passed to the transport system by an onMessage method. The response time is the time taken by the onMessage method. Once the onMessage returns, the received message is saved in a database for dispatching.
The total number of times the transport drivers call the onMessage call-back method.
The total number of received messages which are dispatched to, and are accepted by, the listeners. Among received messages, some may be in processing. Others may not have been dispatched to listeners, or listeners may have failed to process dispatched messages.
The total number of received messages which failed to dispatch to a listener.
For more information on the Site Performance, see Section 3.5.
This section describes the factors that affect transport performance. Topics include:
To determine the need for changing the number of sending and receiving threads, users check the number of enqueued messages in the following table.
trans_t_queue_number
The queue_number for the driver can be found from the table trans_driver_queue.
If the number of enqueued messages is high, then increasing the number of sending threads de-queues messages more quickly. However, increasing the number of sending threads can increase the I/O wait on the database machine. An optimum number of sending threads can be found by varying the number of threads and studying the I/O on the system and the de-queing rate.
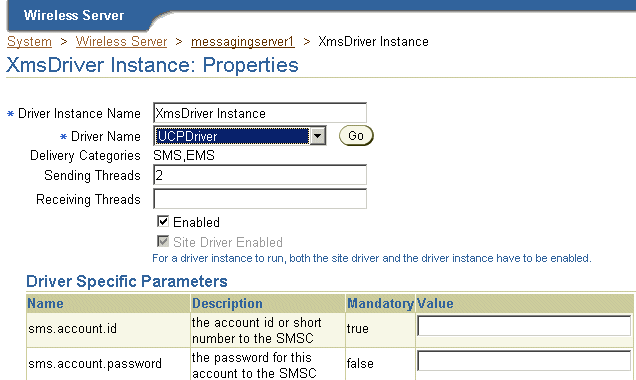
Using the System Manager, you can increase the number of sending threads (and in turn hasten the dequeing of messages) by editing a driver instance. You use the System Manager's driver properties screen to edit a driver instance (Figure 13-2). To access this screen, select a messaging server process from the Standalone Processes section of the Home screen. The detail screen for the messaging server process then appears. From the Drivers Instance table, select a driver and then click Edit. The Driver Instance Properties screen appears, with its field populated by the values set for the selected driver.
|
Note: All of the values for a driver instance, including the number of sending and receiving threads for a driver instance, are set at the Site level through the Messaging Server Configuration screen, accessed from the Site Administration page of the System Manager. For more information on setting the site-wide values for a driver instance, see Messaging Server Configuration in Section 3.6.2.5. |
From this screen, you can change the increase the number of threads set in the Sending Threads field.
To increase the rate of enqueuing, you can increase the number of receiving threads. You can adjust the number of receiving threads using the method described in Section 13.2.1.1.1.
For more information about driver instances, see Process Level and Site Level configuration for the Messaging Server in Section 3.3.4.2.
AQ (Advanced Queuing) operations result in high number of insertions and deletions from the database. Hence, I/O values on the database will be high and will need careful tuning. Based on the volume of operations, you should consider increasing the number of I/O controllers on the machine.
In the test environment, the following observations have been verified.
Running the transport process on a machine that runs the Database and running PTG on a separate machine enables improved performance.
The System Manager displays the performance-related data for an Async Listener process. The performance logging framework at the Web Server level collects this data.
To view this data, you first drill down from the Async Listener process (located in the Web-Based Processes section of the System Manager's Home page) to the detail page. Clicking the Performance tab invokes the Performance page for the process. The page includes the following performance metrics:
The number of messages received, grouped by process ID.
The average time a message stayed on the server.
The average size of the message queue on an hourly basis for today.
The number of times that each application was accessed today.
The number of messages issued by each user device.
The number of errors on an hourly basis.
The following knobs are available in Wireless to tune Sync Server Performance. Topics include:
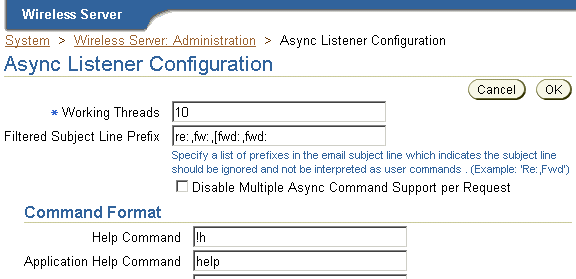
You can change the number of worker threads for the Async Listener using the System Manager's Async Listener Configuration screen (Figure 13-3), which you access from the Administration page.
By default, the value for the Working Threads parameter is 10. You can increase this parameter to a higher value to accommodate a higher request rate.
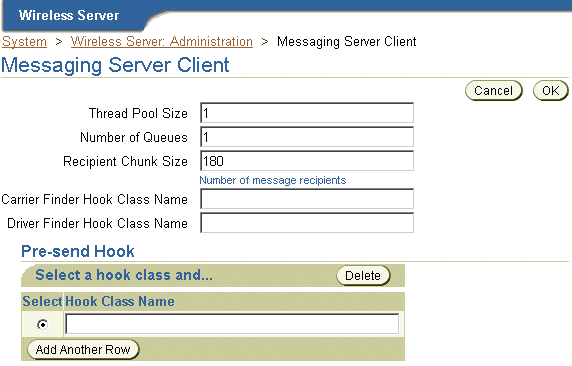
Increasing the size of the thread pool enables the Messaging Server client to handle higher loads. You can adjust the size of the thread pool from the Messaging Server Client screen of the System Manager. To access this screen (Figure 13-4), select Messaging Server Client (located under Notification Engine in the Component Configuration section) on the Administration screen. For more information on configuring the Messenger Sever client, see Section 3.6.2.3.
You can also increase the sending and receiving threads for the messaging driver to speed up dequeuing and enqueuing. For more information, see Section 13.2.
Parsing input is a costly operation. The performance of such operations depends largely on the amount of memory available to the Java Virtual machine (JVM). To handle a high feed size, you can increase the heap size of the Data Feeder process. Normally, parsing XML feeds consume larger resources than CSV (comma-separated variable) feeds.
In the test environment, the following observations have been verified.
This section discusses how to optimize performance of the Oracle HTTP Server (OHS). Each of the following section describes the directives that you can tune in the httpd.conf file in OHS to enhance performance.
This is the maximum number of servers that can run. An optimum number should be used based on load. A low number causes clients to be locked out; a high number of servers consumes more resources.
The number of requests that a child process handles before it expires and gets re-spawned. The default value 0 means that it will never expire. As as result, you should limit this value. Ideally, 10000 is sufficient.
This is the maximum number of pre-spawned processes that are available in the pool of the Apache process that handles connections. The suggested value may vary, as 10 will suffice for most requirements.
This is the minimum number of child processes that need to be pre-spawned all the time. The value 5 will suffice for most requirements.
The number of servers to start initially. If a sudden load is expected on startup, then this value should be increased.
The number of seconds before incoming receives, and outgoing sends the time out. The recommended value is 300 seconds.
Because the default file descriptor number per JVM is low, you should increase this number to a higher value. The number must be increased inside the following script:
$ORACLE_HOME/opmn/bin/opmnctl
This can be done by adding or modifying the following line.
> ulimit -n 2048
Oracle Application Server uses database connections for Single Sign On, OID, and other connections. The default number of connections may not suffice for a high number of users. You should therefore increase this number as users increase.
You can increase this number by modifying the relevant files in the database.
The WebCache capacity should be set to a high value depending upon the load. For example, if you are hitting 50 requests per second, then you must set the capacity to 1000. Also, depending upon the size of the documents to be cached, the WebCache should be allotted space as appropriate.
Java applications run within the context of the JVM. Hence, it is important to change certain default properties of JVM to run a particular application faster and consume fewer resources.
Since Garbage Collection (GC) is not a parallel process until the release of Java 1.3.1, it can become the most important performance bottleneck as the number of CPU's increase.
Java 1.3.1 implements the concept of generational garbage collections. It is based on the observation that young objects die fast. Hence, objects are put in different memory pools based on their age. As a result, there are two different GC cycles that run: Minor Collection and Major Collection.
The Collection of young objects from the young generation pool and the copying of surviving objects to the older generation pool. (Copying).
The Collection of older generation objects. (Mark-Compact).
The first step in tuning is to observe the frequency of GC by using the following command line options.
> java -verbose: gc classname
This command results in output similar to the following:
> [ GC 866K->764K(1984K), 0.0037943 secs]
> [GC 1796K->1568K(2112K), 0.0068823 secs]
> [Full GC 2080K->1846K(3136K), 0.0461094 secs]
> [GC 2047K->1955K(3136K), 0.0157263 secs]
The following knobs are available within Java 1.3.1 to change this default behavior.
The total size of the heap is bounded by the -Xms and -XMX values. -Xms is the minimum size of the heap and -Xmx is the maximum size to which the heap can grow. Having a larger heap will reduce the frequency of collections.
You should increase the heap size as the number of processors increase, since allocation can be done in parallel.
The following list of parameters is specific to Sun's HotSpot VM.
- XX:

NewSize

XX:

MaxNewSize
The young generation size is bounded by these values. Having a smaller generation means a faster rate of collection by minor collection and lower frequency of major collections. This is ideally suited for web applications.
By changing these four parameters, you can change the frequency of collections as desired by the application.
Other knobs that help GC performance include:
SoftReferences are cleared only when the need for memory is high. The rate of collection can be changed using the above parameter. The following value means 10 seconds per megabyte.
-XX: SoftRefLRUPolicyMSPerMB=10000
Having this option in the command line disables all explicit calls to GC, System.gc(). It leaves all GC operations to the JVM and reduces unnecessary collections.
Apart from GC tuning, the threading model of the JVM can be changed (in Solaris). It recommended to use the -XX:+UseBoundThreads option to enable a one-on-one binding of Java threads with kernel-level threads and provide significant performance boost.
This is the size of the stack per thread. Its default value changes from platform to platform. If the number of threads running in the application is high, then you can decrease the default size. If the threads require a high stack space, for example, for parsing operations and recursive calls, then increasing the stack size can provide significant performance increase.
This JIT option crashed the JVM (JDK 1.3.1_01). Avoid this knob unless a patch becomes available.
You tune the value of these options according to the application type. Table 13-1 describes a typical setup for the E420/Solaris box with four 450Mhz processors and four GB RAM to support 2000 concurrent users.
| Attribute | Recommended Value |
|---|---|
|
-Xms |
256m |
|
-Xmx |
1024m |
|
-XX: NewSize |
64m |
|
-XX: MaxNewSize |
128m |
|
-XX: SoftRefLRUPolicyMSPerMB |
10000 |
|
-Xss |
512K |
|
-XX:UseLWPSynchronization |
This thread model should be used |
This section describes tuning methods for the operating system's performance of Oracle Application Server Wireless.
Correctly tuned TCP/IP settings improve performance. The indicators for changing default parameters are primarily TCP connection drops, while making the three-way handshake, and the system refusing connections at a certain load.
Using the following UNIX command to check for TCP connection drops:
netstat - s | grep Drop
Note the following value:
tcpListenDrop, tcpListenDropQ0, tcpHalfOpenDrop
Any value other than zero suggests the need for changing the tcp connection queue size. While any value for tcpListernDrop suggests a bottleneck in executing the accept() call and value for tcpListenDropQ0. It is an indication of SYN flood or denial-of-services attack.
Use the following UNIX command to check if connections should be replenished more quickly:
netstat | grep TIME_WAIT | wc - l
You should note the number of connections in the TIME_WAIT state. If the rate of establishing connections (load) is known, then you can compute the time taken to run out of connections. To ensure that new connections are readily available, you can decrease the tcp_time_wait_interval to a low value of 10000 ms.
The following is a list of TCP values recommended for Solaris. You can set most of these values using the following UNIX command.
ndd
> ndd - set /dev/tcp tcp_time_wait_interval 10000
These parameters (described in Table 13-2) , take effect after the application is restarted. They should be added to the system startup file so that they are not lost after a reboot
You must change the tcp_conn_hash_size in the file /etc/system after a reboot.
To enhance performance, you can change the Solaris Kernel performance parameters (described in Table 13-3) in the file /etc/system.
|
|
 Copyright © 2003 Oracle Corporation. All Rights Reserved. |
|