|
Oracle® Application Server ProcessConnect User’s Guide
10g (9.0.4) Part No. B12121-02 |
|


|

|
|
Oracle® Application Server ProcessConnect User’s Guide
10g (9.0.4) Part No. B12121-02 |
|
|
|
|
This chapter describes how to manage the performance of components of Oracle Application Server ProcessConnect, including the adapter framework, integration manager, and metadata repository.
This chapter contains these topics:
Performance Factors in Oracle Application Server ProcessConnect
Components of an Oracle Application Server ProcessConnect Instance
Diagnosing Performance Issues in Oracle Application Server ProcessConnect
ProcessConnect performance is affected by the following:
The number of events being processed
The number of steps and the complexity of the steps involved in processing each event
The size and complexity of the events themselves
In general, when ProcessConnect processes a large number of events, in which each event has a large number of steps to process, a bottleneck is likely to occur in either the adapter framework or the integration manager. When ProcessConnect parses, translates, and transforms very large events, a bottleneck is likely to occur in either the translation binding role or the transformation binding role.
The following sections discuss bottlenecks in ProcessConnect components and tuning you can do to the components.
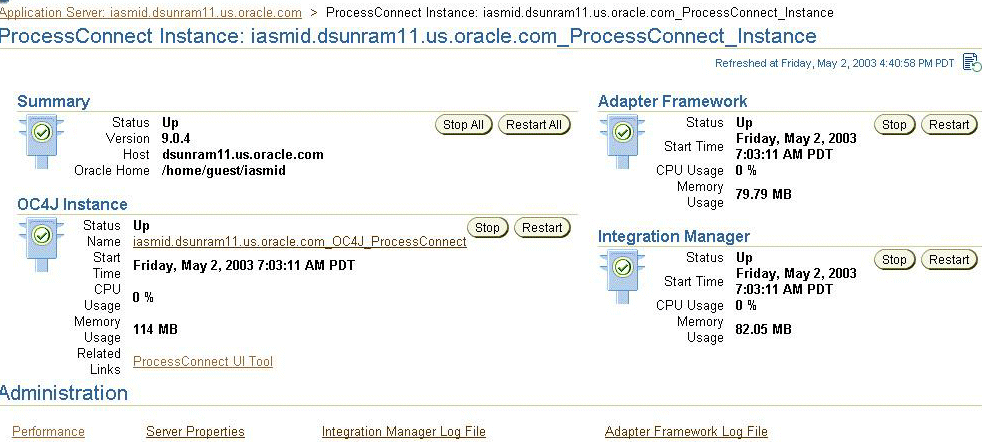
In an Oracle Application Server ProcessConnect instance, the adapter framework, integration manager, and Oracle Application Server Containers for J2EE (OC4J) communicate with the back-end Oracle Application Server Metadata Repository (an Oracle database). These components are shown in Figure 19-1, which depicts the ProcessConnect instance page of Oracle Enterprise Manager 10g Application Server Control Console.
Figure 19-1 Oracle Application Server ProcessConnect Components
An adapter framework instance communicates with one or more parties using the party’s respective adapter. For example, an adapter framework instance that communicates with an application that uses Oracle Advance Queuing will use the Advanced Queuing adapter. The adapter framework is responsible for receiving inbound messages and delivering outbound messages to the adapters.
The integration manager is responsible for executing the business processes (which include roles and steps) for all deployed and active configurations.
|
See Also: Chapter 18, " System Management with Oracle Enterprise Manager 10g" for information about the OC4J instance |
To ensure that Oracle Application Server ProcessConnect meets the requirements for performance and scalability required by mission-critical systems, ProcessConnect and its various services—the adapter framework, the integration manager, and translation and transformation services—are designed to be stateless. All states are written to the ProcessConnect runtime repository. As a result, ProcessConnect and its various services can be configured to meet additional scalability and throughput requirements by adding threads or instances depending on where the bottleneck is. You can configure these parameters from the Server Properties link on the ProcessConnect instance page of Oracle Enterprise Manager 10g Application Server Control Console. Oracle Enterprise Manager 10g Application Server Control Console can be used to diagnose performance and scalability bottlenecks.
To diagnose performance bottlenecks within ProcessConnect:
Use Oracle Enterprise Manager 10g Application Server Control Console to examine CPU and memory usage.
If CPU usage is high, that is, if more than 80% of the CPU is consumed, then there is a resource bottleneck, which can be either the adapter framework or integration manager.
Use the ProcessConnect instance page from the Oracle Enterprise Manager 10g Application Server Control Console to examine the CPU consumed by the adapter framework and integration manager to determine which one is the potential bottleneck.
Click the Performance link (under the Administration section) for performance statistics on translation, transformation, active applications, and active trading partners.
The following sections describe adapter framework, integration manager, and design tool performance and tuning.
Adapter framework performance is affected by:
The number of adapter types loaded
The rate at which messages are entering and leaving the system
These factors affect memory and CPU usage for the adapter framework instance. You can view memory and CPU usage in the Oracle Enterprise Manager 10g Application Server Control Console, as shown in Figure 19-1.
Each adapter framework instance has one or more threads to handle inbound and outbound messages. The inbound threads are created by the specific adapter and are not controlled by the adapter framework. Refer to specific adapter documentation to tune the performance of incoming messages.
The adapter framework outbound processor threads pick up messages that have been processed by the integration manager and deliver them to the adapters. You can configure adapter parameters by editing the Outbound Processor Threads property. Access the parameters from the Server Properties link on the ProcessConnect instance page of Oracle Enterprise Manager 10g Application Server Control Console.
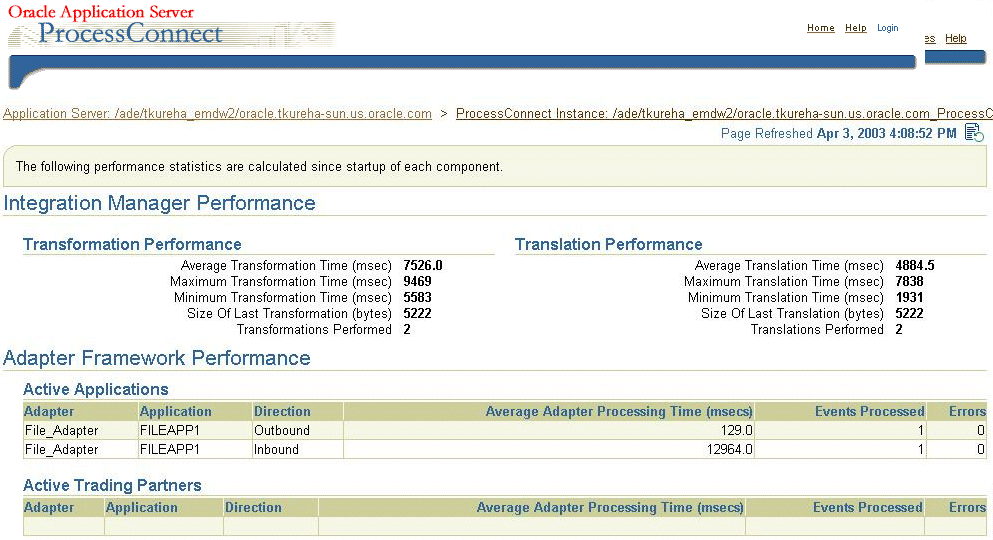
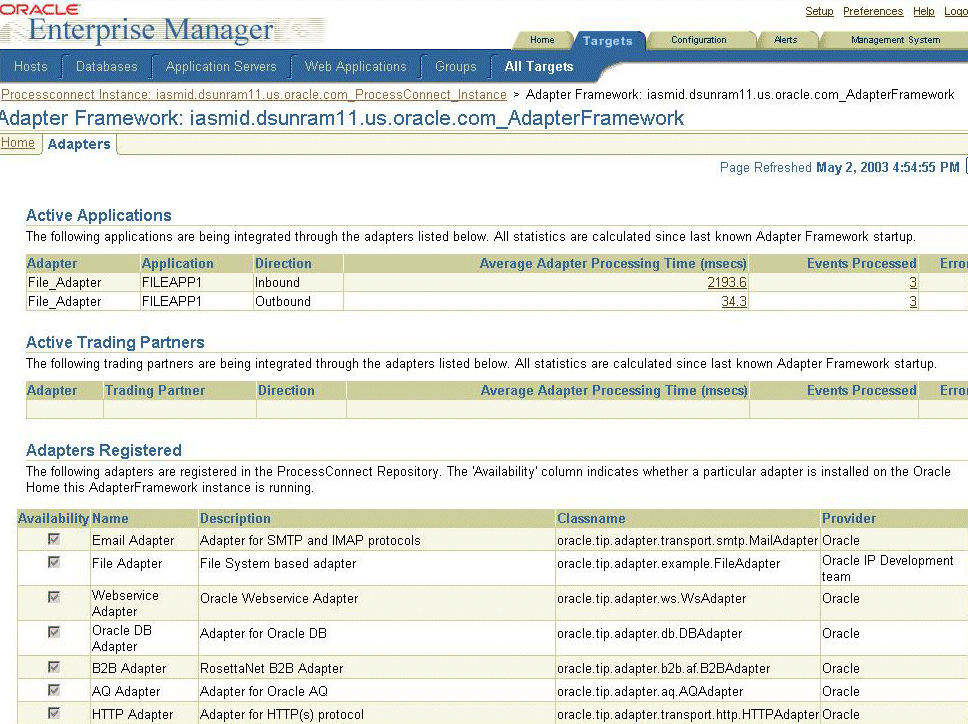
As Figure 19-2 shows (in the bottom portion), you can view adapter framework performance details in Oracle Enterprise Manager 10g Application Server Control Console.
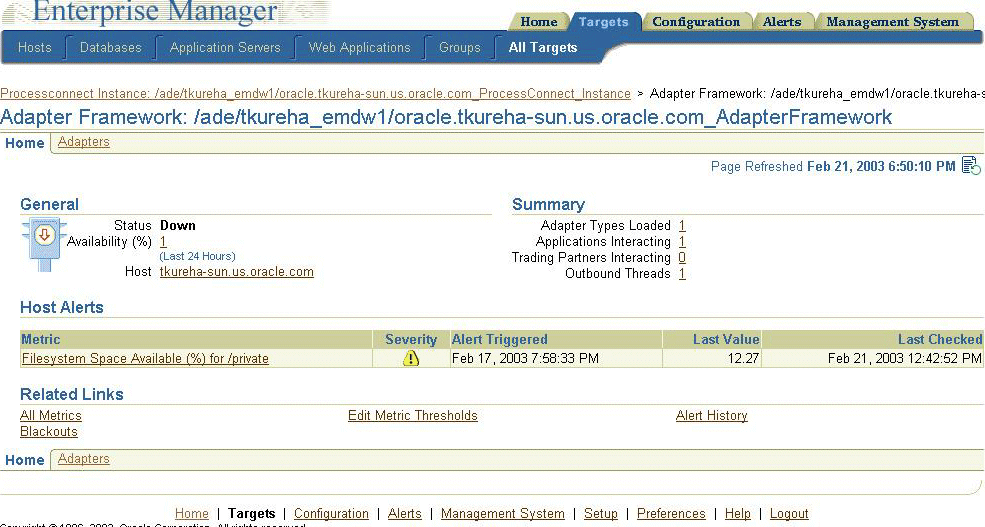
Figure 19–3 and Figure 19–4 show adapter framework details from Oracle Enterprise Manager 10g Grid Control Console.
Figure 19-4 Adapter Interaction and Performance Details
Adapter framework performance can be tuned by appropriately setting the Java Virtual Machine (JVM) memory size and the number of outbound processor threads. If the message rate is high and the adapter framework is not processing messages at an acceptable rate, then you can tune the adapter framework as described in "Increasing JVM Memory for the Adapter Framework".
If the adapter framework CPU usage is high, you may need additional adapter framework instances on different hosts connecting to the same Oracle Application Server Metadata Repository.
|
See Also: Oracle Application Server ProcessConnect Installation Guide for installing adapter framework instances |
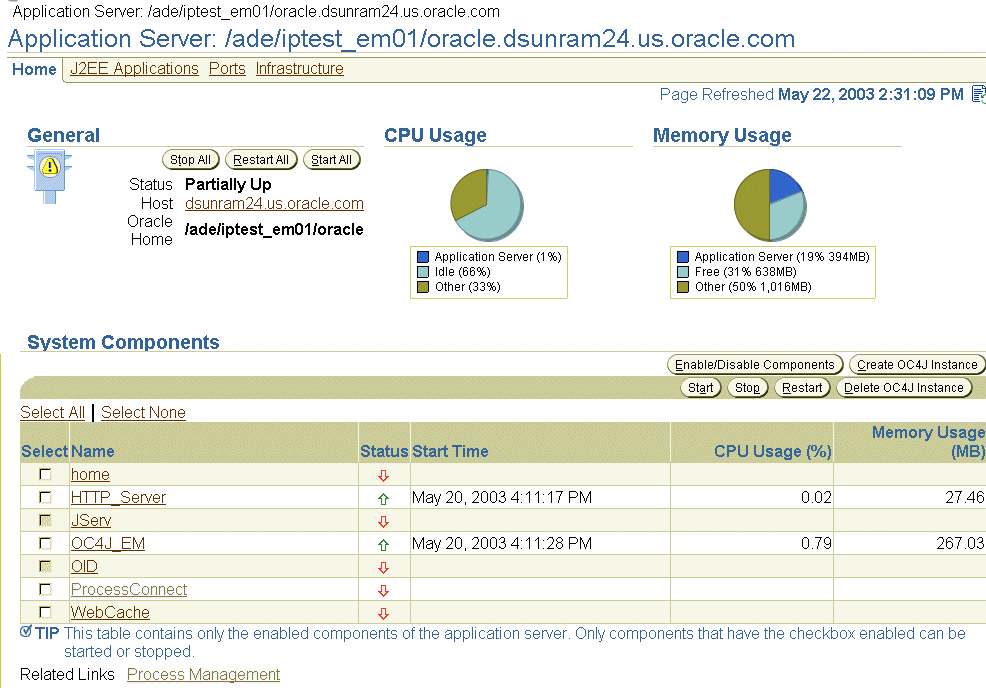
Figure 19-5 shows the Oracle Enterprise Manager 10g Application Server Control Console, with the Process Management link at the bottom of the screen.
Figure 19-5 Oracle Enterprise Manager 10g Application Server Control Console
To increase JVM memory, from Oracle Enterprise Manager 10g Application Server Control Console, do the following:
Click Process Management.
In the opmn.xml file window, increase the heap size by changing 512 to 1024, as shown in line 4:
1  <process-type id="AdapterFramework" module-id="adapter-framework" working-dir="$ORACLE_HOME/ip">
2   <module-data>
3    <category id="start-parameters">
4     <data id="java-parameters" value="-Xms8M -Xmx1024M"/
                      .
                      .
                      .
              </process-type>
Increasing the number of outbound processor threads can improve performance when the adapter framework CPU usage is less than 60%.
To increase the number of outbound processor threads, from Oracle Enterprise Manager 10g Application Server Control Console, do the following:
How you use the technology adapters affects the performance and scalability of Oracle Application Server ProcessConnect. This section discusses the best practices for using the most commonly used adapters—the Advanced Queuing (AQ) adapter, the Oracle Database adapter, and the File/FTP adapter.
|
See Also: Chapter 8, "Oracle Application Server ProcessConnect Technology Adapters" for adapter details |
The following guidelines apply to the Advanced Queuing adapter:
In general, raw queues perform better. If you are using Oracle Object queues or Oracle Object queues with a payload field, the complexity of the object affects performance. For example, the larger the number of LOBS in the object, the more performance will decrease.
|
See Also: Oracle Streams Advanced Queuing User's Guide and Reference |
Multiconsumer queues may be slower than single-consumer queues because of the extra processing involved in multiconsumer queues.
In Oracle Application Server ProcessConnect, two parameters can be tuned for better performance:
The maximum time in milliseconds to block waiting for an event:
oracle.tip.runtime.eventselector_timeout=n
Setting this to a high value improves performance, but increases the time it takes to shut down the integration manager.
The number of inbound threads for the Advanced Queuing adapter:
oracle.tip.af.aq.threads=n
Setting this to a high value improves performance if multiple processors are available.
The following guidelines apply to the Oracle Database adapter:
Performance is affected by the structure of the table. The simpler the fields of the table, the faster it processes at runtime.
Optimizing the query defined in the inbound interaction that retrieves the records in the inbound direction (at runtime) improves performance.
If the update option is chosen for an inbound interaction, then specify the required columns explicitly in the SELECT clause of the SQL statement defining the interaction. This excludes the status columns that are updated by the adapter and improves performance.
The following guidelines apply to the inbound interaction when using the File/FTP adapter:
Choose a polling interval that closely reflects the rate of incoming files. If files are coming in quickly, then the default polling interval of 60 seconds may be too slow.
For the number of files retrieved per polling interval parameter, specify a number that is greater than or equal to the number of files expected to come in. Choosing a number that is far less than the rate of incoming files results in poor performance.
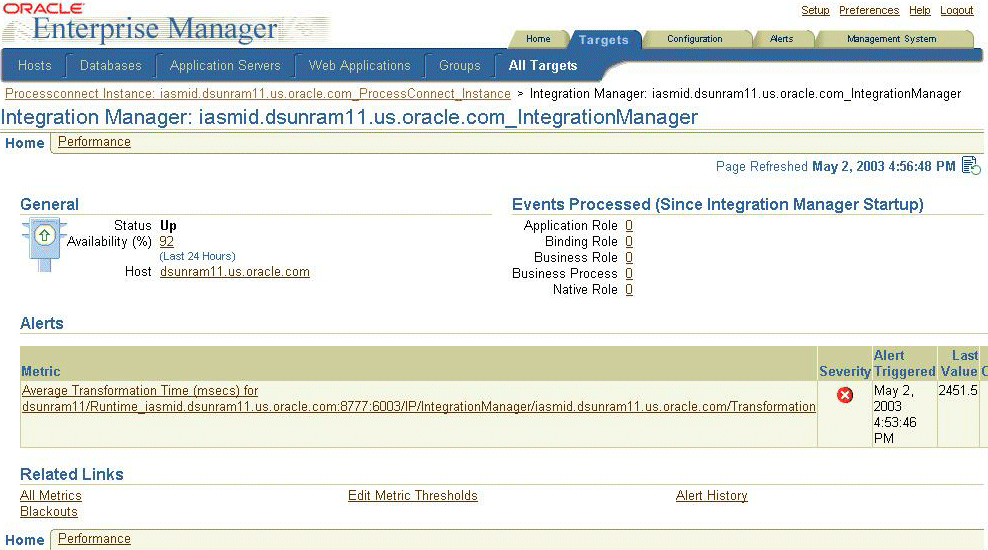
As Figure 19-1 shows, you can view memory and CPU usage for the integration manager in Oracle Enterprise Manager 10g Application Server Control Console.
Integration manager performance is affected by the following:
The complexity of the role in the business process, particularly the number of transformation and translation steps
The size of the messages
The rate at which messages enter the system
The business intelligence (BI) reporting level set during configuration deployment
The integration manager has five thread pools for role processing and error handling. You can configure the number of threads in each pool by editing the following parameters. In general, increasing the values of the following parameters can improve performance, although performance increases are bounded by the capacity of your computer to handle many threads. Access the parameters from the Server Properties link on the ProcessConnect instance page of Oracle Enterprise Manager 10g Application Server Control Console.
Native role threads
Native Role Threads handle the steps in the native roles. The number of threads should be between 1 and 5. The default is 2.
Binding role threads
Binding Role Threads handle the steps in the translation and transformation binding roles. This thread pool should have at least double the number of threads in the other pools; that is, it should be between 2 and 10. The default is 4.
Application role threads
Application Role Threads execute the steps in the application roles. This number should be between 1 and 5. The default is 2.
Business role threads
Business Role Threads execute the steps in the business roles. This number should be between 1 and 5. The default is 2.
Business process role threads
Business Process Role Threads execute the steps in the business process roles. This number should be between 1 and 5. The default is 2.
System Logger Threads are used to log system errors. This should be set between 1 and 3. The default is 1.
oracle.tip.runtime.eventselector_timeout
This parameter determines the maximum time the role processor threads block waiting for an event. Setting this to a high value (30-60 seconds) improves performance, but increases the time it takes to shut down the integration manager. The default is 5 seconds.
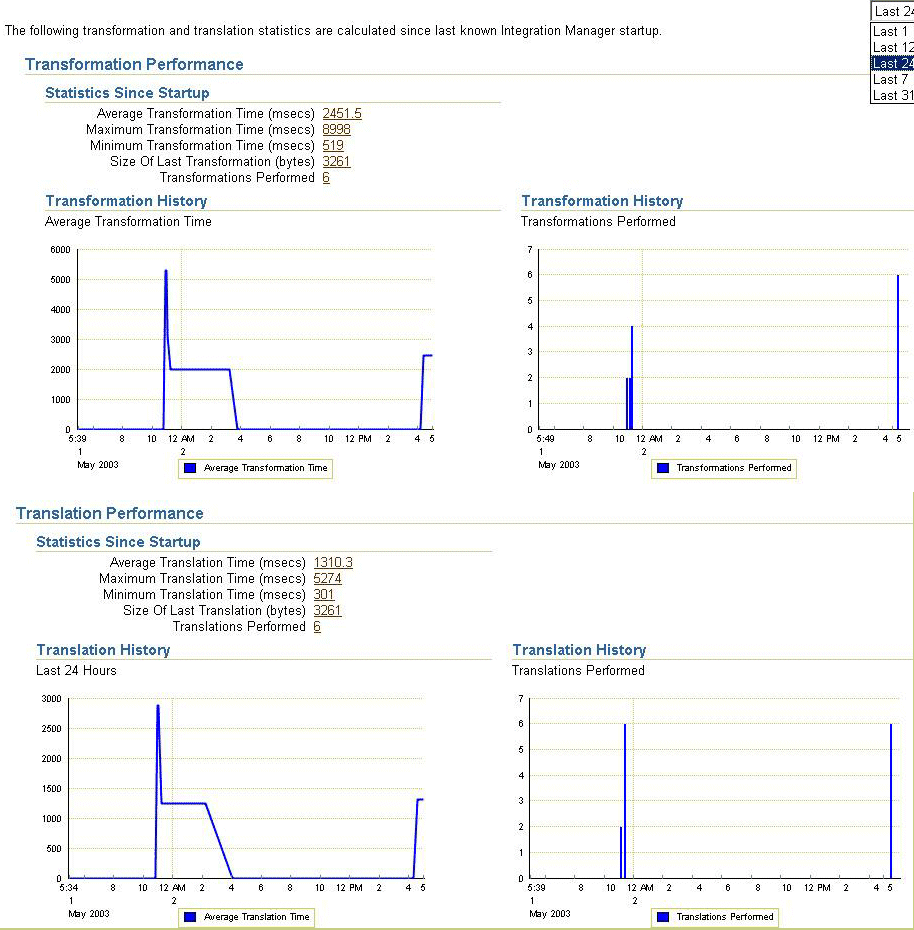
In general, transformation and translation are the most CPU- and memory-intensive operations in the integration manager. You can view transformation and translation performance in Oracle Enterprise Manager 10g Grid Control Console, as shown in Figure 19-6 and Figure 19–7. Based on the transformation and translation performance, you can determine if the number of binding role threads in the Binding Role Threads parameter should be increased.
If the integration manager is not processing messages at an acceptable rate, then you can do the following:
Monitor transformation and translation performance
Increase the number of concurrent transformations and translations
Choose the appropriate BI reporting level during deployment
Add more integration manager instances
You can monitor transformation and translation performance through Oracle Enterprise Manager 10g Grid Control Console, as shown in Figure 19-6 and Figure 19–7. In general, transformation and translation performance depend on the size of the message and the number of transformation rules. For large messages, you may need to increase the JVM memory for the integration manager. The required memory is as follows:
100 x number of binding role threads x size of payload (in MB)
To increase JVM memory, from the Oracle Enterprise Manager 10g Application Server Control Console (see Figure 19-5), do the following:
Click Process Management.
The opmn.xml file window is displayed.
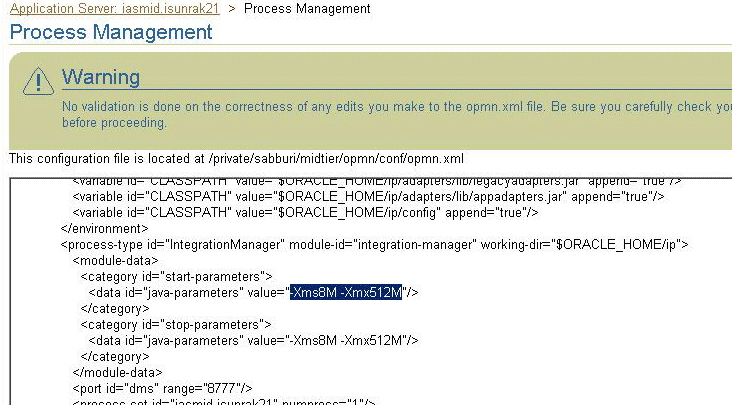
In the opmn.xml file window, increase the heap size by changing 512 to 1024, as shown in line 4:
1  <process-type id="IntegrationManager" module-id="integration-manager" working-dir="$ORACLE_HOME/ip">
2   <module-data>
3    <category id="start-parameters">
4     <data id="java-parameters" value="-Xms8M -Xmx1024M"/
                     .
                     .
                     .
              </process-type>
Increasing the number of concurrent translations and transformations by increasing the number the binding role threads can also improve performance.
To increase the number of binding role threads, from Oracle Enterprise Manager 10g Application Server Control Console, do the following:
Click ProcessConnect from the System Components table.
Click Server Properties.
Increase the number in the Binding Role Threads field.
If the application roles, native roles, business roles, and business process roles have complex roles, then you may need to increase the size of their respective thread pools.
Finally, to improve performance, you can add integration manager instances connecting to the same Oracle Application Server Metadata Repository if the integration manager CPU usage is greater than 80%.
|
See Also: Oracle Application Server ProcessConnect Installation Guide for installing integration manager instances |
The BI reporting level controls the amount of instance state that is logged by the integration manager while executing the deployed business processes. This information is used by the ProcessConnect process monitoring and activity monitoring reports. By default the BI reporting level is set to high during deployment. When the BI reporting level is set to high, all reports are fully functional. Setting the BI reporting level to low reduces database activity and hence gives better performance. In some cases there can be up to a 2x performance improvement with a low BI reporting level. However, in this mode, some reports are not available.
|
See Also: Chapter 23, " Creating Reports" for details on the reports available with various BI levels |
The design tool runs as part of the OC4J instance. The performance of the design tool is determined by the number of concurrent users and the complexity of the integration scenario.
Creating and deploying configurations are memory-intensive tasks. These tasks can take around 5 to 20 minutes. If the tasks are considerably slower, then you may need to increase the JVM heap size (the default is 512M) for the OC4J instance.
To increase JVM memory, from the Oracle Enterprise Manager 10g Application Server Control Console (see Figure 19-5), do the following:
Click Process Management.
In the opmn.xml file window, increase the heap size by changing 512 to 1024, as shown in line 4:
1  <process-type id="OC4J_ProcessConnect" module-id="OC4J">
2   <module-data>
3    <category id="start-parameters">
4     <data id="java-options"      value="-Djava.security.policy=/private/sabburi/midtier/j2ee/OC4J_ProcessConnect/config/java2.policy-Djava.awt.headless=true -Xms32M -Xmx1024M"/
                       .
                       .
                       .
              </process-type>
If you have memory starvation or contention issues, you can do the following:
If you are not executing any active configurations, shut down the integration manager and adapter framework.
Design and deploy your configurations.
Restart the integration manager and adapter framework.
If Oracle Identity Management is not used and if the OracleAS Infrastructure 10g runs on the same machine, you can do the following:
In the Oracle home corresponding to the back-end infrastructure repository, shut down all OPMN-managed processes related to the OracleAS Infrastructure 10g. (If Oracle Identity Management is used, then the OPMN-managed OID and OC4J security processes are required for ProcessConnect to run.)
The Oracle Application Server ProcessConnect database schema and integration metadata are stored in the metadata repository of OracleAS Infrastructure 10g. The metadata repository is used by the Oracle Application Server ProcessConnect design tool and runtime components to access the integration metadata and record execution state. Hence it is critical that the infrastructure database is tuned for maximum performance.
|
See Also: Oracle9i Database Performance Guide and Reference, Part IV, for details on gathering database performance statistics using theSTATSPACK tool
|
The following are most relevant for ProcessConnect performance:
Proper sizing and effective use of the Oracle memory caches greatly improve database performance.
The shared_pool parameter controls the memory available for the library cache and the dictionary cache. This should be set to at least 35 MB for optimal performance.
The db_cache_size parameter controls the memory available for the buffer cache. This memory is used to cache blocks read from disk. This should be set to at least 50 MB for good performance.
By default, the repository database is installed on a single disk. If your ProcessConnect integration is I/O constrained, you may see some benefit by distributing the I/O across multiple disks.
On Solaris, use Òiostat –xtcnÓ to see the per-disk activity. If the disk containing the repository database is 50% or more busy, then it is a good candidate for I/O distribution. The redo logs probably generate the most I/O, so try moving them to a different disk first. You can also use statspack to identify tablespaces with high I/O activity that may also be candidates for moving to different disks.
Oracle provides automatic undo management, which automates the management of undo data. A database running in automatic undo management mode transparently creates and manages undo segments. Oracle strongly recommends using automatic undo management, because it significantly simplifies database management and in general gives better performance.
Configuring the temporary tablespace helps optimize disk sort performance. This involves choosing good storage clauses and the correct type of tablespace to use for sorting.
|
See Also: Oracle9i Database Performance Guide and Reference, Part III, for details on configuring the database for good performance |