|
Oracle® Business Intelligence Discoverer Plus User's Guide
10g Release 2 (10.1.2.0.0) Part No. B13915-01 |
|
 Previous |
 Next |
|
Oracle® Business Intelligence Discoverer Plus User's Guide
10g Release 2 (10.1.2.0.0) Part No. B13915-01 |
|
 Previous |
 Next |
OracleAS Portal publishers can create the following types of Discoverer portlets:
List of Worksheets portlet (for more information, see "About the Discoverer List of Worksheets portlet")
Worksheet portlet (for more information, see "About the Discoverer Worksheet portlet")
Gauges portlet (for more information, see "About the Discoverer Gauges portlet")
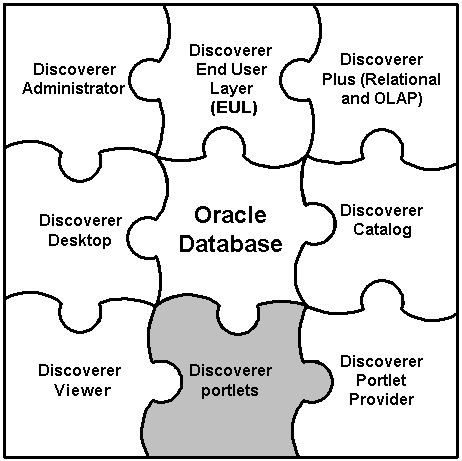
Figure 21-3 Discoverer portlets in relation to the Discoverer BI toolset

A Discoverer List of Worksheets portlet contains links to Discoverer worksheets. When you click a link in a List of Worksheets portlet, you open the selected worksheet in Discoverer Viewer.
In the figure below, the List of Worksheets portlet called Discoverer contains links to worksheets in the Video Tutorial Workbook (e.g. Tabular Layout, Crosstab Layout).
For more information, see "How to add a Discoverer List of Worksheets portlet".
A Discoverer Worksheet portlet can contain a Discoverer worksheet and graph, as follows:
for worksheets containing relational data, a Worksheet portlet can contain either a worksheet only, a worksheet and graph, or a graph only
for worksheets containing multidimensional data, a Worksheet portlet contains a worksheet and graph
A link can be provided in the portlet called Analyze Worksheet, which enables users to open the worksheet in Discoverer Viewer for more detailed analysis (e.g. drill, pivot).
In the figure below, the worksheet portlet called Video Tutorial Workbook - Crosstab Layout contains a Discoverer worksheet for analyzing profit figures for regions over time.
For more information, see "How to add a Discoverer Worksheet portlet".
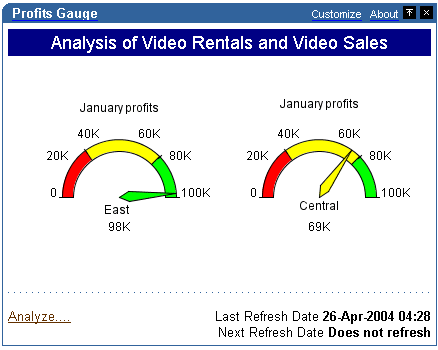
A Discoverer Gauges portlet contains Discoverer worksheet data displayed as one or more semi-circular gauges. The gauges have a similar appearance to a speedometer.
Note: Discoverer Gauges portlets can only be created for crosstab worksheets.
A gauge is a type of visualization used for presenting data within a range of values. A needle indicator might present a value in relation to low, acceptable, and high thresholds. The value ranges reflect key performance indicators (KPIs) for a business. Gauges are commonly used in dashboard applications.
A link can be provided in the portlet called Analyze Worksheet, which enables users to open the worksheet in Discoverer Viewer for more detailed analysis (e.g. drill, pivot).
The figure below shows a Discoverer Gauges portlet that contains two gauges that display monthly profit sum values for East and Central regions.
Figure 21-6 Discoverer Gauges portlet displayed in an OracleAS Portal page

For more information, see "How to add a Discoverer Gauges portlet".