|
Oracle® Application Server Performance Guide
10g Release 2 (10.1.2) B14001-02 |
|
 Previous |
 Next |
|
Oracle® Application Server Performance Guide
10g Release 2 (10.1.2) B14001-02 |
|
 Previous |
 Next |
This chapter discusses how cp to monitor Oracle HTTP Server performance. Obtaining performance data can assist you in tuning Oracle Application Server or in tuning and debugging applications with performance problems.
This chapter covers the following topics:
Monitoring Oracle HTTP Server with Application Server Control Console
Monitoring Oracle HTTP Server with Built-in Performance Metrics
The Oracle HTTP Server is a central and important part of most Oracle Application Server sites. Oracle HTTP Server handles nearly every request for dynamic data and many static data requests as well. By monitoring Oracle HTTP Server performance you can identify and fix Oracle Application Server performance issues.
This section covers the following topics:
Assessing the Oracle HTTP Server Load with Application Server Control Console
Investigating Oracle HTTP Server Errors with Application Server Control Console
Categorizing Oracle HTTP Server Problems with Application Server Control Console
While Application Server Control Console provides standalone management for an Application Server and its components, you can centrally manage all your Application Servers through one tool rather than through several Application Server Control Consoles by using the Oracle Enterprise Manager 10g Grid Control Console.
To monitor Oracle HTTP Server performance, the first step is to assess the workload (load).
When assessing the Oracle HTTP Server load, note the following:
If you are developing or testing a new application, you need to determine how much load your quality assurance and performance tests generate on Oracle HTTP Server.
If you are monitoring Oracle HTTP Server performance, note that usage often fluctuates depending on the time of day or day of week, with sites experiencing times with light loads, and times with heavy loads. Your performance tests and performance baseline should take into account the effect of time of day and day of week variances. Whether you are developing or administering an Oracle Application Server site, you should always design for expected load ranges and monitor the site to ensure that usage and performance remains within the expected range. You can use dmstool for periodic system monitoring.
The Oracle HTTP Server performance information provides a picture of overall site performance; however if Oracle Application Server Web Cache or other caching mechanisms handle requests before they reach Oracle HTTP Server, then you need to monitor the caches as well.
Application Server Control Console provides Oracle HTTP Server performance data in the following categories:
|
See Also:
|
The Application Server Control Console status metrics provide information on CPU usage, memory usage, Oracle HTTP Server errors, and the number of active connections.
Figure 3-1 shows the Application Server Control Console HTTP Server status metrics page.
Figure 3-1 Application Server Control Console Status Metrics Page
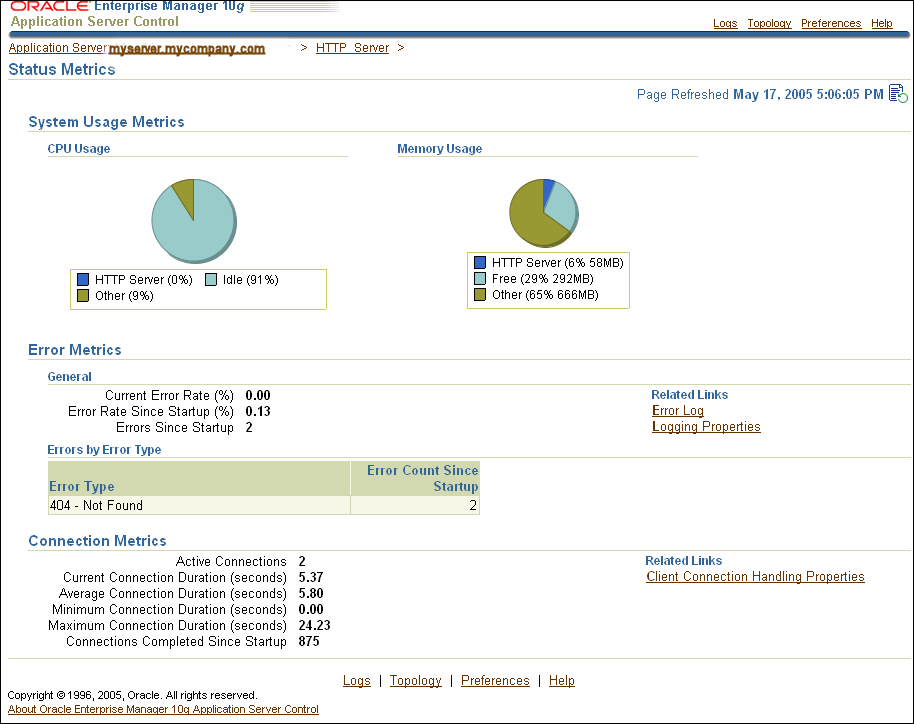
Figure 3-2 shows the Application Server Control Console Response and Load Metrics page. This page shows values for Oracle HTTP Server Active Requests and Request Throughput, and reports the average, minimum, and maximum processing time for requests. The values on the Response and Load Metrics page can help you assess the system load.
Figure 3-2 Application Server Control Console Response and Load Metrics
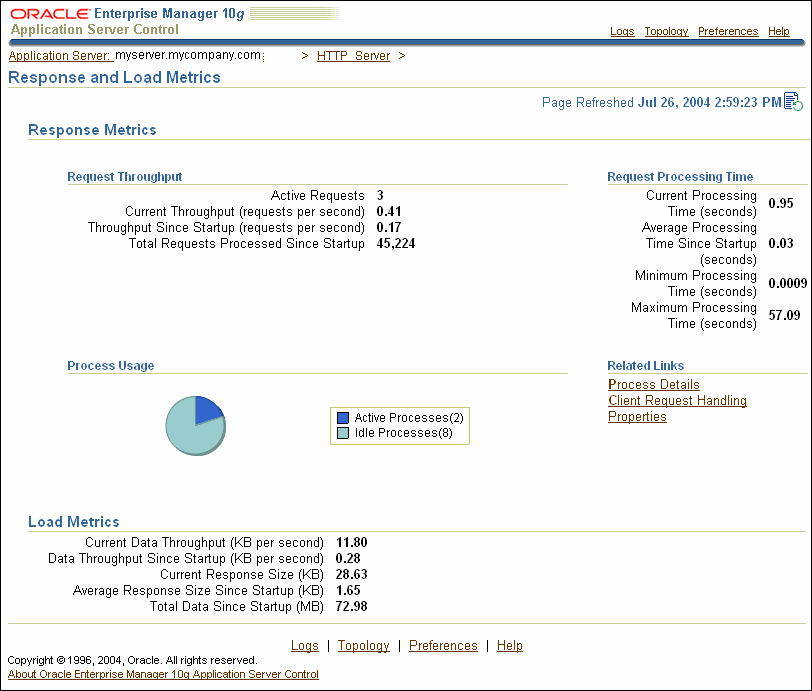
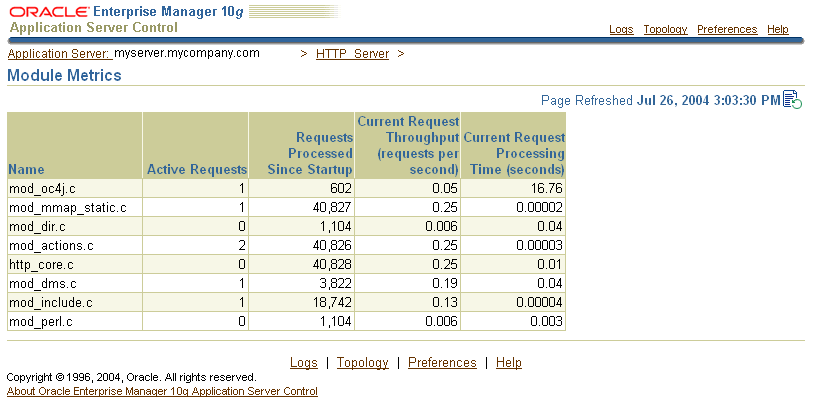
Figure 3-3 shows the Application Server Control Console Module Metrics page. The Module Metrics page shows the active and total requests processed by Oracle HTTP Server modules. The page only lists modules active since startup, meaning that the module has received 1 or more requests.
Figure 3-3 Application Server Control Console Module Metrics Page
The Error Log link displays the Application Server Control Console View Logs page and selects the HTTP Server logs.
|
See Also: Oracle Application Server Administrator's Guide for information on working with the View Logs page |
You should thoroughly investigate Oracle HTTP Server errors occurring on your site. Oracle HTTP Server errors may indicate acceptable activity, but they may also indicate security problems, configuration errors, or application bugs. Errors almost always affect Oracle Application Server performance. Error handling can slow down the normal processing for requests, or can appear to improve performance when the error handling abbreviates the processing required to handle a valid request.
Using Application Server Control Console you can view the Error Metrics on the HTTP Status Metrics page, as shown in Figure 3-1. Error Metrics include the current error rate, which is the number of errors occurring in approximately the last five minutes as a percentage of the total requests, the error rate since startup, and the count of the total number of errors since startup. The Status Metrics page includes the Errors by Error Type table shown in Figure 3-1 which lists more details for HTTP errors, including the error types and error counts. This table breaks down each error into a category based on its HTTP error response type.
The data values shown for Errors by Error Type in Figure 3-1 indicate that the errors were due to requests for unknown URIs (404 - Not Found errors). On many Oracle HTTP Server sites, Not Found errors are relatively common. However, you should investigate reports showing large numbers of Not Found errors, such as a number that is greater than 1% of the total requests (see Figure 3-2 to find the total requests processed in the Request Throughput area on the Response and Load Metrics page).
To investigate errors in more detail, such as any reported internal errors, examine the error log by selecting the Logs link from any page, or the Error Log link under the Related Links heading on the Status Metrics page. By examining the error log file entries, you should be able to find more information about the URIs that are causing specific errors.
|
See Also: Oracle Application Server Administrator's Guide for information on working with the View Logs page |
Certain Oracle HTTP Server errors and warnings are expected during normal Oracle Application Server operations. For example, errors and warnings occur when the OC4J instance is stopped or restarted when you perform certain configuration actions using Application Server Control Console.
Example 3-1 shows some of the types of errors that you may see during an OC4J restart operation.
Example 3-1 Expected Errors Occurring During OC4J Restart Operation
MOD_OC4J_0150: Failed to deterministicly find a failover oc4j process for session request for island: default_island for destination: home.
MOD_OC4J_0119: Failed to get an oc4j process for destination: home
MOD_OC4J_0013: Failed to call destination: home's service() to service the request.
MOD_OC4J_0150: Failed to deterministicly find a failover oc4j process for session request for island: default_island for destination: home.
.
.
.
MOD_OC4J_0119: Failed to get an oc4j process for destination: home
MOD_OC4J_0013: Failed to call destination: home's service() to service the request.
MOD_OC4J_0150: Failed to deterministicly find a failover oc4j process for session request for island: default_island for destination: home.
MOD_OC4J_0119: Failed to get an oc4j process for destination: home
MOD_OC4J_0013: Failed to call destination: home's service() to service the request.
(131)Connection reset by peer: MOD_OC4J_0086: Got an unexpected error while calling recv() to receive a message from oc4j and error code is 131.
MOD_OC4J_0054: Failed to call network routine to receive an ajp13 message from oc4j.
MOD_OC4J_0033: Failed to receive an ajp13 message from oc4j.
(131)Connection reset by peer: MOD_OC4J_0086: Got an unexpected error while calling recv() to receive a message from oc4j and error code is 131.
MOD_OC4J_0054: Failed to call network routine to receive an ajp13 message from oc4j.
MOD_OC4J_0033: Failed to receive an ajp13 message from oc4j.
If you notice a performance problem on the Oracle HTTP Server, then if possible you should drill down and categorize the problem. By refining the performance analysis you can learn more about the issue and direct your efforts to a component to help identify and resolve the problem.
Application Server Control Console can help you categorize performance problems. You can identify where requests are being processed, or where a large percentage of request processing time is concentrated. Using Application Server Control Console allows you to categorize performance problems as follows:
Figure 3-3 shows the Module Metrics for Oracle HTTP Server modules (the report includes information for modules that have received 1 or more requests since startup). Using the Module Metrics, you should be able to identify the name of the module that processed a large number of requests, or identify a module where the processing time for an individual request is very large. By looking at the values for metrics listed in the Module Metrics table, you should be able to categorize Oracle Application Server performance by module.
When viewing the Module Metrics, note the following:
The http_core.c module handles every request for static pages. If Oracle Application Server Web Cache is enabled, then use of http_core.c should be reduced. When you are using Oracle Application Server Web Cache, you should monitor requests processed by the http_core.c module to make sure that Oracle Application Server Web Cache effectively reduces static page activity for the Oracle HTTP Server.
Viewing the Module Metrics page may show you that many requests were processed through the mod_oc4j.c module. You should then drill down to review the information available for your OC4J instances. Application Server Control Console provides extensive performance measurements for OC4J instances and J2EE applications.
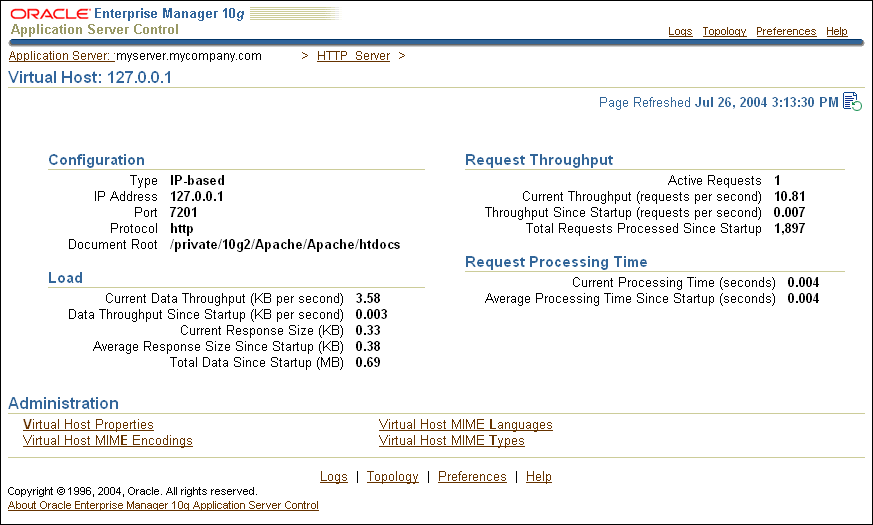
Figure 3-4 shows a display of the Virtual Host page. By viewing the Virtual Host page you should be able to obtain information about request processing by virtual host. The Request Throughput, Load, and Request Processing Time headings include information that enables you to identify a virtual host on your system that is processing a large number of requests, or that is using significant processing resources and may be stressing the system. This information should help you to categorize Oracle Application Server performance issues by virtual host.
Figure 3-4 Application Server Control Console Virtual Host Page
Running Oracle HTTP Server, usually you do not need to worry about which child server handles an individual request because any available child server can handle any incoming request (each request is handled by a free child server). However, if your Oracle Application Server system experiences delays or deadlocks, you may need to analyze the Oracle HTTP Server child server processes.
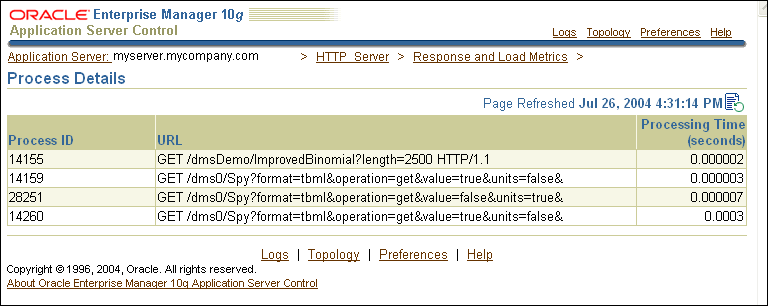
To obtain information on Oracle HTTP Server child server processes, select Response and Load Metrics link from the HTTP Server page, and then, under Related Links, select Process Details (on Windows systems this is Thread Details). The Process Details page shows the Process ID for each active Oracle HTTP Server child process.
On UNIX systems, viewing the Process Details page allows you to monitor child servers to identify runtime problems, configuration errors, or application bugs that cause either request processing deadlocks or very long delays. In these situations analyzing the Process Details page can help determine where the deadlock or delay is occurring.
Figure 3-5 shows a Process Details page with Oracle HTTP Server child server information.
When viewing the Oracle HTTP Server Process Details page, note the following:
If necessary you can use the Process ID value to identify and terminate a deadlocked Oracle HTTP Server child server.
Oracle HTTP Server terminates requests after a configurable timeout. You can use Application Server Control Console to set the timeout for requests.
Figure 3-5 Application Server Control Console HTTP Server Process Details for Child Servers Page
The Oracle HTTP Server is a central and important part of most Oracle Application Server sites. Oracle HTTP Server handles nearly every request for dynamic data and many static data requests as well. By monitoring Oracle HTTP Server performance, you can identify and fix Oracle Application Server performance issues.
This section covers the following topics:
Investigating Oracle HTTP Server Errors with Built-in Metrics
Categorizing Oracle HTTP Server Performance Problems with Built-in Metrics
To monitor Oracle HTTP Server performance, the first step is to assess workload.
When assessing the Oracle HTTP Server workload (load), note the following:
If you are developing or testing a new application, you need to determine how much load your quality assurance and performance tests generate on Oracle HTTP Server.
If you are monitoring Oracle HTTP Server performance, note that usage often fluctuates depending on the time of day or day of week, with sites experiencing times with light loads, and times with heavy loads. Your performance tests and performance baseline should take into account the effect of time of day and day of week variances. Whether you are developing or administering an Oracle Application Server site, you should always design for expected load ranges and monitor the site to ensure that usage and performance remains within the expected range.
The Oracle HTTP Server performance metrics give a good picture of overall site performance; however if Oracle Application Server Web Cache or other caching mechanisms handle requests before they reach Oracle HTTP Server, then you need to monitor the caches as well.
Oracle HTTP Server provides performance metrics which you can view using AggreSpy or dmstool. You can use these built-in performance tools to help you assess Oracle HTTP Server load by viewing the ohs_server metric table. Using AggreSpy or dmstool, you can view the ohs_server metric table.
Example 3-2 shows the dmstool command with the ohs_server metrics output. You can also view the ohs_server metric table using AggreSpy by choosing the ohs_server metric table in the left pane of the AggreSpy window or by selecting the Text link next to the Apache process in the AggreSpy All DMS Spies list. If you select the Apache process from the Spies List, you need to find the ohs_server table within the full set of metrics shown.
Example 3-2 Overall HTTP Server Metrics Report
system1 122> dmstool -table ohs_server Fri May 02 11:11:39 PDT 2003
----------
ohs_server
----------
busyChildren.value:     1
childFinish.count:      0       ops
childStart.count:      11       ops
connection.active:3 threads
connection.avg:258721053 usecs
connection.completed:   11880   ops
connection.maxTime:1002008298 usecs
connection.minTime:7254 usecs
connection.time:152386700540 usecs
error.count:    52       ops
get.count:      32769   ops
handle.active:2 threads
handle.avg:14274 usecs
handle.completed:6985
handle.maxTime:22205524 usecs
handle.minTime:2 usecs
handle.time:997159521 usecs
internalRedirect.count: 7418   ops
lastConfigChange.value: 1051724112
numChildren.value:      11
numMods.value:  47
post.count:     0       ops
readyChildren.value:    10
request.active: 1       threads
request.avg:31537 usecs
request.completed:32769
request.maxTime:22206941 usecs
request.minTime:602 usecs
request.time:1033442848 usecs
responseSize.value:     243880796
Host:   system1
Name:   Apache
Parent: /
Process:        Apache:27885:6004
First, to analyze system performance, the output shown in Example 3-2 includes three categories of metrics to be inspected: handle, request, and connection. These metrics describe the following:
handle
The phase in which a request is handled by an HTTP server module. Note that a single request may be handled by more than one HTTP server module. The handle metrics shown in the ohs_server metric table are summarized for all of the HTTP server modules.
request
The phase during which an HTTP server daemon reads a request and sends a response for it (first byte in, last byte out). There may be more than one request serviced during a single connection phase. This would be the case if the HTTP parameter KeepAlive were set and utilized by clients.
connection
The connection phase, starting from the time an HTTP connection is established to the time it is closed.
Second, to determine current Oracle HTTP Server load, examine the following ohs_server metrics:
request.active
busyChildren.value
readyChildren.value
numChildren.value
These ohs_server metrics indicate how many OHS child servers, children, are in use, and how many of child servers are actively processing requests. The data in Example 3-2 shows that 11 child servers are alive (numChildren.value), one of which is currently busy handling requests (busyChildren.value).
Oracle HTTP Server needs to keep enough child servers running to handle the usual load while allowing for normal load fluctuations. Oracle HTTP Server child servers handle exactly one request at a time, thus Oracle HTTP Server needs to run many child servers at once. If Oracle HTTP Server notices that the current load may exceed its default configuration, then it automatically starts new child servers. If the load is subsequently reduced, then Oracle HTTP Server terminates some of its child servers to save system resources.
If the configuration settings require that the Oracle HTTP Server start and stop child servers frequently, this can reduce system performance and may indicate that the system configuration needs to be adjusted. To determine whether Oracle HTTP Server child servers have been started and how many have finished, examine the following ohs_server metrics:
childStart.count
childFinish.count
These performance metrics show how many Oracle HTTP Server child servers have started and finished and can also provide an indication of the Oracle HTTP Server load. For the Oracle HTTP Server shown in Example 3-2, 11 child servers have started and 0 have finished.
The childStart.count and childFinish.count metric values could indicate that the instantaneous load for the Oracle HTTP Server exceeded the current load and also exceeded the range assumed by the default Oracle HTTP Server configuration parameters. When the count of child servers started and the count of child servers finished are both large, this could indicate that the Oracle HTTP Server could benefit by tuning configuration parameters, including:
MinSpareServers
MaxSpareServers
StartServers
In the ohs_server metrics, the handle.avg, request.avg, and connection.avg metrics, and the handle.time, request.time, and connection.time values increase for each phase. The handle time will be the shortest and the connection time the longest. Figure 3-6 shows the relationship among these three phases for managing a user request.
If KeepAlive is on and clients use it, the duration of a connection may be much longer than the time required to perform a request and return a response, as illustrated in Figure 3-6. This is because the connection may remain open while a single client submits multiple requests.
Figure 3-6 Execution Phases in the Oracle HTTP Server

|
See Also:
|
You should thoroughly investigate Oracle HTTP Server errors occurring on your site. Oracle HTTP Server errors may indicate acceptable activity, but they may also indicate security problems, configuration errors, or application bugs. Errors almost always affect Oracle Application Server performance. Error handling can slow down the normal processing for requests, or can appear to improve performance when the error handling abbreviates the processing required to handle a valid request.
Using dmstool or AggreSpy, you can investigate Oracle HTTP Server errors by viewing the ohs_server metrics. Example 3-2 includes the ohs_server metrics that provide an overview of error activity. The error.count metric increments whenever any request to Oracle HTTP Server results in an HTTP error response.
Use the ohs_responses metric table to investigate the details for error types and error counts. This table breaks down the total error.count value into HTTP response types. It also shows aggregate counts for successful HTTP requests and HTTP redirects.
Example 3-3 shows the dmstool report for the ohs_responses metric table. You can also view the ohs_responses metric table using AggreSpy by choosing the ohs_responses metric table in the left pane of the AggreSpy window or by selecting the Text link next to the Apache process in All DMS Spies list. If you select the Apache process from the Spies List, you need to find the ohs_responses table within the full set of metrics shown.
Example 3-3 HTTP Server Responses Metrics (ohs_responses Metric Table)
system1 125> dmstool -table ohs_responses

Fri May 02 15:19:56 PDT 2003
-------------
ohs_responses
-------------
CltErr_Authorization_Required_401.count:        0       ops
CltErr_BadRange_416.count:      0       ops
.
.
.
CltErr_Not_Found_404.count:     29      ops
.
.
.
Redirect_MultiChoice_300.count: 0       ops
Redirect_NotModified_304.count: 23      ops
Success_Accepted_202.count:     0       ops
.
.
.
SvrErr_VersionNotSupp_505.count:        0       ops
Host:   system1
Name:   Responses
Parent: /Apache
Process:        Apache:27885:6004
ohs_server:     Apache
Example 3-3 shows that most of the errors were due to requests for unknown URIs (404 - Not Found errors). On many Oracle HTTP Server sites, Not Found errors are relatively common. However, you should investigate reports showing many Not Found errors, such as a number greater than 1% of the total requests.
You can examine the error_log and access_log files to determine the URIs that are causing errors, such as any reported internal errors (SvrErr_InternalError_500.count).
|
See Also:
|
If you notice a performance problem on the Oracle HTTP Server, then if possible you should drill down and categorize the problem. By limiting your search for a performance problem to a subset of Oracle HTTP Server, you can learn more about the issue and direct your efforts to identifying and solving the problem. Using the built-in performance tools you can categorize performance problems into one of several areas. You can identify where requests are being processed, or where a large percentage of request processing time is concentrated.
This section describes how you can categorize performance problems into different areas, including:
Categorizing Oracle HTTP Server Performance Problems by Module
Categorizing Oracle HTTP Server Performance Problems by Virtual Host
Categorizing Oracle HTTP Server Performance Problems by Child Server
Use the ohs_module metrics to refine your analysis of performance problems to one or more modules. Showing the module metrics allows you to use the metric data to limit the search for performance problems to a particular module.
Example 3-4 shows a section of the dmstool report for the ohs_module metric table. You can also view the ohs_module metric table using AggreSpy by choosing the ohs_module link in the left pane of the AggreSpy window or by selecting the Text link next to the Apache process in the All DMS Spies list. If you select the Apache process from the Spies List, you need to find the ohs_module table within the full set of metrics shown.
Example 3-4 Drill Down to Investigate Oracle HTTP Server Activity per Module
system1 127> dmstool -table ohs_module -c 1
Fri May 02 15:51:01 PDT 2003
----------
ohs_module
----------
decline.count:  76661   ops
handle.active:  0       threads
handle.avg:     13      usecs
handle.completed:       76661   ops
handle.maxTime: 5487    usecs
handle.minTime: 11      usecs
handle.time:    1007639 usecs
Host:   system1
Name:   mod_actions.c
Parent: /Apache/Modules
Process:        Apache:27885:6004
ohs_server:     Apache
.
.
.
Name:   mod_plsql.c
.
.
.
decline.count:  0       ops
handle.active:  0       threads
handle.avg:     919     usecs
handle.completed:       76708   ops
handle.maxTime: 122401  usecs
handle.minTime: 351     usecs
handle.time:    70532228        usecs
Host:   system1
Name:   http_core.c
Parent: /Apache/Modules
Process:        Apache:27885:6004
ohs_server:     Apache
.
.
.
decline.count:  0       ops
handle.active:  0       threads
handle.avg:     331918  usecs
handle.completed:       440     ops
handle.maxTime: 42707927        usecs
handle.minTime: 5970    usecs
handle.time:    146044090       usecs
Host:   system1
Name:   mod_oc4j.c
Parent: /Apache/Modules
Process:        Apache:27885:6004
ohs_server:     Apache
When viewing the Module Metrics, note the following:
The http_core.c module handles every request for static pages. If Oracle Application Server Web Cache is enabled, then use of http_core.c should be reduced. If Oracle Application Server Web Cache is enabled then you should monitor the http_core.c metrics to make sure that Oracle Application Server Web Cache effectively prevents static page activity from reaching your Oracle HTTP Server.
Typically, certain responses require process initialization, class loading or other one-time processing that can skew the reporting of the average request processing time. For performance reporting and analysis, you can reduce the effect of the such one-time operations by subtracting the minimum and maximum values from the total and recalculating the average. For example, for the mod_oc4j.c metrics shown in Example 3-4, if you recompute the request handling average using the following formula, you find that the recalculated average provides a more representative indication of typical response processing time:
new average = (time - min - max) / (completed - 2)
            = (146044090 - 5970 - 42707927)/ (440 - 2)
            =   305710.6 microseconds
Recalculating the average is most important when the server has been up for a short time, and thus has handled a small number of requests. In this case, the large overhead of the first request will have far more impact on the average.
Viewing the ohs_module metric table may show you that many requests were forwarded to OC4J through the mod_oc4j.c module. Oracle Application Server also provides extensive performance measurements for OC4J J2EE applications.
Use the ohs_virtualHost metrics to refine your analysis of performance problems by Oracle HTTP Server virtual host. Showing the virtual host metrics allows you to use the metric data to limit the search for performance problems to a subset of the Oracle HTTP Server.
Example 3-5 shows a section of the dmstool report for the ohs_virtualHost metric table. You can also view the ohs_virtualHost metric table using AggreSpy by choosing the ohs_virtualHost link in the left pane of the AggreSpy window or by selecting the Text link next to the Apache process in the All DMS Spies list. If you select the Apache process from the Spies List, you need to find the ohs_virtualHost table within the full set of metrics shown.
Example 3-5 Drill Down to Investigate Oracle HTTP Server Activity per Virtual Host
system1 134> dmstool -table ohs_virtualHost -c 1
Mon May 05 10:35:10 PDT 2003
---------------
ohs_virtualHost
---------------
request.active: 0       threads
request.avg:    0       usecs
request.completed:      0       ops
request.maxTime:        0       usecs
request.minTime:        0       usecs
request.time:   0       usecs
responseSize.value:     0       bytes
vhostType.value:        IP_DEFAULT
Host:   system1
Name:   system1.us.oracle.com:IP255.255.255.255,Port4444
Parent: /Apache/VHosts
Process:        Apache:27885:6004
ohs_server:     Apache
ohs_vhostSet:   VHosts
Running Oracle HTTP Server, usually you do not need to worry about which child server handles an individual request because any available child server can handle any incoming request (each request is handled by a free child server). However, if your Oracle Application Server system experiences delays or deadlocks, you may need to analyze the Oracle HTTP Server child server metrics. These metrics allow you to monitor child servers to identify runtime problems, configuration errors, or application bugs that cause either request processing deadlocks or very long delays. In these situations analyzing the Oracle HTTP Server child server metrics can help determine where the deadlock or delay is occurring.
Use the ohs_child metric table to refine your analysis of performance problems to one or more Oracle HTTP Server child servers.
Example 3-6 shows a section of the dmstool report for the ohs_child metric table. You can also view the ohs_child metric table using AggreSpy by choosing the ohs_child link in the left pane of the AggreSpy window or by selecting the Text link next to the Apache process in the All DMS Spies list. If you select the Apache process from the Spies List, you need to find the ohs_child table within the full set of metrics shown
The ohs_child metric table shows the top ten Oracle HTTP Server child servers sorted by time spent on current requests. For the metrics shown in Example 3-6, the top entry has been executing for 7 microseconds. The ohs_child metrics include the URL associated with the request and the process identifier for each Oracle HTTP Server child server listed.
Example 3-6 Drill Down to Investigate Activity per Child Server
system1 135> dmstool -table ohs_child -c 1
Mon May 05 10:44:24 PDT 2003
userpasswd=null
---------
ohs_child
---------
.
.
.
pid.value:      27897
slot.value:     3
status.value:   writing
time.value:     1       usecs
url.value:      GET /dms0/Spy?format=tbml&operation=get&value=true&units=true&d
Host:   system1
Name:   Child01
Parent: /Apache/Children
Process:        Apache:27885:6004
ohs_server:     Apache
pid.value:      27899
slot.value:     5
status.value:   keepalive
time.value:     7       usecs
url.value:      GET /dmsDemo/BasicBinomial HTTP/1.1
Host:   system1
Name:   Child00
Parent: /Apache/Children
Process:        Apache:27885:6004
ohs_server:     Apache
When viewing the Oracle HTTP Server child server metrics, note the following:
If necessary you can use the ohs_child metric value pid.value to identify and terminate a deadlocked Oracle HTTP Server child server.
Oracle HTTP Server terminates requests after a configurable timeout set with the TimeOut directive.