11
Building a Two-Query Group Report
Figure 11-1 Group above report output, two queries
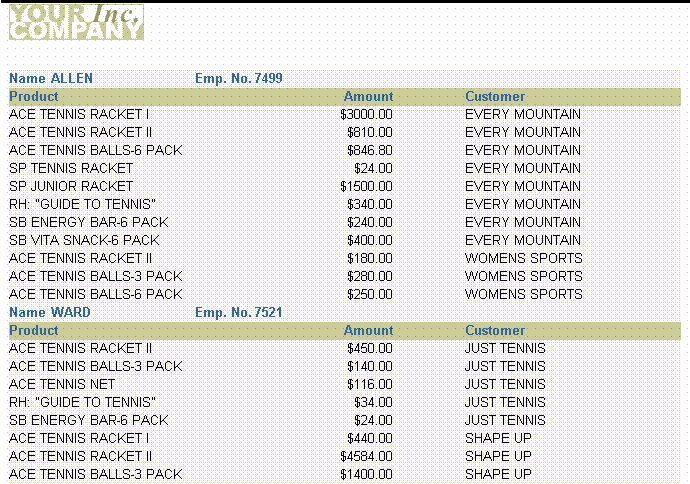
Text description of the illustration grp_abv2_fin.gif
As you can see above, a two-query group report appears much the same as a single-query group report. Performance is the key issue when contrasting single-query and multiple-query group reports. In most cases, single-query reports will run faster than multiple-query reports. The multiple-query reports are, however, sometimes easier to understand conceptually and easier to maintain. For example, if you are in a situation where only a few users run the report and the report returns a relatively small number of records, you might want to use multiple queries to simplify maintenance and make the data model easier to understand. If you have many users and the report is quite large, then you should try to use a single-query report.
Concepts
- The single and multiple-query group reports look the same but have different data models. A single-query report has multiple groups underneath one query, while a multiple-query report uses one group underneath each of several queries. In the single-query case, the relationship is established by the hierarchy of groups underneath the query. In the multiple-query case, the relationship is established by data links between the groups of different queries.
- A data link is a data model object that enables you to relate multiple queries. For a simple group report, you relate the two queries using the primary and foreign keys of the tables from which you are selecting data.
- A primary key is a column for which each value uniquely identifies the record in which it is found. A foreign key is a column which contains the same values as the primary key for another table, and is used to reference records in that table.
- Linking two tables via primary and foreign keys is similar to specifying a join condition. In fact, the data link causes Reports Builder to create a SQL clause defining a join, based on information specified when creating the link. This clause is added to the child query's SELECT statement at run time.
- The join defined by a default data link is an outer join--in addition to returning all rows that satisfy the link's condition, an outer join returns all rows from one table that do not match a row from the second table.
- This report uses a default group above layout style in which master records display across the page with the labels to the left of their fields and the detail records appear below the master records in standard tabular format.
- You'll deselect one default column to keep it from appearing in the report, change some field widths to ensure the fields fit across the page, and format one of the fields.
- You will also specify a maximum of 1 master record per page to ensure that only one master record and its associated detail records are displayed per page of report output.
Example Scenario
Suppose that you want to create a group above report that lists employees with their jobs and salaries by department.
To see a sample group above report with two queries, open the examples folder named masterdetail, then open the Oracle Reports example named grp_abv2.rdf. For details on how to access it, see "Accessing the example reports" in the Preface.
Table 11-1 Features demonstrated in this example
11.1 Prerequisites for this example
To build the example in this chapter, you must have access to the Summit Sporting Goods schema, which we've provided on the Oracle Technology Network (http://otn.oracle.com/products/reports/). To download the SQL scripts that install the schema, go to the Documentation page on OTN and follow the instructions provided on the Web page.
11.2 Create a new report manually
In this case, it is easier to create the data model and layout separately. Hence, we will create an empty report first, then add the queries, and then create the layouts.
To create a blank report:
- Launch Reports Builder (or, if already open, choose File > New > Report)
- In the Welcome or New Report dialog box, select Build a new report manually, then click OK.
11.3 Create a data model with a data link
When you create a report with multiple queries, it is typically easier to create all of the queries with the Data Wizard first and then create the layouts with the Report Wizard.
To create the queries:
- In the Data Model view, choose Insert > Query to display the Data Wizard.
- If the Welcome page displays, click Next.
- On the Query page, type
Q_Salesrep for the Query name and click Next.
- On the Data Source page, click SQL Query, then click Next.
- On the Data page, in the Data Source definition field, enter the following SELECT statement:
SELECT ENAME, EMPNO
FROM EMP
WHERE JOB = 'SALESMAN'
Note:
You can enter this query in any of the following ways:
- Copy and paste the code from the provided text file called g
rp_abv2_code.txt into the Data Source definition field.
- Click Query Builder to build the query without entering any code manually.
- Type the code in the Data Source definition field.
|
Click Next.
Note:
If you are not already connected to a database, you will be prompted to connect to the database when you click Next. Ensure that you connect to a database that has the appropriate schema for this example. Section 11.1, "Prerequisites for this example" describes the sample schema requirements for this example.
|
- On the Groups page, click Next.
- Click Finish to display the data model for your report in the Data Model view.
- Repeat the steps above for a second query, but this time name your query
Q_Product and use the following SELECT statement:
SELECT REPID, PRODNAME, AMOUNT, CUSTNAME
FROM SALES
ORDER BY REPID, CUSTNAME
Figure 11-2 Two-query data model without a link
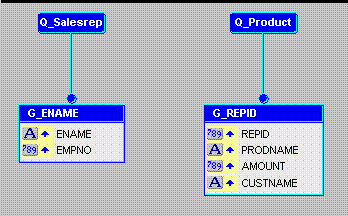
Text description of the illustration grp_abv2_dm_nolink.gif
To add the data link
- In the Data Model view, click the Data Link tool in the tool palette.
- Click and drag from the EMPNO column in the G_ENAME group to the REPID column in the G_REPID group. Notice that a line is drawn from the bottom of the G_ENAME group to the Q_Product query. Labels for EMPNO and REPID are created at each end of the line to indicate they are the columns linking G_ENAME to Q_Product.
Figure 11-3 Two-query data model with a data link
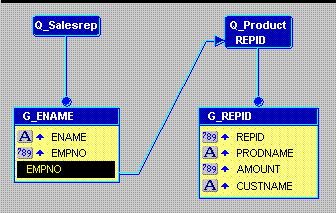
Text description of the illustration grp_abv2_dm_link.gif
- Double-click the new data link line to display the Property Inspector and examine the property settings:
- G_ENAME is identified as the parent, while Q_Product is listed as the child. In terms of the data, the sales rep's name and employee number make up the master record and should print once for the associated product information retrieved by the Q_Product query.
- Notice that WHERE already appears in the SQL Clause property. WHERE is the default clause used in master/detail relationships. You can replace WHERE with other SQL clauses such as HAVING and START WITH, but for this report the default is correct.
- The other point to notice is that an equal sign (=) appears in the Condition property. An equality (i.e., table1.columnname = table2.columnname) is the default condition for master/detail relationships defined via a data link. You can replace the equal sign with any other supported conditional operator (to see what's supported, click on the field), but for this report the default is the proper condition.
Linking the group G_ENAME and the query Q_Product via the EMPNO and REPID columns is analogous to writing both queries as the single-query shown below:
SELECT ENAME, EMPNO, REPID,
PRODNAME, AMOUNT, CUSTNAME
FROM EMP, SALES
WHERE JOB = 'SALESMAN'
AND EMPNO = REPID (+)
ORDER BY REPID, CUSTNAME
11.4 Use the Report Wizard to layout the data
Once your data model is complete, you need to create a layout for the data objects to display in the report output. The Report Wizard enables you to create layouts for your data model.
|
Tip:
When you have multiple queries in your data model, make sure that you check the names of the groups associated with each query prior to entering the Report Wizard. The Report Wizard requires you to choose data for the layout by group name.
|
To create the layout:
- In the Data Model view, right-click on the canvas, then choose Report Wizard.
- In the Report Wizard, on the Report Type page, select Create Paper Layout only.
- On the Style page, select Group Above.
- On the Groups page, ensure that both groups from your data model appear in the Displayed Groups list.
- On the Fields page:
- Click the double right arrows (>>) to move all of the fields to the Displayed Fields list.
- Click REPID in the Displayed Fields list and click the left arrow (<) to move it back to the Available Fields list. Since REPID and EMPNO represent the same value, you only need to display one of them. EMPNO is part of the master group, which is the level where we want to see its values in the report. REPID is part of the detail group. Hence, you remove REPID from the Displayed Fields list to prevent it from appearing in the output.
Figure 11-4 Fields page of the Report Wizard
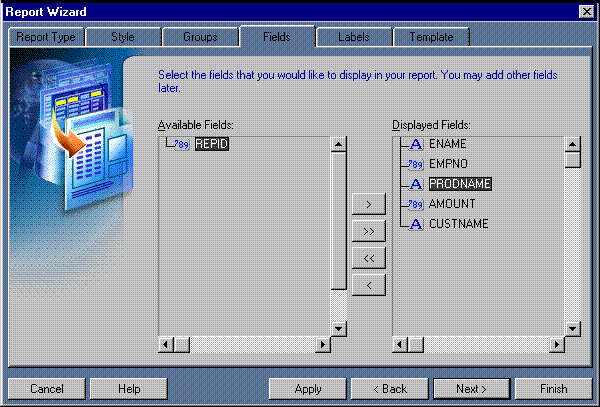
Text description of the illustration grp_abv2_coldisp.gif
- On the Labels page, change the labels and field widths as follows:
Table 11-2 Field description of Lables page
- On the Template page, make sure Beige is selected under Predefined Template, then click Finish to display your report output in the Paper Design view. It should look like this:
Figure 11-5 Paper Design view for the two-query group report
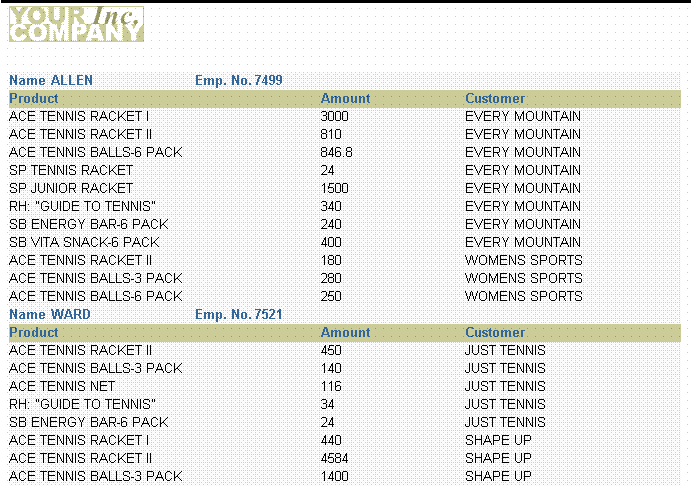
Text description of the illustration grp_abv2_out1.gif
11.5 Format a field
In the Paper Design view, notice the Amount field. The values are neither aligned nor displayed as monetary amounts. You can quickly rectify this in the Paper Design view.
To assign a format mask to monetary values:
- In the Paper Design view, select the first number value underneath the Amount label. Notice that all of the values are immediately selected, indicating that you can change their properties simultaneously.
|
Tip:
If you are familiar with format mask syntax, you could now right click on the field values, choose Property Inspector, and choose or manually enter a value for the Format Mask property.
|
- Click the Currency button in the toolbar. A currency symbol immediately appears next to all of the values.
- Click the Add Decimal Place tool twice. Two decimal places are added to the right of the decimal point.
- Resize the field by clicking and dragging the rightmost handle of the field approximately a 0.5 inches to the left.
- Click the Align Right tool. All of the values are immediately right aligned.
- Select the Amount label.
- Click the Align Right tool.
- Save your report.
The final report output should look something like this:
Figure 11-6 Group above report output with monetary values formatted

Text description of the illustration grp_abv2_fin.gif
11.6 Summary
Congratulations! You have successfully created the two-query, group report. You now know how to:
- create queries with a data link between them in the Data Model view.
- layout the data with the Report Wizard.
- format a field in the Paper Design view.
For more information on any of the wizards, views, or properties used in this example, refer to the Reports Builder Online help, which you can access in two ways:


