13
Building a Group Left Summary Report
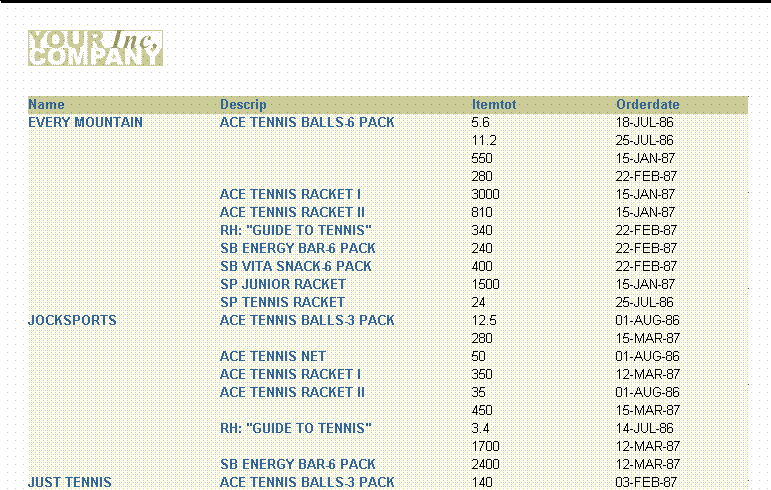
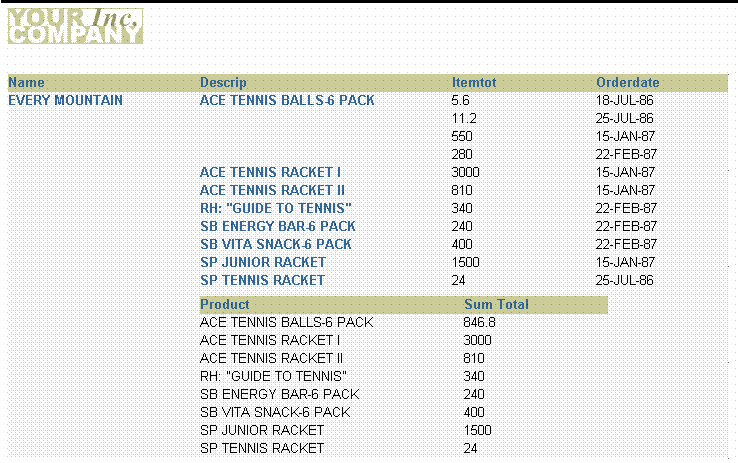
Figure 13-1 Group left summary report output
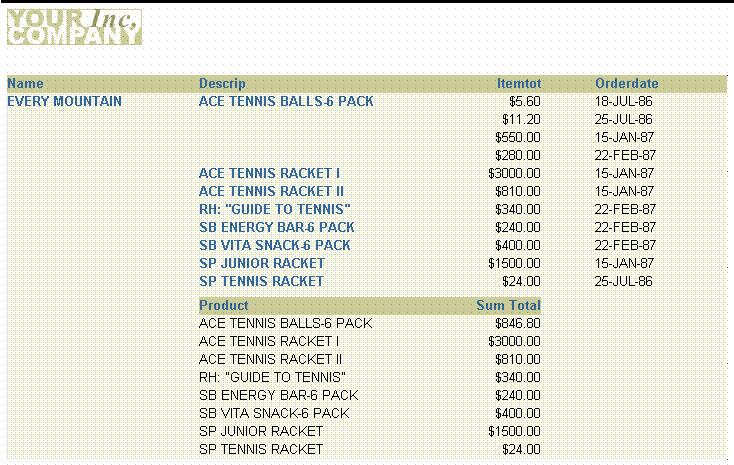
Text description of the illustration masdtmsb_fin.gif
This report consists of master records (Name, at the upper left of the figure above), detail records (Product, Itemtot, and Orderdate, to the upper right), and summary records (Product, and Sum Total). The summary calculates totals for the details under each master record. Notice that the column Product appears twice. With Reports Builder, you can display columns any number of times.
Concepts
- A master/detail summary report is a master/detail report that also contains one or more summaries.
- This report will use two queries to select data from four tables. The master query will select the customer name, while the detail query will select the information associated with the products ordered by each customer.
- Because the detail query will select data from several tables, you'll need to specify joins to link the information in the tables together.
- You'll drag a column out of the detail group to further group the data. You'll also create a summary column to calculate the item totals.
- The layout for this report is constructed in two parts. The top portion contains the master and detail information, and is created using the Report Wizard. The second portion is constructed by hand in the Paper Layout view and formats the summary.
- You'll also resize two groups in the Layout editor to ensure that the new, user-created bottom portion of the layout is integrated into the top portion, omit some columns from the layout that were queried only to join the tables, and include more space between instances of a repeating frame.
Example Scenario
Suppose that you want to create a report that displays and summarizes sales data by customer. This report would include the following for each customer:
- a list of the products they purchased by order date and how much they spent on each product
- a summary for each customer that shows how much they spent in total on each product over time
To see a sample master/detail summary report, open the examples folder named masterdetailsummary, then open the Oracle Reports example called masdtmb.rdf. For details on how to access it, see "Accessing the example reports" in the Preface.
Table 13-1 Features demonstrated in this example
13.1 Prerequisites for this example
To build the example in this chapter, you must have access to the Summit Sporting Goods schema, which we've provided on the Oracle Technology Network (http://otn.oracle.com/products/reports/). To download the SQL scripts that install the schema, go to the Documentation page on OTN and follow the instructions provided on the Web page.
13.2 Create a new report manually
In this case, it is easier to create the data model and layout separately. Hence, we will create an empty report first, then add the queries, and then create the layouts.
To create a blank report:
- Launch Reports Builder (or, if already open, choose File > New > Report)
- In the Welcome or New Report dialog box, select Build a new report manually, then click OK.
13.3 Create a data model with a data link
When you create a report with multiple queries, it is typically easier to create all of the queries with the Data Wizard first and then create the layouts with the Report Wizard.
To create the queries:
- In the Data Model view, choose Insert > Query to display the Data Wizard.
- If the Welcome page displays, click Next.
- On the Query page, type
Q_Customer for the Query name, then click Next.
- On the Data Source page, select SQL Query, then click Next.
- On the Data page, in the Data Source definition field, enter the following SELECT statement:
SELECT CUSTID, NAME
FROM CUSTOMER
ORDER BY NAME
Note:
You can enter this query in any of the following ways:
- Copy and paste the code from the provided text file called
masdtmb_code.txt into the Data Source definition field.
- Click Query Builder to build the query without entering any code manually.
- Type the code in the Data Source definition field.
|
Click Next.
Note:
If you are not already connected to a database, you will be prompted to connect to the database when you click Next. Ensure that you connect to a database that has the appropriate schema for this example. Section 13.1, "Prerequisites for this example" describes the sample schema requirements for this example.
|
- On the Groups page, click Next.
- Click Finish to display your first query in the Data Model view.
- Repeat the steps above for a second query, but this time name your query
Q_Item and use the following SELECT statement:
SELECT CUSTID, DESCRIP, ITEMTOT, ORDERDATE,
ITEM.ORDID
FROM ORD, PRODUCT, ITEM
WHERE ITEM.ORDID = ORD.ORDID
AND ITEM.PRODID = PRODUCT.PRODID
ORDER BY CUSTID, DESCRIP, ORDERDATE
- On the Groups page of the Data Wizard:
- Click CUSTID1 and click the right arrow (>) to move this field to the Group Fields list.
- Do the same for DESCRIP.
Figure 13-2 Groups page of the Data Wizard
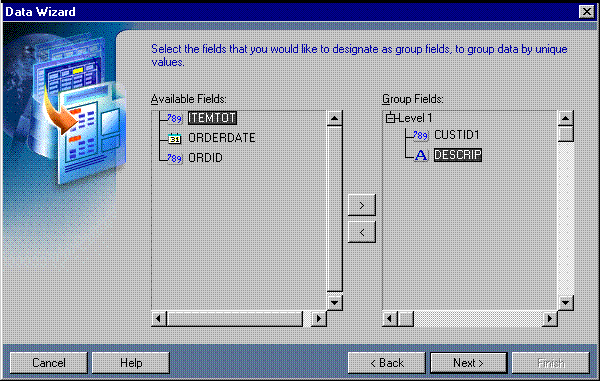
Text description of the illustration masdtmsb_brwiz.gif
- Click Next.
- On the Totals page, click ITEMTOT and click Sum.
- Click Finish to display the data model for your report in the Data Model view. It should look something like this:
Figure 13-3 Two-query data model with summaries
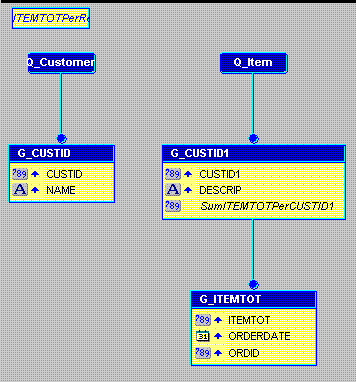
Text description of the illustration masdtmsb_dm_nolink.gif
To add the data link:
- In the Data Model view, click the Data Link tool in the tool palette.
- Click and drag from the CUSTID column in the G_CUSTID group to the CUSTID1 column in the G_CUSTID1 group. Notice that a line is drawn from the bottom of the G_CUSTID group to the Q_Item query. Labels for CUSTID and CUSTID1 are created at each end of the line to indicate they are the columns linking G_CUSTID to Q_Item.
Figure 13-4 Two-query data model with a data link
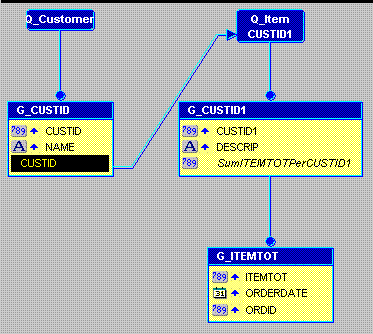
Text description of the illustration masdtmsb_dm_link.gif
- Double-click the new data link line to display the Property Inspector and examine the property settings:
- G_CUSTID is identified as the parent, while Q_Item is listed as the child. In terms of the data, the customer's identifier and name make up the master record and should print once for the associated item order information retrieved by the Q_Item query.
- Notice that WHERE already appears in the SQL Clause property. WHERE is the default clause used in master/detail relationships. You can replace WHERE with other SQL clauses such as HAVING and START WITH, but for this report the default is correct.
- The other point to notice is that an equal sign (=) appears in the Condition property. An equality (i.e., table1.columnname = table2.columnname) is the default condition for master/detail relationships defined via a data link. You can replace the equal sign with any other supported conditional operator (to see what's supported, click on the field), but for this report the default is the proper condition.
13.4 Use the Paper Layout view to create two layouts
Once your data model is complete, you need to create a layout for the data objects to display in the report output. This particular report consists of two separate layouts:
- a group left layout for listing customer purchases individually
- a tabular layout that shows a summary of the customer's purchases by product
Given that two layouts are required, you need to create the first layout through the Report Wizard and the second by inserting a report block. The reason for taking this approach is that the Report Wizard overwrites everything in the layout. Hence, you can only create the first layout through the Report Wizard. Additional layouts must be created by inserting a report block.
To create the first layout:
- Choose Tools > Report Wizard.
- On the Report Type page, select Create Paper Layout only.
- On the Style page, select Group Left.
- On the Groups page, ensure that all of the groups from your data model appear in the Displayed Groups list.
- On the Fields page, ensure that only the following columns appear in the Displayed Fields list:
- NAME
- DESCRIP
- ITEMTOT
- ORDERDATE
Figure 13-5 Fields page of Report Wizard
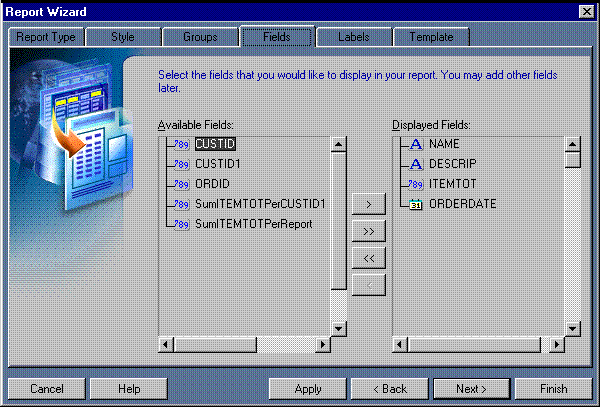
Text description of the illustration masdtmsb_coldisp.gif
- On the Labels page, change the labels and field widths as follows:
Table 13-2 Field Description Labels Page
- On the Template page, make sure Beige is selected under Predefined Template, then click Finish to display your report output in the Paper Design view. It should look like this:
Figure 13-6 Paper Design view for the group left layout with two group columns
Text description of the illustration masdtmsb_out1.gif
To create the second layout:
- Click the Paper Layout button in the toolbar to display the Paper Layout view.
- In the Paper Layout view, click the Report Block tool in the tool palette.
- Starting about 0.5 inches below the existing layout, click and drag a box about 2 inches tall and 4 inches wide. Release your mouse button to display the Report Block Wizard.
- In the Report Block Wizard, on the Style page, select Tabular, then click Next.
- On the Groups page, click G_CUSTID1 and click Down to specify the Print Direction and move this group to the Displayed Groups list, then click Next. (G_CUSTID1 should be the only group in the Displayed Groups list when you are done.)
- On the Fields page, click the following fields and click the right arrow (>) to move them to the Displayed Fields list, then click Next:
- DESCRIP
- SumITEMTOTPerCUSTID1.
DESCRIP and SumITEMTOTPerCUSTID1 should be the only fields in the Displayed Fields list when you are done.
- On the Labels page, change the labels as follows, then click Next:
Table 13-3 Field Description
- On the Template page, make sure Beige is selected under Predefined Template, then click Finish to display your report output in the Paper Design view. It should look like this:
Figure 13-7 Paper Layout view with two layouts
Text description of the illustration Masterb_pla.gif
13.5 Merge the two layouts
After you have created the two layouts, you have only achieved part of your desired result. The summary of purchases by product is outside of the master/detail layout. Hence it summarizes the product purchases for the entire report rather than the product purchases for each customer. To show the summary for each customer, you must move the second layout inside of the first one.
To merge the second layout with the first:
- In the Object Navigator, select M_G_CUSTID1_GRPFR1.
|
Tip:
To make finding this frame easier, just type in the name in the Find field at the top of the Object Navigator.
|
- Click the title bar of the Report Editor to return to the Paper Layout view. Notice that the frame around the second layout is now selected for you.
- Use the arrow keys to position the second layout so that the DESCRIP1 field lines up with the DESCRIP field in the first layout.
- Click the Confine Off button in the toolbar. Ensure that Flex mode is on (it is on by default).
- In the Object Navigator, select R_G_CUSTID.
- Click the title bar of the Report Editor to return to the Paper Layout view. Notice that the master repeating frame in the first layout is now selected for you.
- Click on the handle at the bottom center of R_G_CUSTID and drag it down about a half inch. Because Flex Mode is on, the frame surrounding it grows as you drag. Similarly, the second layout is moved down to avoid being overwritten.
- With R_G_CUSTID still selected, choose Tools > Property Inspector.
- Change the Vertical Spacing Between Frames property to 0.25.
- In the Object Navigator, select M_G_CUSTID1_GRPFR1.
- Click the title bar of the Report Editor to return to the Paper Layout view.
- Using the tool bar along the top of the Paper Layout view, turn Flex Mode off.
- Using the arrow keys, move M_G_CUSTID1_GRPFR1 and its contents inside of the first layout.
Figure 13-8 Paper Layout view with two layouts merged into one
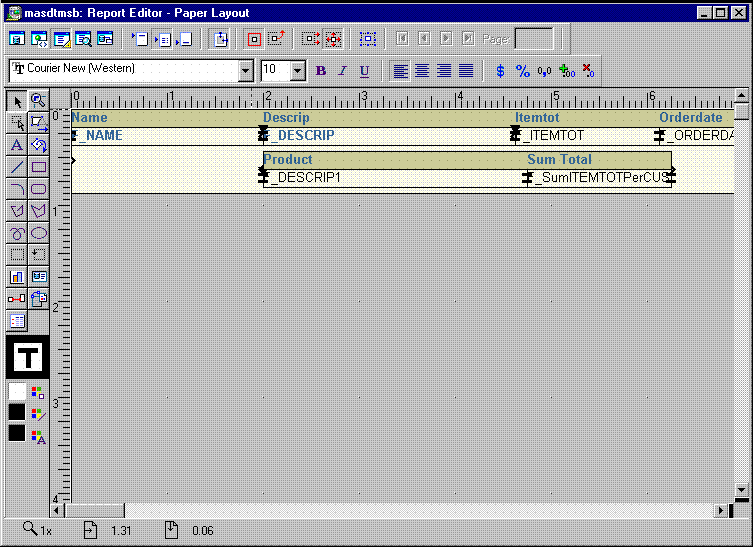
Text description of the illustration masdtmsb_pl1.gif
- Click the Paper Design button in the toolbar of the Report Editor to display the Paper Layout view. Notice how the summary table now repeats for each customer.
Figure 13-9 Paper Design view with two layouts merged
Text description of the illustration masdtmsb_out2.gif
13.6 Format fields
In the Paper Design view, notice the monetary values are neither aligned nor displayed as monetary amounts. You can quickly rectify this in the Paper Design view.
To assign a format mask to monetary values:
- In the Paper Design view, Shift-click on the values underneath the Itemtot and Sum Total. Notice that all of the values are immediately selected, indicating that you can change their properties simultaneously.
- Click the Currency button in the toolbar. A currency symbol immediately appears next to all of the values.
- Click the Add Decimal Place button twice. Two decimal places are added to the right of the decimal point.
- Resize the fields. Click and drag the rightmost handle of the Itemtot field approximately 0.5 inches to the left. Repeat for the Sum Total field. Try to have the right boundaries of the two fields align with each other.
- Click the Align Right button. All of the values are immediately right aligned.
- Shift-click on the Itemtot label and the Sum Total label.
- Click the Align Right button.
- Save your report.
Figure 13-10 Combined group left and tabular report output
Text description of the illustration masdtmsb_fin.gif
13.7 Summary
Congratulations! You have successfully created a group left summary report. You now know how to:
- create two queries with a data link between them.
- create two separate layouts.
- combine the separate layouts into one.
- format monetary values.
For more information on any of the wizards, views, or properties used in this example, refer to the Reports Builder online help, which you can access in two ways: