10g (9.0.4)
Part Number B10602-01
Home |
Contents |
Index |
| Oracle Reports Building Reports 10g (9.0.4) Part Number B10602-01 |
|
Reports Builder enables you to modify the look of your report in multiple ways. In this example, you will build a break report where the line wraps on word boundaries if it is too long to fit on one line.
This report contains a field which is of a fixed horizontal width, but can expand vertically if the contents of the break field are longer than the specified width. The field's contents are not truncated; rather, the contents will wrap within the specified width of the field, and the field will expand vertically.
For more information on break reports, refer to the Reports Builder online help (choose Index, then type "break report" in the box).
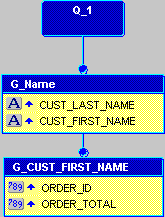
This example is organized like a simple break report: one query and two groups, one of which is user-created. In addition, you'll create three summary columns.
To see a sample wrapped field report, open the examples folder called wrappedbreak, then open the Oracle Reports example report named wrappedbreak.rdf. For details on how to open it, see "Accessing the example reports" in the Preface.
| Feature | Location |
|---|---|
|
Manually create a query. |
|
|
Create three summary columns to calculate various totals and percentages for your report. |
|
|
Create the layout for your paper report. |
Section 15.4, "Create the default layout using the Report Wizard" |
To build the example in this chapter, you must have access to the sample schema provided with the Oracle9i database. If you don't know if you have access to this sample schema, contact your database administrator. You should have access to the "Order Entry" portion of the schema to complete this example.
When you create a report, you can either use the Report Wizard to assist you or create the report yourself. In this example, you will use the Data Model view to create your two queries, then use the tool palette to create a data link between the two queries to relate the data tables.
SELECT ALL CUSTOMERS_A1.CUST_FIRST_NAME,
CUSTOMERS_A1.CUST_LAST_NAME, ORDERS.ORDER_ID, ORDERS.ORDER_TOTAL
FROM CUSTOMERS CUSTOMERS_A1, ORDERS
WHERE (ORDERS.CUSTOMER_ID = CUSTOMERS_A1.CUSTOMER_ID)
ORDER BY CUSTOMERS_A1.CUST_LAST_NAME
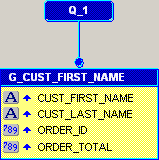
Your data model should now look like this:
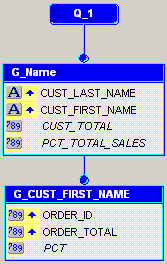
The steps in this section show you how to use the Summary Column tool in the Data Model view to create three summary columns. These columns will calculate the percentage of each order total that the customer has purchased, the total purchases the customer has made, and the percentage of the total sales of all customers.
Your data model should now look something like this:
The steps in this section show you how to use the Report Wizard to create the layout and choose how your data will display in your report. Here, you will choose the style of report you want to create, and choose to display the data across the report (hence creating the across group report).
You can create a default layout using the Report Wizard, which deletes any existing layouts in your report and replaces it with the new one.
| Fields | Width |
|---|---|
|
CUST_FIRST_NAME |
|
|
CUST_LAST_NAME |
|
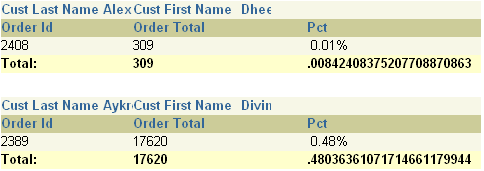
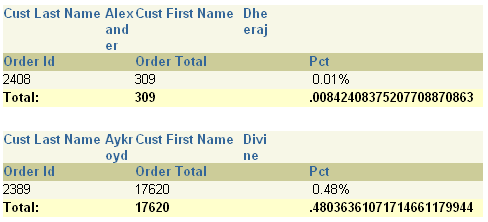
Notice how the complete names do not display. The steps in the next section will show you how to quickly and easily correct this issue.
In this section, you will change the field to expand vertically if the contents of the break field are longer than the specified width. As you can see in Figure 16-3, the width of the fields are fixed, but the names are incomplete. You will also add space to display between each record in the report.
0.25, then press Enter.
You have now modified the layout of your report to display all the text in the wrapped fields, and added space between the records.
In this section, you will run your report to the Paper Design view so you can see how your report displays.
Click the Paper Design button in the toolbar to display the Paper Design view. Your report runs, then displays in the Paper Design view. It should look like the following:
Save your report as wrappedbreak_<your initials>.rdf.
Congratulations! You have successfully created a wrapped field paper report. You now know how to:
For more information on any of the wizards, views, or properties used in this example, refer to the Reports Builder online help, which you can access in two ways:
http://otn.oracle.com/products/reports/), click Documentation and navigate to the Reports Builder Online Help for the most recent, hosted online help.
|
|
 Copyright © 2002, 2003 Oracle Corporation. All Rights Reserved. |
|