| Oracle® Content Database Administrator's Guide for Oracle WebCenter Suite 10g (10.1.3.2) Part Number B32191-01 |
|
|
View PDF |
| Oracle® Content Database Administrator's Guide for Oracle WebCenter Suite 10g (10.1.3.2) Part Number B32191-01 |
|
|
View PDF |
Use the Application Server Control to monitor Oracle Content DB domain, node, service, and server performance. You can use this information to get an overall picture of the performance of the domain, or to determine whether the configuration of the domain needs to be changed.
This chapter provides information about the following topics:
You can use the Application Server Control to view performance information for each Oracle Content DB node (OC4J_Content instance), including number of sessions, JVM threads, and JVM total, used, and free memory.
To view node performance information:
Connect to the Application Server Control and go to the Content DB Home page. See "Accessing the Oracle Content DB Home Page" for information about how to do this.
On the Content DB Home page, click the Performance tab.
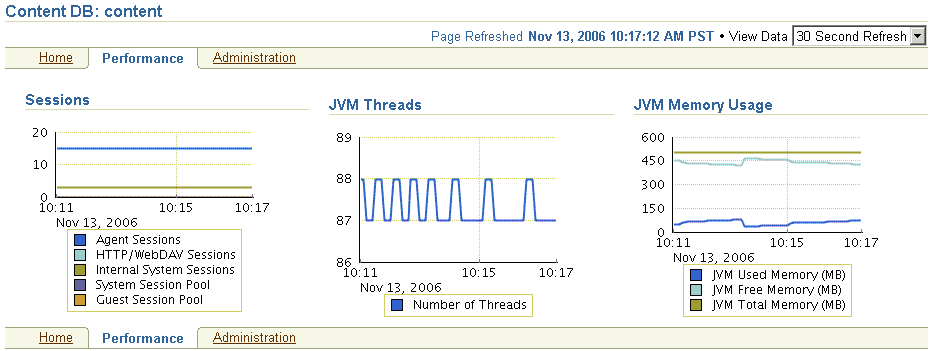
Figure 9-1 shows the Performance tab of the Content DB Home page.
Figure 9-1 Performance Tab of Content DB Home Page

The following charts are displayed:
The Sessions chart provides information about the number of sessions supported by this node. These sessions are Library sessions, not user sessions.
The JVM Threads chart shows the number of JVM threads in the node.
The JVM Memory Usage chart shows the amount of memory being used by the node.
To refresh the information, refresh your browser, or choose one of the following settings for View Data in the upper right portion of the page:
Manual Refresh (requires that you refresh your browser in order to refresh the information)
30 Second Refresh
1 Minute Refresh
5 Minute Refresh
For some browser configurations, the data is refreshed automatically, even if you select Manual Refresh.
You can view real-time statistics for the Committed Data Cache, the Read-Only Connection Pool, and the Writable Connection Pool for each service. You can also reset the statistics.
Connect to the Application Server Control and go to the Content DB Home page. See "Accessing the Oracle Content DB Home Page" for information about how to do this.
Click the name of the service for which you want to see statistics (for example, IfsDefaultService).
Click the Performance tab.
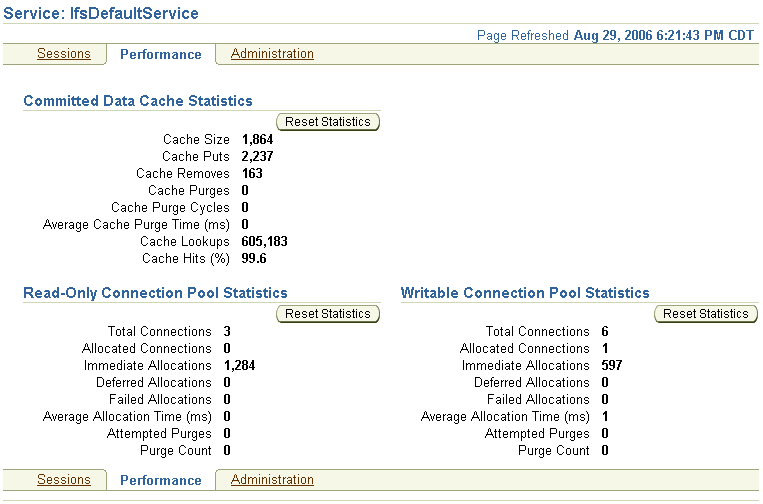
Figure 9-2 shows the Performance tab of the Service page.
Figure 9-2 Performance Tab of Service Page

The Committed Data Cache Statistics section displays the following:
Cache Size
Cache Puts
Cache Removes
Cache Purges
Cache Purge Cycles
Average Cache Purge Time (ms)
Cache Lookups
Cache Hits (%)
The Read-Only Connection Pool Statistics and Writable Connection Pool Statistics sections display the following:
Total Connections
Allocated Connections
Immediate Allocations
Deferred Allocations
Failed Allocations
Average Allocation Time (ms)
Attempted Purges
Purge Count
Click Reset Statistics in the Committed Data Cache, Read-Only Connection Pool, or Writeable Connection Pool areas to reset cache or connection pool statistics.
The Statistics Agent captures the statistics for the Committed Data Cache, as well as the Read-Only and Writeable Connection Pools, and writes them to the application.log file. You can also configure this agent to write statistics to a document stored in the Oracle Content DB repository.
See "Viewing Logs" for information about the application log. See "Statistics Agent" for information about the Statistics Agent.
You can monitor server performance by viewing Dynamic Monitoring Service (DMS) metrics that were defined for some servers. DMS metrics are a special type of performance metric that can be defined in Oracle Application Server. DMS metrics for Oracle Content DB include:
WebDAV Servers
Servers
Some DMS metric information can be viewed on the Content DB Home page, and on the Server page for some servers. For example, the Servers section of the Node page shows the Last Start Time and Last Stop Time for each server, while the Oracle Content DB HTTP Server (EcmHttpServer) page displays Requests Completed, Average Request Processing Time (seconds), Downloaded Content Size (MB), and Uploaded Content Size (MB).
DMS metrics can also be viewed using the dmstool utility and AggreSpy. For more information about DMS metrics and how to view them, see Oracle Application Server Performance Guide.
The following sections provide a list of Oracle Content DB logs, and information about how to view logs in the Application Server Control. This section contains the following topics:
The application log for OC4J_Content records information for nodes. This log is useful for troubleshooting the Oracle Content DB application and the WebDAV server. All errors are logged with stack traces. By default, application logs are located in:
ORACLE_HOME/j2ee/OC4J_Content/application-deployments/Content/OC4J_Content_
default_island_1/application.log
ORACLE_HOME/opmn/logs/Content~OC4J_Content~default_island~1
You can also view ContentConfig.log, the log for the Oracle Content DB Configuration Assistant that ran during Oracle Content DB installation. This log is located in:
ORACLE_HOME/content/log/ContentConfig.log
The changehostname utility generates a log in the same location:
ORACLE_HOME/content/log/changehostname.log
You can view a variety of logs from the Application Server Control. This feature lets you view the logs without having to remember the individual log location.
To view log, click the Logs link in the upper-right corner of any Application Server Control page.
The Log Files page provides a complete list of logs. Expand an entry in the tree to view logs relevant to that entry. For example:
To see the application log for OC4J_Content, expand OC4J, then expand OC4J_Content, then expand Application content.
Expand Enterprise Manager to see Application Server Control logs.
Expand Content DB, then expand Configuration Assistant to view ContentConfig.log.
You can also use the Search function to locate logs. To do this, select the items in the table that correspond to the logs you want to see and click Search.
On the Search Logs page, be sure to select Unknown in the Message Types section. Oracle Content DB logs are not categorized by the other message types listed (Internal Error, Warning, Trace, Error, and Notification).
Click the name of a log to see the log data. By default, the last 500 lines in the log appear in the log viewer. You can view up to 2000 lines. To download the contents of the entire log, click the log name at the top of the screen. If the log is large, the download may take several minutes.
You can use the Application Server Control to change the log level for certain Oracle Content DB processes, using the System MBean Browser.
To change the log level of Oracle Content DB processes:
Access the Application Server Control.
On the Cluster Topology page, in the Members table, click the OC4J_Content instance that is running the processes for which you want to change the log level.
Click the Administration tab.
In the System MBean Browser table row, under the JMX heading, click the Go to Task icon.
In the System MBean Browser tree view, access the J2EELogging option, as follows:
Under the OC4J node in the tree, expand J2EEServer.
Under the J2EEServer node, expand the standalone node.
Expand J2EELogging.
Click the oracle link.
On the MBean: J2EELogging:oracle page, click the Operations tab.
Click setLoggerLevel.
In the Parameters table, in the loggerName table row, enter the name of the logger (Java package) for which you want to set the log level. Table 9-1 shows the loggers that correspond to some Oracle Content DB functional areas.
Table 9-1 Logger Names for Some Oracle Content DB Functional Areas
| Functional Area | Logger Names |
|---|---|
|
All |
oracle.ifs Note: Because oracle.ifs is the root logger for Oracle Content DB, changing the log level for oracle.ifs can greatly increase the output in |
|
Repository/Oracle CM SDK layer |
oracle.ifs.beans oracle.ifs.common oracle.ifs.search oracle.ifs.server |
|
Oracle Content DB business logic layer |
oracle.ifs.ecm |
|
FDK/Client Service layer |
oracle.ifs.fdk |
|
Oracle Content DB Web application |
oracle.ifs.web |
|
WebDAV server |
oracle.ifs.protocols.dav |
|
All agents |
oracle.ifs.ecm.agents oracle.ifs.management.servers |
There are many other Oracle Content DB loggers, in addition to the ones listed in Table 9-1. If you are not sure which loggers to enter, first set the log level for oracle.ifs to FINEST. Then, view the log output in application.log and note the loggers (package names) in which you are interested. Once you know the loggers for which you want to adjust logging, return to the Application Server Control and set the log level for those loggers. Be sure to revert the log level for oracle.ifs after you have set logging for individual loggers, to reduce the output in application.log.
In the Parameters table, in the levelName table row, enter the level of logging you want for the selected logger. Oracle Content DB supports the following levels:
SEVERE: Log only nonrecoverable problems
WARNING: Log only recoverable problems
INFO: General level of log information
FINE: Level for debugging or tracing key operations
FINER: Level for debugging or tracing the entry and exit of methods
FINEST: Level for debugging or tracing within a method
The CONFIG level is not supported for Oracle Content DB logging.
Click Invoke Operation.