| Oracle® Application Server Developer's Guide for Microsoft Office Interoperability 10g Release 3 (10.1.3.1.0) Part Number B28947-01 |
|
|
View PDF |
| Oracle® Application Server Developer's Guide for Microsoft Office Interoperability 10g Release 3 (10.1.3.1.0) Part Number B28947-01 |
|
|
View PDF |
This chapter demonstrates how to deliver business intelligence information to Microsoft Office. It shows how you can save an Oracle Business Intelligence Discoverer worksheet as a Microsoft Excel worksheet and how you can use the Oracle Business Intelligence Spreadsheet Add-In to work with live OLAP data in Microsoft Excel.
This chapter contains the following sections:
Oracle Business Intelligence enables you to rapidly develop and deploy data warehouses and data marts with an integrated array of query, reporting, analysis, data integration and management, desktop integration, and Business Intelligence application development capabilities. Oracle Business Intelligence, available both as a standalone or as part of Oracle Application Server Enterprise Edition, includes the following components:
OracleBI Discoverer: An intuitive ad-hoc query, reporting, analysis, and Web-publishing tool that empowers business users at all levels to gain immediate access to information from data marts, data warehouses, online transaction processing systems, and Oracle E-Business Suite.
OracleBI Spreadsheet Add-In: Provides OLAP data access from within Microsoft Excel worksheets. You can also use the OracleBI Beans Calculation and Query Builder beans to analyze that data.
OracleBI Warehouse Builder: Enables rapid design, deployment, and management of data and metadata.
OracleBI Beans: Builds powerful custom business intelligence applications.
OracleAS Reports Services: Provides enterprise reporting.
Microsoft Excel remains the most widely used worksheet tool. It is also a product with which many users are familiar. While OracleBI Discoverer provides users with a powerful and secure environment to analyze and visualize data from data marts and data warehouses, it may be required at certain times to provide this data to users who do not have access to OracleBI Discoverer. Under this situation, it makes sense to provide users with access to the data in order to use the features of Microsoft Excel to further analyze data. OracleBI Discoverer enables users to do just this by exporting their OracleBI Discoverer worksheets as Microsoft Excel worksheets, with formatting and layout preserved.
OracleBI Discoverer also enables users to export crosstabs as Microsoft Excel pivot tables. This powerful feature means that users neither need to know how to create pivot tables in Microsoft Excel (which can be a nonintuitive exercise for novice users), nor do they need to waste time in report creation; instead they can spend more time on analysis.
Users can e-mail OracleBI Discoverer reports (tables or crosstabs) as Microsoft Excel worksheets to other people. This way they can share the results of their analysis and insight with others. By preserving the layout, format, and certain calculations in the exported worksheet, users can spend more time on analysis and less on re-creating reports.
The use of the Spreadsheet Add-In combines the features of Microsoft Excel with the robustness, security, and scalability of Oracle Database. Users can use the familiar interface of Microsoft Excel, and at the same time, have their data inside a secure Oracle Database. Users can also make use of the powerful analytics built inside the OLAP option of the database.
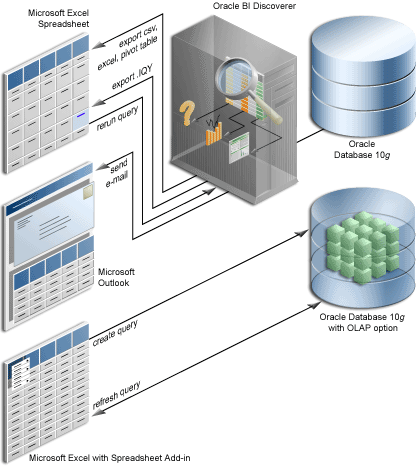
Figure 8-1 illustrates the various ways that Oracle Business Intelligence interoperates with Microsoft Office.
Figure 8-1 Business Intelligence Interoperation with Microsoft Excel
To perform the steps outlined in this chapter, first install the following software:
Oracle Database 10g (10.1.0.3 or later)
Oracle Business Intelligence 10g Release 2 (10.1.2)
See Oracle Business Intelligence Installation Guide for your operating system for more information.
Oracle Business Intelligence Spreadsheet Add-In. You can download this add-in from OTN at
http://www.oracle.com/technology/products/bi/spreadsheet_addin/download/index.html
For instructions on how to install the add-in, read the Installation Guide and Release Notes at
Oracle Business Intelligence samples. The samples are available at
http://www.oracle.com/technology/products/bi/samples
Download the ZIP file and follow the instructions provided in the samples_readme.htm file. You must install the common schema and the OracleBI Discoverer sample workbooks.
|
Tip: It is advisable that this task be performed by a DBA. |
Microsoft Excel 2000 or later
This chapter shows two ways that you can use Oracle Business Intelligence to send business intelligence information to Microsoft Excel:
If you want to share your OracleBI Discoverer worksheet with others, it is helpful to do so using a familiar format that does not require them to install additional software. OracleBI Discoverer enables you to meet this requirement in the following ways:
By viewing an OracleBI Discoverer worksheet on the Web in a browser.
By making a worksheet available in many different formats, including HTML, PDF, CSV, text, and so on.
By saving an worksheet as a Microsoft Excel worksheet. You can export the worksheet to the Microsoft Excel format, and also save any graphs within your worksheet as .PNG (or .GIF) files. You can then insert these graphics into the worksheet. When you export to Microsoft Excel, you can also export formats and formulas, and your worksheet fonts, colors, and styles are preserved.
Three ways you can push business intelligence information to Microsoft Excel are the following:
Saving an OracleBI Discoverer Worksheet as a Microsoft Excel Worksheet
Saving an OracleBI Discoverer Workbook as a Microsoft Excel Web Query
To save an OracleBI Discoverer worksheet as a Microsoft Excel worksheet, perform the following steps:
Start OracleBI Discoverer Plus and connect to the relational data source where you installed the samples as described in Section 8.2, "Prerequisites".
In the Open Workbook from Database dialog box, expand the Sales & Profits by Time, Geography, & Channel sample workbook.
Select the Annual Regional Sales & Profits by Channel sample worksheet and click Open.
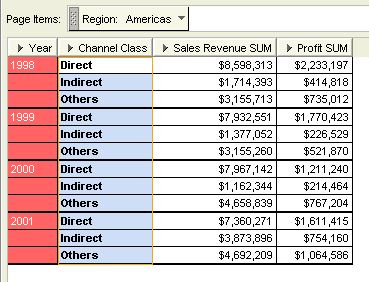
Apply some formatting to the worksheet, for example, make some text bold and add some color (see Figure 8-2).
Figure 8-2 OracleBI Discoverer Worksheet with Formatting
Select File, then Export to display the Export Wizard.
|
Note: You can also click the Export to Excel toolbar button. This exports your worksheet using default settings. If you want to specify the export settings yourself, use the menu. |
Select Current Worksheet.
Click Next.
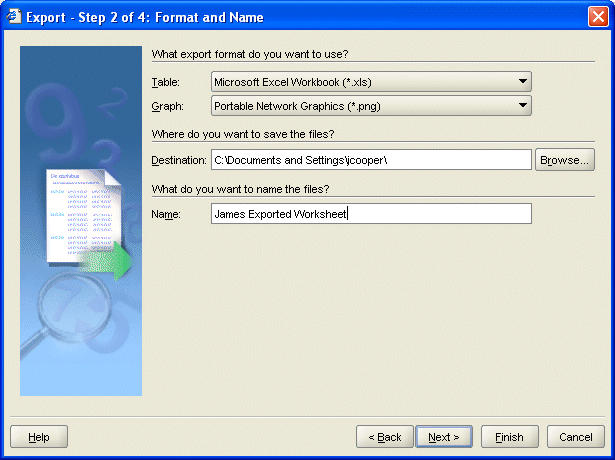
From the Table list, select Microsoft Excel Workbook.
If the worksheet was a crosstab, you could, optionally, select Microsoft Excel Workbook with Pivot Table instead.
From the Graph list, select Portable Network Graphics.
In the Destination field, enter the location where you want to save the exported files. Click Browse, if necessary.
In the Name field, enter <YourName> Exported Worksheet (see Figure 8-3).
Figure 8-3 Exporting a Worksheet in Microsoft Excel Format
Click Next.
Select Use Current On Screen Size for the size of the exported graph.
Click Finish to start the export operation.
When the export operation is completed, the Export Log dialog box displays a list of the files created during the export operation.
Click OK.
Figure 8-4 shows that the formatting you applied earlier has been preserved.
Figure 8-4 Exported Worksheet in Microsoft Excel (with Formatting Preserved)
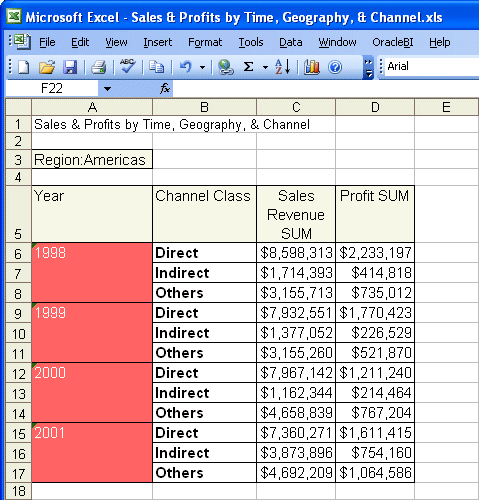
The graph is exported into a separate .PNG file. If you want to include it, you must manually insert it into the Microsoft Excel worksheet.
|
Note: You have the following options when exporting to Microsoft Excel:
In addition, you can export to a CSV (comma-delimited values) format, which is suitable when you do not need formatting and need to conserve the file size. |
You can also export OracleBI Discoverer workbooks in Microsoft Excel Web Query (.IQY) format. This means that the Microsoft Excel worksheet stores the query used to obtain the OracleBI Discoverer data, so that users can refresh the data within Microsoft Excel. This ensures that users can always view the most up-to-date data.
Start OracleBI Discoverer Plus and connect to the relational data source where you installed the samples as described in Section 8.2, "Prerequisites".
Expand the Sales & Profits by Time, Geography, & Channel sample workbook.
Select the Annual Regional Sales & Profits by Channel sample worksheet and click Open.
Select File, then Export to display the Export Wizard dialog box.
Select Current Worksheet.
Click Next.
From the Table list, select Web Query for Microsoft Excel 2000+.
In the Destination field, enter the location where you want to save the exported files. Click Browse, if necessary.
In the Name field, enter <YourName> Exported Worksheet2.
Click Finish to start the export.
When the export is completed, the Export Log dialog displays a list of the files created during the export.
Click OK.
You are prompted to enter the password for the current user.
Enter your password and click OK.
Microsoft Excel connects to the database, then retrieves and displays the latest data.
If you want to send a worksheet directly to another user's e-mail account, you can use OracleBI Discoverer Viewer. You can e-mail the worksheet in a number of formats, such as HTML (in a ZIP file), Oracle Reports, XML, PDF, and a Microsoft Excel workbook.
To send a worksheet as an e-mail attachment, perform the following steps:
Start OracleBI Discoverer Viewer and connect to the relational data source where you installed the samples as described in Section 8.2, "Prerequisites".
Expand the Sales & Profits by Time, Geography, & Channel sample workbook.
Click the Annual Regional Sales & Profits by Channel sample worksheet.
From the Actions list, click Send as e-mail.
From the list, select Microsoft Excel Workbook.
Click Next.
In the Sender field, enter your own e-mail address.
In the Recipient field, enter the e-mail address of the user to whom you want to send the worksheet. For the purposes of this exercise, enter your own e-mail address.
In the Subject field, enter Here is that worksheet.
In the Body field, enter Attached. Regards (see Figure 8-5).
Figure 8-5 Sending a Worksheet as a Microsoft Excel Attachment
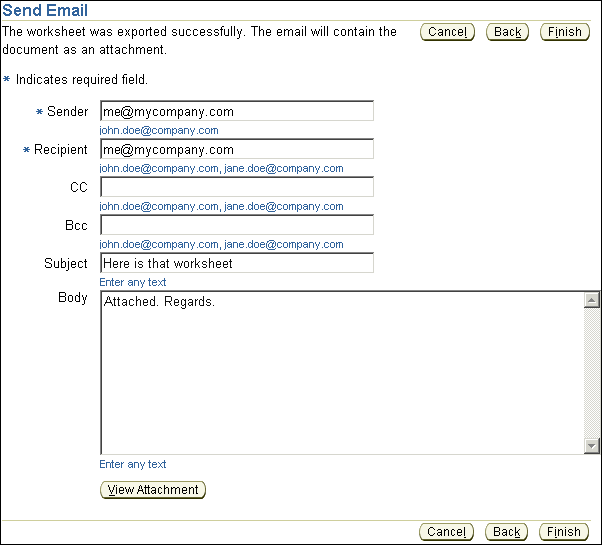
To preview what the attached file will look like, click View Attachment.
Click Finish.
Check your inbox to make sure that you received the worksheet.
Open the message and open the attached Microsoft Excel worksheet.
Many users within an enterprise are more familiar and prefer working with desktop applications, such as Microsoft Excel. Therefore, most enterprises have seen a proliferation of data-extraction programs and downloading of static data into worksheets within their data warehouse environment. This causes enormous problems, both technical and business-related. Continually downloading and manipulating data in this manner causes an ever-expanding range of disconnected worksheets. It is never clear from the worksheet analysis how historical data based on numerous sources is managed. For example, what happens when the source systems are updated or restarted? Because there is no connection to the source data, the user is not alerted to the availability of refreshed data. As a result, it is never clear which worksheet is the latest version. Worksheets also have scalability limitations in terms of the volume of data that can be processed by a single sheet. Again, users resolve this by creating multiple worksheets and attaching them together with formulas.
The OracleBI Spreadsheet Add-In resolves all of these issues and many more. It combines the analytic power and scalability of Oracle OLAP with the familiarity of Microsoft Excel by embedding OLAP capabilities directly within Microsoft Excel. Users report against common business definitions that are stored centrally in Oracle Database. This provides a consistent and high-quality view of their corporate information. In addition, users can perform ad hoc analysis on this data using traditional OLAP exploration techniques such as drilling, pivoting, and paging the view of the data.
To pull data into Microsoft Excel, perform the following steps:
Start Microsoft Excel.
You should see a menu option for OracleBI, as shown in Figure 8-6.
Figure 8-6 OracleBI Spreadsheet Add-In Menu Option

|
Note: If you do not see this option, make sure that you have downloaded and installed the OracleBI Spreadsheet Add-In as described in Section 8.2, "Prerequisites". |
Select OracleBI, then New Query to create a new OLAP query in your worksheet.
Click the Connection Editor tab.
Click New.
Enter an appropriate Description (see Figure 8-7), and then enter the Host Name, Port Number, and SID for the OLAP data source where you installed the samples as described in Section 8.2, "Prerequisites".
Click Save.
Click the OLAP Connection tab.
Enter your User name and Password.
Click Connect.
The Oracle OLAP Query Wizard appears. This is the same as the Query Wizard in OracleBI Discoverer, so if you are already familiar with that, you do not need to learn how to use a new tool.
Click Next to continue from the Welcome page.
The Available list contains all the OLAP measures and dimensions that can be displayed in your worksheet.
Expand the Electronics - KPIs folder, select Sales Revenue, and click the right-angle bracket (>).
In this report, Promotions will not be part of the analysis, so select Promotion and click the left-angle bracket (<) to remove it from the list (see Figure 8-8).
Click Next.
In the Layout step of the wizard, you can change the layout of the data by dragging and dropping the appropriate dimension or measure tiles.
Move Channel to the Page Items region.
Move Product and Geography so that Product is displayed on the Row edge and Geography is displayed first in the Page Items region.
The layout should look like Figure 8-9.
Click Next.
Select the members for the Channel dimension.
Click Channel total, then click the right-angle bracket (>).
Click Next.
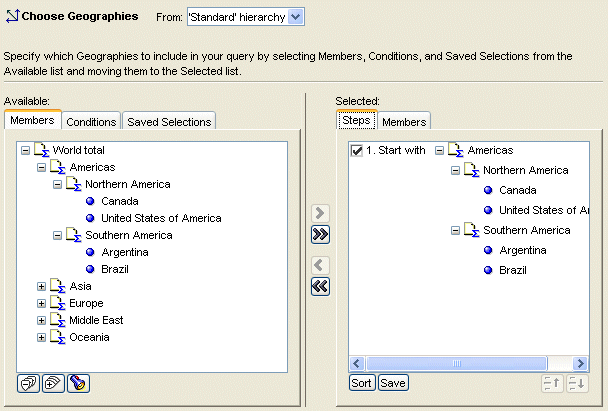
Select the members for the Geography dimension.
Expand the World total node.
Expand the Americas node.
Expand the Northern America and Southern America nodes.
Select the following: Americas; Northern America; Canada; United States of America; Southern America; Argentina; and Brazil, then click the right-angle bracket (>) (see Figure 8-10).
Figure 8-10 Members for the Geography Dimension
Click Next.
Select the members for the Products dimension.
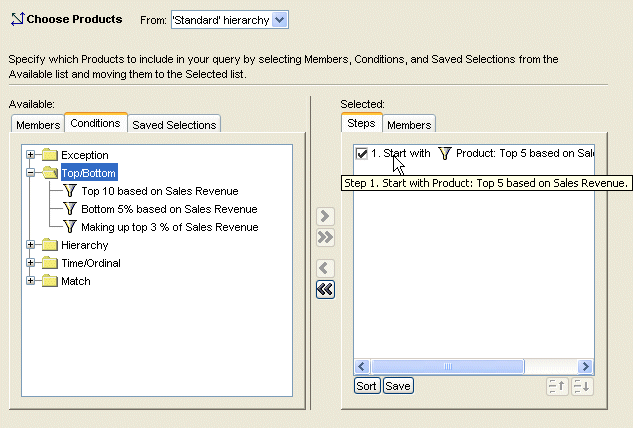
Click the Conditions tab.
Expand the Top/Bottom folder.
Select Top 10 based on Sales Revenue, and click the right-angle bracket (>).
In the Selected list, select the Top 10 condition.
Click the 10 hyperlink, then change the value to 5.
The condition now reads Start with Product: Top 5 based on Sales Revenue (see Figure 8-11).
Figure 8-11 Members for the Products Dimension
Click Next.
For the Times dimension, select 2000 and 2001, then click the right-angle bracket (>).
Click Finish to execute the query. The results should look something like Figure 8-12.
Figure 8-12 OLAP Query Results in Microsoft Excel
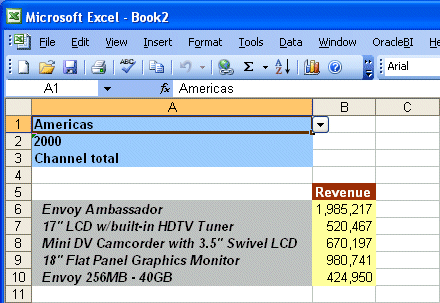
The OLAP query returns the data for the top 5 products based on the sales revenue for the Americas, Channel total, and the year 2000.
Whenever the underlying data changes, you can refresh your worksheet so that it reflects those changes simply by selecting the data and choosing Refresh Query from the OracleBI menu.
Save your worksheet.
The data in the worksheet is preserved. This means that when you close the worksheet or disconnect from the database, you simply have to reconnect to the OLAP data source to retrieve the most recent data.
The results of the query use default formatting. You can use Microsoft Excel's formatting features to change the formatting as required.
In the worksheet, select the cells containing the revenue values.
Click the Currency Style tool.
Currency formatting is applied to the data.
Remove the decimal places by clicking the Decrease Decimal tool twice.
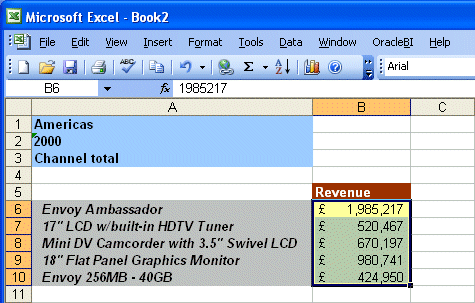
The OLAP data should now look something like Figure 8-13.
Figure 8-13 OLAP Data with Microsoft Excel Formatting
Save your worksheet.
You can add Microsoft Excel calculations, working with the OLAP data just as you would any other data in a Microsoft Excel worksheet.
To add a subtotal formula for the Revenue values, first select the cell below the last Revenue value, then click the Auto Sum tool.
The subtotal formula is created.
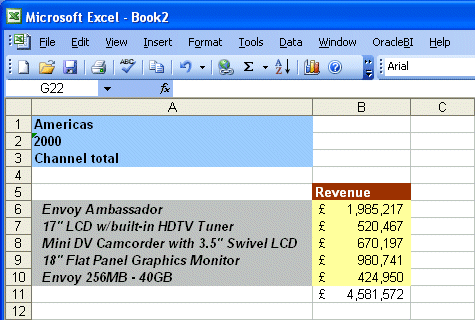
Press Enter to accept the formula. The results should look something like Figure 8-14.
Figure 8-14 Microsoft Excel Subtotal of OLAP Data
Save your worksheet.
You can also use the Microsoft Excel Chart Wizard to create charts based on the OLAP data, just as you do with regular Microsoft Excel data.
Select the product and revenue values, then click the Chart Wizard tool.
From the Chart Type list, select Column.
Click Finish.
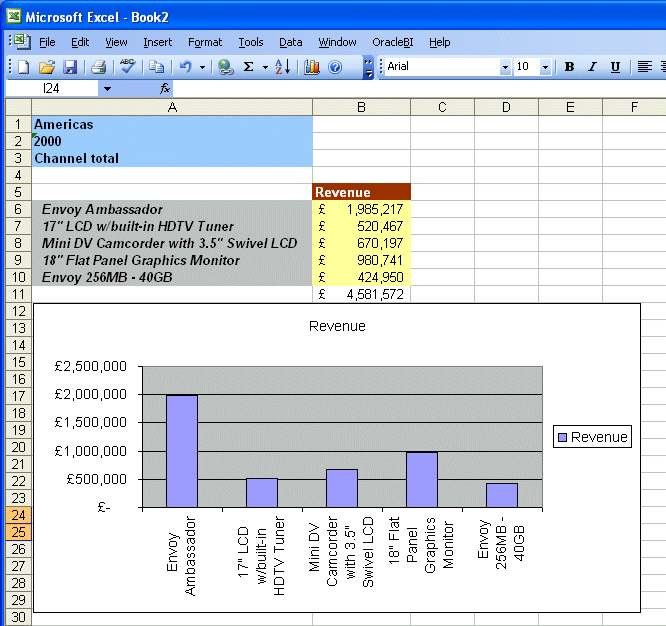
Drag the chart underneath the data and resize it appropriately so that it looks like Figure 8-15.
Figure 8-15 Microsoft Excel Chart Based on OLAP Data
Save your worksheet.
Oracle Business Intelligence Discoverer Plus User's Guide
Oracle Business Intelligence Discoverer Viewer User's Guide